LIMONENE
| Method number: | PV2036 |
| Matrix: | Air |
| Target concentration: | 100 ppm (557 mg/m3)(arbitrary). There is no OSHA permissible exposure level (PEL) or ACGIH threshold limit value (TLV) for limonene. |
| Procedure: | Samples are collected by drawing a known volume of air through a charcoal tube. Samples are desorbed with carbon disulfide and analyzed by Gas Chromatography using a flame ionization detector (GC-FID). |
| Recommended air volume and sampling rate: |
10 L at 0.2 L/min |
| Reliable quantitation limit: | 0.08 ppm (0.44 mg/m3) |
| Status of method: | Partially Evaluated Method. This method has been subjected to established evaluation procedures, and is presented for information and trial use. |
| Date: September 1994 | Chemist: Earl D. Stewart |
Organic Service Branch II
OSHA Salt Lake Technical
Center
Salt Lake City, UT 84165-0200
1. General Discussion
- 1.1 Background
- 1.1.1 History
This evaluation was undertaken to establish a suitable sampling and analytical procedure for limonene. The report describes the analytical method developed for sampling and analysis. (Ref. 5.1.)
1.1.2 Toxic effects (This section is for information only and should not be taken as the basis of OSHA policy.)
Limonene is moderately toxic by ingestion. Poisoning may affect
the kidneys. The oral
1.1.3 Workplace Exposure
Limonene is used as a solvent, wetting and dispensing agent. It is also used in the manufacture of resins, flavoring, fragrance and perfume materials. No information was available on the number of workers potentially exposed. (Ref. 5.3)
1.1.4 Physical properties and other descriptive information. (Ref. 5.2)
| Synonyms: | Dipentene; Acintene DP; Cinerene;
Dipenol; Unitene;
|
| CAS number: | 138-86-3 |
| IMIS: | L129 |
| RTECS: | OS8100000 |
| DOT: | UN2052 |
| Molecular weight: | 136.23 |
| Flash Point: | 43°C |
| Boiling point: | 177°C |
| Melting point: | -96.9°C |
| Appearance: | Colorless |
| Density: | 0.8402 |
| Molecular formula: | C10H16 |
| Structural formula | 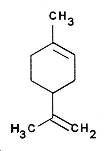 |
The analyte air concentrations throughout this method are based on the recommended sampling and analytical parameters of 10 liters and a desorption volume of 1 mL. Air concentrations listed in ppm are referenced to 25°C and 101.3 kPa (760 mmHg).
- 1.2 Limit defining parameters
- 1.2.1 Detection limit of the overall procedure (DLOP)
The detection limit of the overall procedure is 1.3 µg per
sample (0.02 ppm or
The DLOP is defined as the concentration of analyte that gives a
response
The direct measurement of
| Yobs | = observed response |
| Yest | = estimated response from regression curve |
| n | = total no. of data points |
| k | = 2 for a linear regression curve |
At point YDLOP on the regression curve
A = analytical sensitivity (slope)
therefore
| DLOP = | (YDLOP -
YBR)
A |
Substituting 3(SEE) + YBR for YDLOP gives
| DLOP = | 3(SEE)
A |
The DLOP is measured as mass per sample and expressed as equivalent air concentrations, based on the recommended sampling parameters. Ten samplers were spiked with equal descending increments of analyte, such that the highest sampler loading was 12.072 µg/sample. This is the amount, when spiked on a sampler, that would produce a peak approximately 10 times the background response of a sample blank. These spiked samplers, and the sample blank were analyzed with the recommended analytical parameters, and the data obtained used to calculate the required parameters (A and SEE) for the calculation of the DLOP. Values of 74.3 and 33.1 were obtained for A and SEE respectively. DLOP was calculated to be 1.3 µg/sample (0.02 ppm or 0.13 mg/m3).
|
| |
| mass per sample | area counts |
| (µg) | (µV-s) |
|
| |
| 0 | 0 |
| 1.006 | 0 |
| 2.012 | 134 |
| 4.024 | 292 |
| 5.030 | 375 |
| 6.036 | 463 |
| 7.048 | 548 |
| 8.048 | 606 |
| 9.054 | 678 |
| 11.066 | 796 |
| 12.072 | 836 |
|
| |
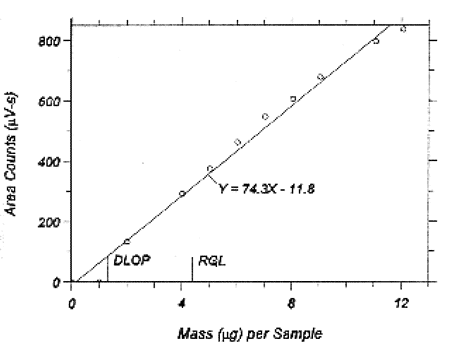
1.2.2 Reliable quantitation limit (RQL)
The reliable quantitation limit is 4.4 µg per sample (0.08 ppm)(0.44 mg/m3). This is the amount of analyte spiked on a sampler that will give a signal that is considered the lower limit for precise quantitative measurements.
The RQL is considered the lower limit for precise quantitative
measurements. It is determined from the regression line data
obtained for the calculation of the DLOP (Section 1.2.1), providing
at least 75% of the analyte is recovered. In this study, the
recovery was 100%. The RQL is defined as the concentration of
analyte that gives a response
therefore
| RQL = | 10(SEE)
A |
2. Sampling Procedure
- 2.1 Apparatus
- 2.1.1 Samples are collected using a personal sampling pump,
calibrated with the sampling device attached, to within ±5% of the
recommended flow rate.
2.1.2 Samples are collected with 4-mm i.d. × 7-cm glass sampling tubes packed with two sections of coconut shell charcoal. The front section contains 110 mg and the back section contains 55 mg coconut shell charcoal. The sections are held in place with glass wool plugs. For this evaluation, tubes were purchased from SKC, Inc.
2.2 Technique
- 2.2.1 Immediately before sampling, break off the ends of the
sampling tube. All tubes should be from the same lot.
2.2.2 Attach the small end of the sampling tube to the pump with flexible tubing. It is desirable to utilize sampling tube holders which have a protective cover to shield the employee from the sharp, jagged end of the sampling tube. Position the tube so that sampled air passes through the front section of the tube first.
2.2.3 Air being sampled should not pass through any hose or tubing before entering the sampling tube.
2.2.4 Attach the sampler vertically with the reference, larger, section pointing downward, in the workers breathing zone, and positioned so it does not impede work performance or safety.
2.2.5 After sampling for the appropriate time, remove the sample and seal the tube with plastic end caps. Wrap each sample end-to-end with a Form OSHA-21 seal.
2.2.6 Submit at least one blank sample with each set of samples. Handle the blank sampler in the same manner as the other samples except draw no air through it.
2.2.7 Record sample volumes (in liters of air) for each sample, along with any potential interferences.
2.2.8 Ship any bulk samples in separate containers from the air samples.
2.2.9 Submit the samples to the laboratory for analysis as soon as possible after sampling. If delay is unavoidable, store samples in a refrigerator.
2.3 Desorption efficiency
The desorption efficiencies (DE) of limonene were determined by
liquid-spiking four groups of six charcoal tubes with 557, 3092, 6200,
and 12612 µg. These amounts represent 0.1, 0.5, 1.0, and 2.0
times the target concentration respectively. These samples were stored
overnight at ambient temperature and then desorbed with 1 mL of
|
| ||||
| % Recovered | ||||
| 0.1× | 0.5× | 1.0× | 2.0× | |
| Tubes# | 557µg | 3092µg | 6200µg | 12612µg |
|
| ||||
| 1 | 100.9 | 98.0 | 96.6 | 94.4 |
| 2 | 103.8 | 95.0 | 96.9 | 96.3 |
| 3 | 103.2 | 97.0 | 94.9 | 95.8 |
| 4 | 104.8 | 95.5 | 96.8 | 96.1 |
| 5 | 99.6 | 96.0 | 94.1 | 95.7 |
| 6 | 97.6 | 96.3 | 95.8 | 94.4 |
| average | 101.6 | 96.3 | 95.9 | 95.5 |
| overall average | 97.3 | |||
| standard | ±2.9 | |||
| deviation | ||||
|
| ||||
2.4 Retention efficiency
The sampling tubes were spiked with 12.612 mg (
|
| |||
| Tube # | Front section | Back section | Total |
| Recovery (%) | Recovery (%) | Recovery (%) | |
|
| |||
| 1 | 95.8 | 0. | 95.8 |
| 2 | 92.5 | 0. | 92.5 |
| 3 | 91.2 | 0. | 91.2 |
| 4 | 91.9 | 0.5 | 92.4 |
| 5 | 92.9 | 0. | 92.9 |
| 6 | 91.6 | 0. | 91.6 |
| average | 92.7 | ||
|
| |||
2.5 Sample storage
The front sections of twelve sampling tubes were each spiked with 6200 µg (111.3 ppm) of limonene. After 6 hours of equilibration, they had 10 liters of humid air (80% RH at 24°C) drawn through them. Six samples were sealed and stored at room temperature and six samples were sealed and stored in the refrigerator at 0°C. Three samples stored at ambient temperature and three refrigerated samples were analyzed after 7 days. The remaining 3 samples of each group were analyzed after 14 days. The amounts recovered indicate good storage stability for the time period studied.
|
| ||||
| Ambient Storage | | | Refrigerator Storage | ||
|
| ||||
| Time | Recovery | | | Time | Recovery |
| (days) | (%) | | | (days) | (%) |
|
| ||||
| 7 | 99.9 | | | 7 | 105.4 |
| 7 | 95.5 | | | 7 | 106.6 |
| 7 | 95.0 | | | 7 | 106.4 |
| 14 | 101.2 | | | 14 | 105.3 |
| 14 | 103.3 | | | 14 | 104.7 |
| 14 | 101.1 | | | 14 | 100.0 |
| average | 99.3 | | | average | 104.7 |
|
| ||||
2.6 Recommended air volume and sampling rate.
- 2.6.1 The recommended air volume is 10 L.
2.6.2 The recommended sampling rate is 0.2 L/min.
2.7 Interferences (sampling)
- 2.7.1 It is not known if any compounds will severely interfere
with the collection of limonene on charcoal. In general, the
presence of other contaminant vapors in the air will reduce the
capacity of the sampling tube to collect limonene.
2.7.2 Any suspected interferences should be reported to the laboratory with submitted samples.
2.8 Safety precautions (sampling)
- 2.8.1 Attach the sampling equipment to the worker in such a
manner that it will not interfere with work performance or safety.
2.8.2 Follow all safety practices that apply to the work area being sampled.
2.8.3 Wear eye protection when breaking the ends of glass sampling tubes.
3. Analytical Procedure
- 3.1 Apparatus
- 3.1.1 A gas chromatograph equipped with an FID. A Hewlett
Packard (HP) model 5890 was used in this evaluation.
3.1.2 A GC column capable of separating the analyte from any
interferences. The column used in this study was a 60-m × 0.32-mm
i.d. DB-1 column,
3.1.3 An electronic integrator or some other suitable method of measuring peak areas. A Waters 860 data system was used in this evaluation.
3.1.4 Two milliliter vials with Teflon® lined caps.
3.1.5 A 10 µL syringe or other convenient size for sample injection.
3.1.6 Pipets for dispensing the desorbing solution. A dispenser may be used.
3.1.7 Volumetric flasks (10 mL and other convenient sizes) for preparing standards.
3.2 Reagents
- 3.2.1 GC grade nitrogen, hydrogen, and air.
3.2.2 Limonene. A 100% pure standard obtained from ICN-K&K Laboratories was used in this evaluation.
3.2.3 Carbon Disulfide, Omnisolve grade, obtained from EM Science.
3.2.4 p-Cymene. p-Cymene was purchased from Aldrich Chemical.
3.2.5 The desorbing solution is carbon disulfide with 0.25 µg/mL p-cymene used as an internal standard.
3.3 Standard preparation
- 3.3.1 At least two separate stock standards are prepared by
diluting a known quantity of limonene with the desorbing solution.
3.3.2 A third analytical standard was prepared at a higher concentration to check the linearity of the detector response to the limonene.
3.4 Sample preparation
- 3.4.1 Sample tubes are opened and the front and the back section
of each tube are placed in separate 2-mL vials.
3.4.2 Each section is desorbed with 1-mL of the desorbing solution.
3.4.3 The vials are sealed immediately and allowed to desorb for 60 minutes with intermittent shaking.
3.5 Analysis
- 3.5.1 Gas chromatograph conditions.
| Injection size: | 1 µL | |
| Flow rates (mL/min) | ||
| Air: | 400 | |
| Hydrogen(carrier): | 1.5 | |
| Hydrogen(detector): | 30 | |
| Nitrogen (make up): | 30 | |
| Temperatures (°C) | ||
| Injector: | 180 | |
| Detector: | 220 | |
| Column: | 110-160 | |
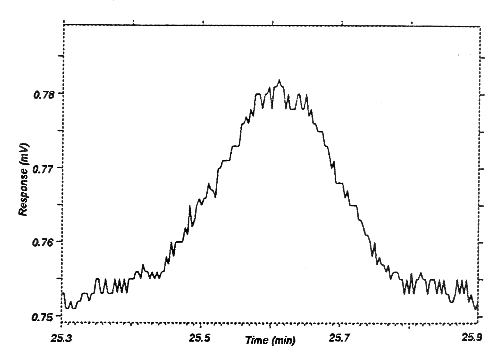
| Retention times (min) | ||
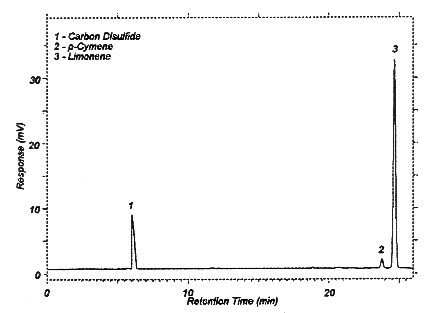
| ISTD: | 24.7 | |
| Limonene: | 25.6 | |
3.5.2 Peak areas are measured by an integrator or other suitable means.
3.6 Interferences (analytical)
- 3.6.1 Any compound that produces a response and has a similar
retention time as the analyte is a potential interference. If any
potential interferences were reported, they should be considered
before samples are desorbed. Generally, chromatographic conditions
can be altered to separate an interference from the analyte.
3.6.2 When necessary, the identity of an analyte may be confirmed
by
3.7 Calculations
- 3.7.1 Construct a calibration curve by plotting detector
response versus concentration (µg/mL) of limonene.
3.7.2 Determine from the calibration curve the concentration (µg/mL) of limonene on each section of the samples and blank.
3.7.3 Blank correct each sample by subtracting the concentration (µg/mL) found in each section of the blank from the concentration (µg/mL) found in the corresponding sections of the samples. Add the results together for the total concentration (µg/mL) for each sample.
3.7.4 Determine the air concentration using the following formula.
| mg/m3 = | (µg/mL, blank corrected) ×
(desorption volume, mL)
(air volume, L) × (desorption efficiency, decimal) |
| ppm = | (mg/m3)(24.46)
136.23 |
| where | 24.46 | = | molar volume (liters) at 101.3 kPa (760 mmHg) and
|
| 136.23 | = | molecular weight of limonene. |
3.8 Safety precautions
- 3.8.1 Avoid skin contact and inhalation of all chemicals.
3.8.2 Wear safety glasses, gloves and a lab coat at all times while in the laboratory areas.
4. Recommendations for Further Study
Collection studies need to be performed from a dynamically generated test atmosphere.
5. References
- 5.1 Searle, E., Determination of Airborne Limonene Vapour by
Charcoal Tube Sampling and
5.2 Occupation Health Services, Material Safety Data Sheets, New
York, N.Y., 10036, Revised,
5.3 Budavari S., "Merck Index", Eleventh Edition, Merck and Co., Rahway N.J., 1989, p. 865.