Triethylamine
Trimethylamine
| Method number: | PV2060 |
| Matrix: | Air |
| Target concentration: | Triethylamine: 10 ppm (41
mg/m3)(ACGIH TWA TLV) Trimethylamine: 10 ppm (24 mg/m3) |
| Procedure: | Samples are collected by drawing a known volume of air through a
10% phosphoric acid coated |
| Recommended air volume and sampling rate: |
10 L at 0.1 L/min (maximum 20 liters at a flow rate of 0.2 L/min) |
| Reliable quantitation limit: | Triethylamine: 0.04 ppm (0.2
mg/m3) Trimethylamine: 0.08 ppm (0.2 mg/m3) |
| Status of method: | Partially Evaluated Method. This method has been subjected to established evaluation procedures, and is presented for information and trial use. |
| Date: December, 1993 | Chemist: Mary E. Eide |
Organic Service Branch I
OSHA Salt Lake Technical
Center
Salt Lake City, UT 84165-0200
1. General Discussion
- 1.1 Background
- 1.1.1 History
There are
1.1.2 Toxic effects (This section is for information only and should not be taken as the basis of OSHA policy.) (Ref. 5.2, 5.3, and 5.4)
TEA and TMA are skin, eye, and mucous membrane irritants. Exposure to high concentrations, or over extended periods of time, can lead to corneal damage. High doses of TEA result in central nervous system stimulation associated with the inhibitory action of TEA on monoamine oxidase activity. Rats exposed to 1000 ppm TEA died in four hours. Rabbits exposed to 50 ppm TEA showed skin and lung irritation. An intravenous injection of 90 mg/kg TMA killed half the mice tested. The OSHA TWA PEL for triethylamine is 25 ppm (100 mg/m3), the ACGIH TWA TLV is 10 ppm (41 mg/m3), and the ACGIH STEL TLV is 15 ppm (62 mg/m3). The ACGIH TWA TLV for trimethylamine is 5 ppm (12 mg/m3) and ACGIH STEL TLV is 15 ppm (36 mg/m3).
1.1.3 Workplace exposure (Ref. 5.5)
Triethylamine is used as a catalytic solvent in chemical synthesis; accelerator activator for rubber; in wetting, penetrating, and waterproofing; as an agent of quaternary ammonium types; in the curing and hardening of polymers; as a corrosion inhibitor, and as a propellant. Trimethylamine is used as an insect attractant; as a warning agent in natural gas; in organic synthesis; in disinfectants; in plastics; as a flotation agent; and in the manufacture of quaternary ammonium compounds. TMA is a natural degradation product of plant and animal residues, and is the major odor produced from rotting marine animals.
1.1.4 Physical properties and other descriptive information (Ref. 5.5 and 5.6)
| Triethylamine | |
| Synonyms: | N,N-Diethylethanamine; (Diethylamino)ethane |
| CAS number: | 121-44-8 |
| IMIS: | 2480 |
| RTECS: | YE0175000; 84562 |
| DOT: | UN 1296 (flammable liquid) |
| Molecular weight: | 101.19 |
| Flash point: | -7°C (20°F)(cc) |
| Boiling point: | 89.7°C |
| Melting point: | -115°C |
| Odor: | strong fishy or amine odor |
| Color: | clear to light yellow liquid |
| Autoignition temperature: | 249°C (480°F) |
| Density: | 0.7255 |
| Molecular formula: | C6H15N |
| Structural formula: | 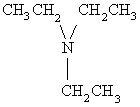 |
| Trimethylamine | |
| Synonyms: CAS number: IMIS: RTECS: DOT: Molecular weight: Flash point: Boiling point: Melting point: Odor: Color: Autoignition temperature: Molecular formula: Structural formula: |
N,N-Dimethylmethanamine 75-50-3 T127 PA0350000; 47804 UN 1083 (flammable gas); UN 1297 (aqueous solution) (flammable liquid) 59.13 12.2°C (10°F) (cc); 25% aqueous solution 3.3°C (38°F)(oc) -4°C -117°C strong fishy or amine odor gas; aqueous solutions are clear to light yellow 190°C (374°F) C3H9N  |
The analyte air concentrations throughout this method are based on the recommended sampling and analytical parameters of 10 liters and a desorption volume of 1 mL. Air concentrations listed in ppm are referenced to 25°C and 101.3 kPa (760 mmHg).
- 1.2 Limit defining parameters
- 1.2.1 Detection limit of the overall procedure (DLOP)
The detection limit of the overall procedure is 1 µg per sample (0.01 ppm or 0.05 mg/m3). This is the amount of analyte spiked on the sampler that will give a response that is significantly different from the background response of a sampler blank.
The DLOP is defined as the concentration of analyte that gives a response (YDLOP) that is significantly different (three standard deviations (SDBR)) from the background response (YBR).
YDLOP - YBR = 3(SDBR)
The direct measurement of YBR and SDBR in chromatographic methods is typically inconvenient, and difficult because YBR is usually extremely low. Estimates of these parameters can be made with data obtained from the analysis of a series of samples whose responses are in the vicinity of the background response. The regression curve obtained for a plot of instrument response versus concentration of analyte will usually be linear. Assuming SDBR and the precision of data about the curve are similar, the standard error of estimate (SEE) for the regression curve can be substituted for SDBR in the above equation. The following calculations derive a formula for the DLOP:
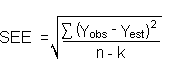
| Yobs | = | observed response |
| Yest | = | estimated response from regression curve |
| n | = | total no. of data points |
| k | = | 2 for a linear regression curve |
At point YDLOP on the regression curve
YDLOP = A(DLOP) + YBR
A = analytical sensitivity (slope)
therefore
| DLOP = | (YDLOP -
YBR)
A |
Substituting 3(SEE) + YBR for YDLOP gives
| DLOP = | 3(SEE)
A |
|
| |
| mass per sample (µg) |
area counts (µV-s) |
|
| |
| 1.03 2.06 3.09 4.12 5.15 6.18 7.21 8.24 9.27 10.3 |
1130 2311 3396 4288 5140 6295 7416 8384 9573 10615 |
|
| |
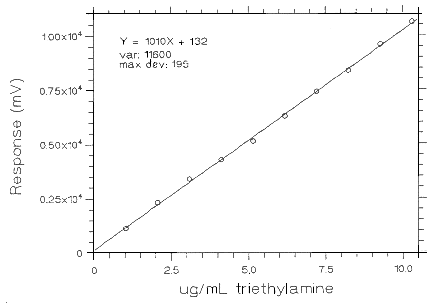
Figure 1.2.1. Plot of TEA data to determine the
DLOP/RQL.
1.2.2 The reliable quantitation limit is 2.0 µg per sample (0.04 ppm TEA or 0.08 ppm TMA). This is the amount of analyte spiked on a sampler that will give a signal that is considered the lower limit for precise quantitative measurements.
The RQL is considered the lower limit for precise quantitative measurements. It is determined from the regression line data obtained for the calculation of the DLOP (Section 1.2.1), providing at least 75% of the analyte is recovered. The RQL is defined as the concentration of analyte that gives a response (YRQL) such that
YRQL - YBR = 10(SDBR)
therefore
| RQL = | 10(SEE)
A |
|
| |
| mass per sample (µg) |
area counts (µV-s) |
|
| |
| 1.01 2.01 3.02 4.03 5.03 6.04 7.05 8.05 9.06 10.1 |
210 468 630 889 1129 1525 1851 2162 2396 2807 |
|
| |
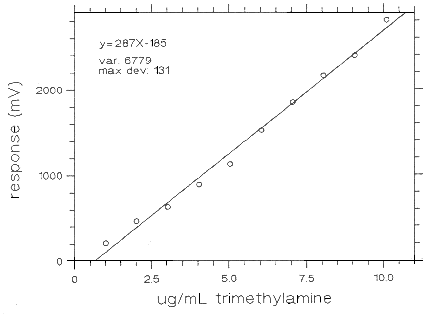
Figure 1.2.2 Plot of TMA data to determine the
DLOP/RQL.
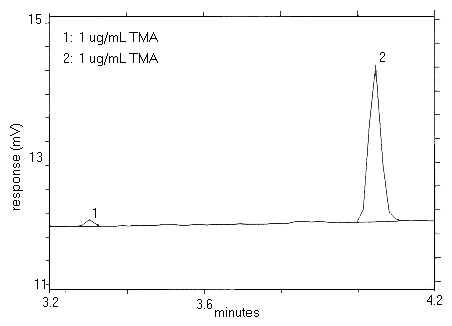
Figure 1.2.3. Chromatogram of the RQL.
2. Sampling Procedure
- 2.1 Apparatus
- 2.1.1 Samples are collected using a personal sampling pump
calibrated, with the sampling device attached, to within ±5% of the
recommended flow rate.
2.1.2 Samples are collected on 10% phosphoric acid coated
2.2 Technique
- 2.2.1 Immediately before sampling, break off the ends of the
sampling tube. All tubes should be from the same lot.
2.2.2 Attach the sampling tube to the pump with flexible tubing. It is desirable to utilize sampling tube holders which have a protective cover to shield the employee from the sharp, jagged end of the sampling tube. Position the tube so that sampled air passes through the reference, larger, section of the tube first.
2.2.3 Air being sampled should not pass through any hose or tubing before entering the sampling tube.
2.2.4 Attach the sampler vertically with the reference, larger, section pointing downward, in the worker's breathing zone, and positioned so it does not impede work performance or safety.
2.2.5 After sampling for the appropriate time, remove the sample
and seal the tube with plastic end caps. Wrap each sample
2.2.6 Submit at least one blank sample with each set of samples. Handle the blank sampler in the same manner as the other samples except draw no air through it.
2.2.7 Record sample volumes (in liters of air) for each sample, along with any potential interferences.
2.2.8 Ship any bulk samples separate from the air samples.
2.2.9 Submit the samples to the laboratory for analysis as soon as possible after sampling. If delay is unavoidable, store the samples in a refrigerator.
2.3 Desorption efficiency
- 2.3.1 The desorption efficiencies (DE) of triethylamine were
determined by
|
| ||||
| 41.4 µg |
207 µg |
414 µg |
828 µg | |
|
| ||||
| DE (%) | 99.2 | 97.6 | 101 | 98.3 |
| 102 | 102 | 101 | 98.5 | |
| 97.2 | 97.4 | 99.2 | 99.6 | |
| 102 | 99.0 | 100 | 102 | |
| 99.6 | 101 | 100 | 102 | |
| 99.5 | 98.8 | 99.0 | 101 | |
| mean | 99.9 | 99.3 | 100 | 100 |
| overall average | 99.9 | |||
| standard deviation | ±1.54 | |||
|
| ||||
2.3.2 The desorption efficiencies (DE) of trimethylamine were
determined by
|
| ||||
| 24.4 µg |
122 µg |
244 µg |
489 µg | |
|
| ||||
| DE (%) | 101 | 98.8 | 99.1 | 101 |
| 97.7 | 101 | 96.1 | 97.2 | |
| 98.8 | 99.3 | 94.9 | 101 | |
| 98.5 | 100 | 102 | 102 | |
| 94.0 | 99.4 | 100 | 97.4 | |
| 95.4 | 97.7 | 102 | 100 | |
| mean | 97.6 | 99.4 | 99.0 | 99.8 |
| overall average | 98.9 | |||
| standard deviation | ±2.27 | |||
|
| ||||
2.4 Retention efficiency
- 2.4.1 The sampling tubes were spiked with 828 µg (20.0
ppm) triethylamine, allowed to equilibrate overnight at room
temperature, and then had 20 liters humid air (86% RH at 23°C)
pulled through them at 0.2 Lpm. They were opened desorbed, and
analyzed by
|
| |||
| Tube # | A section recovery (%) |
B section recovery (%) |
total recovery (%) |
|
| |||
| 1 | 98.9 | 0.0 | 98.9 |
| 2 | 102 | 0.0 | 102 |
| 3 | 99.7 | 0.0 | 99.7 |
| 4 | 102 | 0.0 | 102 |
| 5 | 103 | 0.0 | 103 |
| 6 | 99.8 | 0.0 | 99.8 |
| mean | 101 | ||
|
| |||
2.4.2 The sampling tubes were spiked with 489 µg (20.2
ppm) trimethylamine, allowed to equilibrate overnight at room
temperature, and then had 20 L humid air (83% RH at 21°C) pulled
through them at 0.2 Lpm. They were opened, desorbed, and analyzed by
|
| |||
| Tube # | A section recovery (%) |
B section recovery (%) |
total recovery (%) |
|
| |||
| 1 | 101 | 0.0 | 101 |
| 2 | 100 | 0.0 | 100 |
| 3 | 98.3 | 0.0 | 98.3 |
| 4 | 99.5 | 0.0 | 99.5 |
| 5 | 97.1 | 0.0 | 97.1 |
| 6 | 98.5 | 0.0 | 98.5 |
| mean | 99.1 | ||
|
| |||
2.4.3 A collection study was performed by using a sampling train
consisting of a glass fiber filter in series with a 10% phosphoric
acid coated
|
| ||||||||||
| Sample # |
| | | | | | | | | | | |
TEA GFF |
TEA 'A' |
TEA 'B' |
TEA Total |
| | | | | | | | | | | |
TMA GFF |
TMA 'A' |
TMA 'B' |
TMA Total |
|
| ||||||||||
| 1 | 1.0 | 100 | 0.0 | 101 | 2.0 | 96.6 | 2.0 | 101 | ||
| 2 | 0.0 | 102 | 0.0 | 102 | 0.0 | 102 | 0.0 | 102 | ||
| 3 | 1.0 | 98.0 | 0.0 | 99.0 | 3.2 | 96.4 | 0.0 | 99.7 | ||
| 4 | 1.0 | 100 | 0.0 | 101 | 4.2 | 96.9 | 0.0 | 101 | ||
| mean | 101 | 101 | ||||||||
|
| ||||||||||
2.5 Sample
- 2.5.1 The front sections of six sampling tubes were each spiked
with 414 µg (10.0 ppm) of TEA. Six more tubes had 10 liters
of humid air (82% RH at 21°C) drawn through them before they were
spiked with 414 µg (10.0 ppm) of TEA. They were sealed and
stored at room temperature. Three dry samples and three humid air
samples were analyzed after 7 days and the remaining three samples
of each after 14 days. The amounts recovered, corrected for
desorption efficiency, indicate good storage stability for the time
period studied.
|
| ||||
| Dry Samples | | | | | | | | | | | | | | | |
Humid Air Samples | ||
|
| ||||
| time (days) |
recovery (%) |
time (days) |
recovery (%) | |
|
| ||||
| 7 | 101 | 7 | 100 | |
| 7 | 99.2 | 7 | 101 | |
| 7 | 99.5 | 7 | 99.9 | |
| 14 | 99.5 | 14 | 99.6 | |
| 14 | 98.8 | 14 | 99.3 | |
| 14 | 99.2 | 14 | 98.1 | |
| mean | 99.5 | mean | 99.7 | |
|
| ||||
2.5.2 The front sections of six sampling tubes were each spiked with 244 µg (10.1 ppm) of TMA. Six more tubes had 10 liters of humid air (81% RH at 21°C) drawn through them before they were spiked with 244 µg (10.1 ppm) of TMA. They were sealed and stored at room temperature. Three dry samples and three humid air samples were analyzed after 7 days and the remaining three samples of each after 14 days. The amounts recovered, corrected for desorption efficiency, indicate good storage stability for the time period studied.
|
| ||||
| Dry Samples | | | | | | | | | | | | | | | |
Humid Air Samples | ||
|
| ||||
| time (days) |
recovery (%) |
time (days) |
recovery (%) | |
|
| ||||
| 7 | 101 | 7 | 103 | |
| 7 | 99.3 | 7 | 101 | |
| 7 | 103 | 7 | 99.4 | |
| 14 | 99.6 | 14 | 99.9 | |
| 14 | 99.8 | 14 | 99.4 | |
| 14 | 97.1 | 14 | 97.8 | |
| mean | 100 | mean | 100 | |
|
| ||||
2.6 Precision
- 2.6.1 The precision was calculated using the area counts from
six injections of each standard at concentrations of 20.7, 104, 207,
and 414 µg/mL triethylamine in the desorbing solution.
|
| ||||
| injection # | 20.7 µg/mL |
104 µg/mL |
207 µg/mL |
414 µg/mL |
|
| ||||
| 1 | 22408 | 115255 | 242174 | 518445 |
| 2 | 22424 | 111279 | 241752 | 516027 |
| 3 | 21931 | 113935 | 243488 | 523164 |
| 4 | 22242 | 113361 | 240352 | 520050 |
| 5 | 22245 | 112715 | 236823 | 516514 |
| 6 | 21903 | 112091 | 236531 | 516575 |
| mean | 22192 | 113106 | 240187 | 518463 |
| standard deviation |
±227 | 1407 | 2898 | 2754 |
|
| ||||
2.6.2 The precision was calculated using the area counts from six injections of each standard at concentrations of 12.2, 61.0, 122, and 244 µg/mL trimethylamine in the desorbing solution.
|
| ||||
| injection # | 12.2 µg/mL |
61.0 µg/mL |
122 µg/mL |
244 µg/mL |
|
| ||||
| 1 | 3892 | 17895 | 36866 | 73132 |
| 2 | 3790 | 18178 | 36869 | 74586 |
| 3 | 3786 | 18556 | 36112 | 73943 |
| 4 | 3742 | 18051 | 35411 | 73407 |
| 5 | 3847 | 18650 | 35520 | 73706 |
| 6 | 3791 | 18533 | 35019 | 73315 |
| mean | 3808 | 18311 | 35966 | 73682 |
| standard deviation |
±53.0 | 311 | 781 | 529 |
|
| ||||
2.7 Recommended air volume and sampling rate.
Based on the data collected in this evaluation, 10 L air samples should be collected at a sampling rate of 0.1 L/min.
2.8 Interferences
- 2.8.1 It is not known if any compounds will severely interfere
with the collection of TEA and TMA on 10% phosphoric acid coated
2.8.2 Suspected interferences should be reported to the laboratory with submitted samples.
2.9 Safety precautions (sampling)
- 2.9.1 The sampling equipment should be attached to the worker in
such a manner that it will not interfere with work performance or
safety.
2.9.2 All safety practices that apply to the work area being sampled should be followed.
2.9.3 Protective eye wear should be worn when breaking the ends of the glass sampling tubes.
3. Analytical Procedure
- 3.1 Apparatus
- 3.1.1 The instrument used in this study was a gas chromatograph
equipped with a flame ionization detector, specifically a Hewlett
Packard model 5890.
3.1.2 A GC column capable of separating the analyte from any interferences. The column used in this study was a 60 meter Stabilwax DB, 1.0 µ film thickness, 0.32 mm i.d..
3.1.3 An electronic integrator or some suitable method of measuring peak areas.
3.1.4 Two milliliter vials with
3.1.5 A 10 µL syringe or other convenient size for sample injection.
3.1.6 Pipets for dispensing the desorbing solution.
3.1.7 Volumetric flasks - 10 mL and other convenient sizes for preparing standards.
3.2 Reagents
- 3.2.1 GC grade nitrogen, hydrogen, and air.
3.2.2 Triethylamine, Reagent grade
3.2.3 Trimethylamine, Reagent grade
3.2.4 Methanol, HPLC grade
3.2.5 Sodium hydroxide, reagent grade
3.2.6 Deionized water, pH adjusted to 7
3.2.7 1.0 N NaOH was prepared by adding 4 grams of NaOH to 100 mL deionized water. This solution should be prepared fresh with each analysis as the concentration of sodium hydroxide solutions change with exposure to air.
3.2.8 The desorbing solution was prepared by mixing 50 mL methanol with 50 mL deionized water that had been pH adjusted to 7.
3.2.9 The neutralizing solution was prepared by mixing 20 mL 1.0 N NaOH with 80 mL methanol.
3.3 Standard preparation
- 3.3.1 At least two separate stock standards are prepared by
diluting a known quantity of TEA and TMA with 1:4 water:methanol pH
adjusted to 7 or slightly more basic.
3.3.2 Dilutions of the stock standards should be prepared to bracket the range of the samples. The standards used in this study ranged from 1 to 414 µg/mL.
3.4 Sample preparation
- 3.4.1 Sample tubes are opened and the front and back section of
each tube are placed in separate 2 mL vials.
3.4.2 Each section is desorbed with 1 mL of 1:1 water:methanol.
3.4.3 The vials are sealed immediately and allowed to desorb for 30 minutes with constant shaking.
3.4.4 A 0.5 mL aliquot of each sample is removed, being careful to leave the media behind, placed into a 2 mL vial, and 0.5 mL of a 1:4 solution of 1.0 N NaOH:methanol is added to neutralize the sample. The vial is sealed and shaken briefly to mix well, and then analyzed. The liquid in the vial may appear to be cloudy; this will settle out upon sitting. If the solution of 1:4 1.0 N NaOH:methanol is not freshly prepared, check its ability to neutralize the samples by desorbing a blank tube. If the resulting solution of adding 0.5 mL of the sample to 0.5 mL of the 1:4 1.0 N NaOH:methanol is pH 7 or more basic, the 1:4 solution may be used.
3.5 Analysis
- 3.5.1 Gas chromatograph conditions.
| Injection size: | 1 µL |
| Flow rates (mL/min) | |
| Nitrogen (make-up): | 30 |
| Hydrogen(carrier): | 2 |
| Hydrogen(detector): | 60 |
| Air: | 450 |
| Retention times (min) | |
| Trimethylamine: | 3.28 |
| Triethylamine: | 4.03 |
| Methanol: | 6.10 |
| Temperatures (°C) | |
| Injector: | 180 |
| Detector: | 220 |
| Column: | 80° for 2 min then 10°/min to 130° for 3 min |
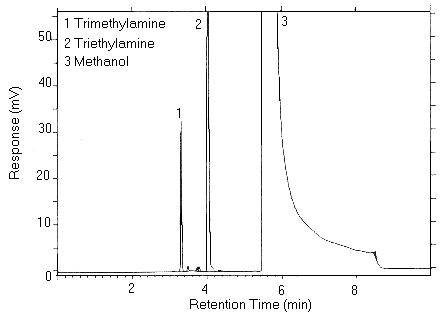
Figure 3.5.1 Chromatogram of the target concentration.
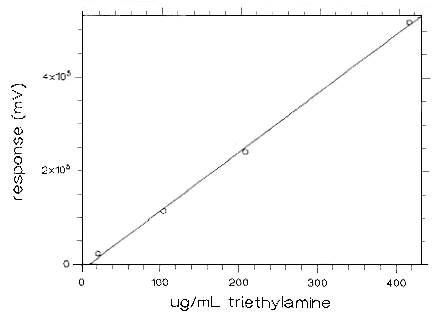
Figure 3.5.2 Calibration curve for TEA based on
standards presented in 2.6.1.
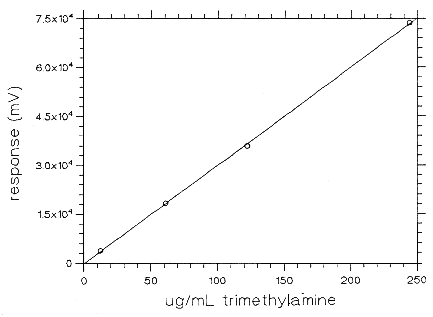
Figure 3.5.3 Calibration curve for TMA based on
standards presented in 2.6.2.
3.5.2 Peak area are measured by an integrator or other suitable means.
3.6 Interferences (analytical)
- 3.6.1 Any compound that produces a response and has a similar
retention time as the analyte is a potential interference. If any
potential interferences were reported, they should be considered
before samples are desorbed. Generally, chromatographic conditions
can be altered to separate an interference from the analyte.
3.6.2 When necessary, the identity or purity of an analyte peak
may be confirmed by
3.7 Calculations
- 3.7.1 The instrument was calibrated with a standard of 207
µg/mL TEA and 122 µg/mL TMA in the desorbing solution.
The linearity of the calibration was checked with standards over the
range of 1 to 414 µg/mL.
3.7.2 If the calibration is non-linear, two or more standards at different concentrations must be analyzed, bracketing the samples, so a calibration curve can be plotted and sample values obtained.
3.7.3 To calculate the concentration of analyte in the air sample the following formulas are used:
| (µg/m) (desorption volume)
(desorption efficiency) |
= mass of analyte in sample |
| (mass of analyte in sample)
molecular weight |
= number of moles of analyte |
| (number of moles of analyte) |
(molar volume at 25°C & 760mm) |
= | volume the analyte
will occupy at 25°C & 760mm |
| (volume analyte occupies)
(106)*
(air volume) |
= ppm |
* All units must cancel.
3.7.4 The above equations can be consolidated to the following formula.
| (µg/mL)(DV)(24.45)(106)
(10 L)(DE)(MW) |
× | (g)
(1000 mg) |
× | (mg)
(1000 µg) |
= ppm |
| µg/mL | = concentration of analyte in sample or standard |
| 24.45 | = Molar volume (liters/mole) at 25°C and 760 mm |
| MW | = Molecular weight (g/mole) |
| DV | = Desorption volume |
| 10 L | = 10 liter air sample |
| DE | = Desorption efficiency |
note: the desorption volume should include the dilution
factor from the neutralization,
i.e., 1 mL desorption
× [1 mL analyzed/0.5 mL of sample] = 2
3.7.5 This calculation is done for each section of the sampling tube and the results added together.
3.8 Safety precautions
- 3.8.1 Avoid skin contact and inhalation of all chemicals.
3.8.2 Wear safety glasses, gloves and a lab coat at all times while in the laboratory areas.
4. Recommendations for Further Study
Collection studies using known vapor concentrations of TEA and TMA need to be performed, along with reproducibility studies.
5. References
- 5.1 "NIOSH Manual of Analytical Methods", U.S. Department of
Health, Education, and Welfare, Public Health Service, Center for
Disease Control, National Institute for Occupational Safety and
Health, Second Edition, Vol. 1, Method 221.
5.2 "Documentation of the Threshold Limit Values and Biological Exposure Indices", Fifth Edition, American Conference of Governmental Industrial Hygienists Inc., Cincinnati, OH, 1986, p. 604 and 607.
5.3 "1993-1994 Threshold Limit Values for Chemical Substances and Physical Agents and Biological Exposure Indices", American Conference of Governmental Industrial Hygienists Inc., Cincinnati, OH, 1993, p. 34.
5.4 "Federal Register", 1993, 29 CFR, OSHA 1910 (Wed., June 30),
5.5 Lewis, R., "Hawley's Condensed Chemical Dictionary", Twelfth Edition, Van Nostrand Reinhold Co., New York, 1993, p. 1174 and 1181.
5.6 Windholz, M., "The Merck Index", Eleventh Edition, Merck & Co., Rahway N.J., 1989, p. 1521 and 1528.