COLLECTING MERCURY VAPOR
Introduction
Several methods used to determine personal exposure to mercury vapor have been reported (13.1.-13.7.). A few of these methods employed passive monitors as the sample collection device. Passive monitors require no sampling pumps and usually are simpler to use than active samplers. Some passive mercury monitors must be analyzed by the manufacturer. A mercury dosimeter (SKC Inc., Eighty Four, PA) that can be analyzed in any laboratory equipped with a cold-vapor atomic absorption spectrophotometer (CV-AAS) is commercially available. This mercury dosimeter samples workplace air by diffusion of mercury vapor through polyethylene mesh discs which are located at the face of the badge. The mercury is then collected on a solid sorbent capsule containing approximately 800 mg of Hydrar® which resides in a plastic housing. The Hydrar® is analyzed by cold vapor, the capsule is discarded, and the plastic housing, after decontamination, is reusable.
According to the manufacturer, the sampling rate of the dosimeter badge at 20°C is 0.020 L/min when used in face velocities normally seen in industrial environments (13.7.). This dosimeter has been extensively evaluated at the OSHA Salt Lake City Analytical Laboratory for use in compliance sampling.
(Note: The SKC dosimeter badge was modified by the manufacturer after this evaluation was performed. The dimensions of the badge housing were reduced and a metal O-ring replaced the Viton® O-ring previously used to hold the polyethylene discs in place. Extensive field studies were performed with the modified dosimeter badge after this evaluation. These studies compared this dosimeter to active samplers; results indicated good agreement. See reference 13.8. for more information.)
1. Evaluation Protocol
A laboratory evaluation was conducted over a broad range of mercury concentrations and variable sampling times for the Gas Monitoring Dosimeter Badges manufactured by SKC Inc., Eighty Four, PA. Mercury concentrations of about 0.05, 0.1, and 0.2 mg/m3 were used, which at to time of this study (1982) was equivalent to 0.5, 1, and 2 times the OSHA PEL (13.9.) The evaluation consisted of the following experiments:
- Analysis - desorption efficiency
- Sampling rate
- Sampling and analysis
- Storage stability
- Reverse diffusion
- Sampling times
- Sampling rate dependence on face velocity
- Comparison of methods
All tests were performed at 80% RH and 25°C using a minimum of six dosimeters for each test. The tests were performed at atmospheric conditions of about 640 to 660 torr and 20 to 25°C. All results for the active sampling hopcalite sorbent have been pressure and temperature corrected to sampling site conditions.
Unless otherwise noted, a face velocity of about 15 m/min (50 ft/min) was used when exposing the dosimeters to mercury atmospheres.
2. Laboratory Generation System
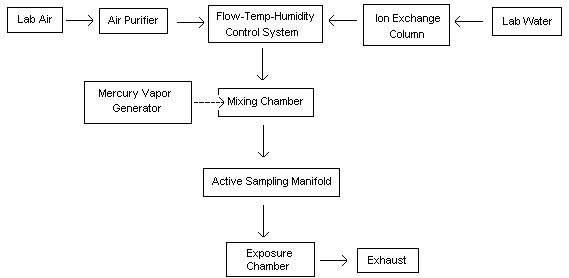
A diagram of the generation system used for the evaluation is shown in Figure 1. The system consisted of five main components:
- Humidity, temperature, and flow control system
- Mercury vapor generating system (saturation unit)
- Mixing manifold
- Active sampling manifold
- Dosimeter exposure chambers
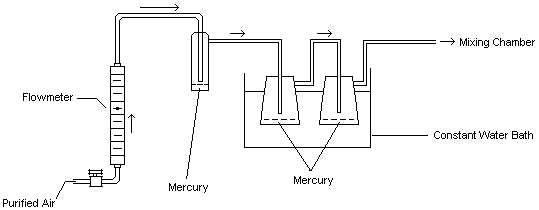
This generation technique is based on the ability of mercury to readily evaporate at normal temperatures. The gas flow through the system and subsequent generation of mercury vapor is described: Diluent air was passed through a particulate filter, an indicating silica gel bed, and a charcoal bed to remove any impurities and water vapor. This purified air stream was split into two separate lines. One line passed through a humidity, temperature, and flow control system (Miller-Nelson Research, Model # HCS-301) for conditioning. The other line flowed through a low range flowmeter into a mercury vapor saturation unit as shown in Figure 2. This unit consisted of an enclosed glass flask containing a temperature-controlled pool of mercury. The mercury-ladened air leaving this unit then flowed through two 500-mL equilibrium vessels which were immersed in a constant temperature (±0.02°C) water bath. The saturated mercury/air mixture was then mixed with the conditioned air to achieve the desired test concentration, temperature, and humidity (25°C, 80% RH). The final controlled concentration of mercury vapor flowed into a Teflon sampling manifold (for hopcalite sorbent sampling) and also into one of two different glass exposure chambers for exposing passive monitors. For a portion of the face velocity study, this mercury vapor flowed through an aluminum chamber instead of the glass chamber. The aluminum chamber, which contained an electric fan for producing different face velocities, was obtained from 3M (3M Co., St. Paul, MN). A similar chamber is described in reference 13.10.
3. Sample Collection and Analysis
The dosimeter and hopcalite sampling devices were exposed side-by-side following the step-by-step experimental procedure described in Appendix A. A Jerome Model 401 gold film mercury vapor analyzer (Arizona Instrument Corp., Jerome, AZ) was used as a direct reading device to periodically monitor the generation of mercury during the side-by-side sampling.
After sampling, the Hydrar® sorbent and hopcalite were separately dissolved in concentrated nitric acid (HNO3) and then hydrochloric acid (HCl). Each sample was diluted with deionized water to a specified volume. Aliquots of each sample were then analyzed for mercury by a cold vapor technique. Mercury vapor was swept from each sample by an air stream after an excess amount of stannous chloride was added. The mercury vapor was then analyzed by atomic absorption using a quartz cell as the absorption path. Detailed analytical procedures for the Hydrar® sorbent are described in references 13.7., or 13.11.; reference 13.12. for hopcalite. Analytical procedures for either sorbent are essentially identical. This evaluation used procedures mentioned in reference 13.11. with one exception; the analyzed matrix for samples and standards was 5% HCl and 5% HNO3 instead of approximately 10% HNO3.
For all experiments except sampling and analysis (Section 6), known concentrations of mercury produced in the generation system were determined from the hopcalite results. In order to calculate overall error, the sampling and analysis experiment used theoretical values [based on the vapor pressure of mercury (13.13.)] as known concentrations.
Results from the hopcalite samples were compared to theoretical calculations and also to results obtained using the Jerome Mercury
Analyzer. The results of these comparisons are summarized in Table 1, which show close agreement for the three different types of measurement.
4. Desorption Efficiency
Procedure: A study was conducted in which three sets of spiked samples were prepared by adding appropriate volumes of a mercury stock solution into sorbent capsules. Each set contained six samples. The concentrations of the spiked capsules corresponded to 0.5, 1.0, and 2.0 µg. At the time of the study these spikes were equivalent to 0.5, 1, and 2 times the PEL (if taking an 8-h sample at a sampling rate of 0.020 L/min). The spiked capsules were allowed to sit overnight before analyzing.
Results: Results in Table 2 indicate the average desorption efficiency (DE) is so close to 1.0 that a DE correction is not necessary.
5. Sampling Rate
Procedure: The dosimeter sampling rate was experimentally examined by measuring the mass of mercury collected by the sorbent when exposed to different concentrations of mercury. Side-by-side samples of hopcalite and dosimeters were taken from the generation system at three different concentration levels, 0.066, 0.108, and 0.203 mg/m3 mercury. Exposure times ranged from 240 to 1,415 min. The sampling rate for each test was calculated using:
| sampling rate (L/min) = | Hg found (µg)
Hop Hg (mg/m3) × sampling time (min) |
Where:
| Hg found | = | amount of mercury found in the dosimeter sample |
| Hop Hg | = | air concentration of mercury in the generation system as determined by the hopcalite sampler |
Results: Table 3 summarizes the sampling rate found when monitors were exposed to different mercury concentrations. The sampling rate was calculated assuming the dosimeter has 100% collection efficiency for mercury [Note: More detailed descriptions for the determination of sampling rate have been reported (13.14., 13.15.)]. An average sampling rate of 0.01849 ± 0.00119 L/min was obtained which is very close to the manufacturer's stated value of 0.020 L/min at 20°C (13.7.); however, the dosimeter sampling rate appeared to slightly decrease when sampling times were greater than 8 h.
6. Sampling and Analysis
Procedure: Six dosimeter samples at each of three different concentration levels were taken to determine the precision and accuracy of the passive monitor near the OSHA PEL. Overall error (OE) of the sampler at defined test levels was examined and calculated as:
where i is the respective sample pool being examined.
Results: Precision and accuracy data based on the NIOSH statistical protocol (13.16.) is presented in Table 4. The pooled coefficients of variation for spiked (CV1) and generated (CV2) samples and overall
CVT were as follows:
CV1(pooled) = 2.7% CV2(pooled) = 3.7% CVT(pooled) = 3.9%
The bias found in generated sample results over the concentration range tested was -0.8% and OE was ±8.3%.
7. Storage Stability
Procedure: A study was conducted to assess the stability of the monitors when stored under normal laboratory conditions. Four sets, each containing six monitors, were exposed to 0.108 mg/m3 mercury. The monitors were then stored on a laboratory bench. The first set of monitors was analyzed 1 day after exposure, the second set 5 days, the third set 14 days, and the last set 30 days.
Results: The results in Table 5 show that the collected sample is stable for at least 30 days. Average values were within ±10% of the known generated mercury concentration.
8. Reverse Diffusion
Procedure: A reverse diffusion test was used to determine if there is significant diffusion of mercury from the dosimeter sorbent back into the atmosphere after collection. Two sets of samples were used for this study. The first set of six monitors was exposed to 0.2 mg/m3 mercury and 15.2 m/min (50 ft/min) face velocity for 4 h. The second set of six monitors was exposed using the same conditions, except these monitors were exposed continuously for another 4 h in purified air which contained no mercury vapor. A face velocity of 15.2 m/min was also used for the purified air.
Results: As shown in Table 6, the difference between the means of the two sets was less than 3%. These results indicate reverse diffusion should not be a significant problem during an 8-h sampling period.
9. Face Velocity
Procedure: To examine the SKC monitor sampling rate at various face velocities, a series of experiments were designed to test monitor uptake of mercury at selected face velocities in the range of 1.04 to 91.4 m/min (3.4 to 300 ft/min). Dosimeter and hopcalite samples were taken side-by-side. The collection of mercury with the hopcalite active sampling device is independent of face velocity at the levels tested.
As previously mentioned in Section 2, different exposure chambers were used for this experiment, two glass and one aluminum. Physical characteristics of the glass chambers are described in Table 7. The face velocity was altered by adjusting the contaminant flow rate through the glass chambers or by changing the speed of a fan located within the aluminum chamber. The first three tests (face velocities of 1.04 to 15.2 m/min) were performed using the glass chambers and a horizontal flow of contaminant at the badge faces. The final two tests were performed in the aluminum chamber, using the fan to circulate the controlled mercury atmosphere in the chamber and to provide two different face velocities. Average sampling rates were calculated using the equation mentioned in Section 5.
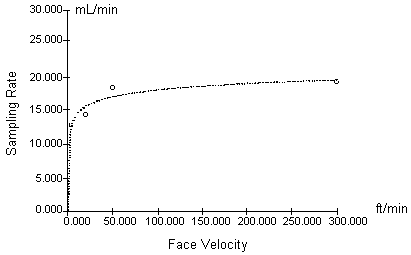
Results: Table 7 and Figure 3 summarize the response of the SKC mercury monitors to various levels of air movement. The results indicate the sampling rate does not significantly change above 15.2 m/min (50 ft/min). A problem were discovered after the aluminum chamber experiment was performed. The manufacturer-quoted face velocity for various fan speeds was also dependent on placement of the monitors in the chamber. Placement geometry was not controlled during the experiment and actual velocities on the badge faces could have been lower than theoretical. This may explain the low sampling rate (0.01512 L/min) found at a theoretical velocity of 15.2 m/min. Using a hot wire anemometer after the experiments indicated the velocity during this experiment could have been as low as 7.6 m/min (25 ft/min). The sampling rate determined for this test was not used in Figure 3. Also, the actual velocity for the test conducted at 91.4 m/min could have been as low as 67 m/min (220 ft/min). Tests were not performed above this velocity due to design limitations of the chambers. Manufacturer statements indicate the dosimeter sampling rate is unaffected by face velocities from 7.6 to 228 m/min (25 to 750 ft/min) (13.7.).
10. Sampling Times
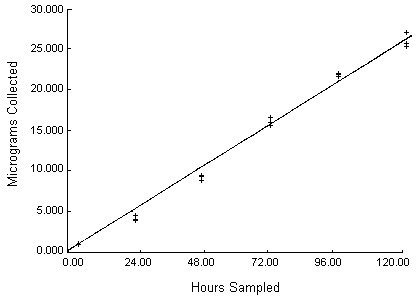
Procedure: The ability of the dosimeter to sample mercury for extended periods was examined.
Twenty-one dosimeter samples were exposed to the same test concentration of 0.213 mg/m3 using varied exposure times. The length of dosimeter exposure to mercury vapor ranged from 4 to 120 h.
Results: The length of sampling time at a fixed concentration was examined by plotting weight collected as a function of sampling time. This data, reported in Table 8 and illustrated in Figure 4, demonstrates linearity to at least 30 µg.
11. Comparison of Methods
Procedure: To compare the dosimeter results with a reference method, hopcalite solid sorbent was used. As mentioned in Section 2, dosimeters and hopcalite sorbent were simultaneously exposed during all tests. Three concentration levels were used. A methods comparison at a high concentration level (about 0.6 mg/m3) was performed as an additional test to examine sample collection capacity.
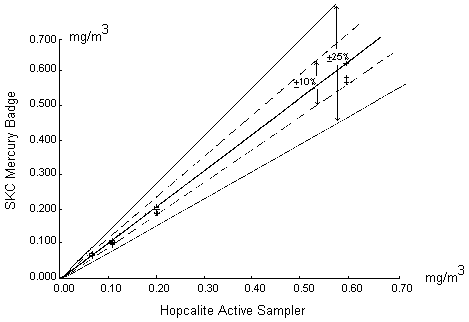
Results: The two methods agree well with each other. Figure 5 shows a graphical comparison of the SKC mercury dosimeter and hopcalite results over the four concentrations tested. The solid line in the center portrays ideal agreement between the two methods (slope equal to 1). The solid and broken lines on either side of the center line are ±25% and ±10% confidence intervals, respectively. As can be seen, 95% of the measured values by these two methods lie within ±10% of the ideal response.
12. Summary and Conclusions
A small, lightweight, and reusable passive monitor was tested for the ability to accurately measure mercury vapor under various environmental conditions. The experiments described have led to the following observations concerning the performance of the SKC passive dosimeter badge for monitoring mercury vapor.
- 12.1. The SKC dosimeters showed excellent precision. The
coefficient of variation of sample sets analyzed throughout the study
was consistently less than 10%.
12.2. Storage stability was sufficient to compensate for typical delays in analysis seen in analytical lab settings. Reverse diffusion was not noted. Sampling efficiency was adequate for long-term sampling; however, a slight decrease in results was noted.
12.3. The monitor was affected by face velocities below 15.2 m/min (50 linear ft/min). At 6.1 linear m/min (20 linear ft/min), the dosimeter sampling rate was 22% lower than the experimentally determined rate at 15.2 m/min face velocity (Table 7). At 1.04 m/min, it was 30% lower.
12.4. Using either the Hydrar® dosimeter or hopcalite sampling tubes for determining mercury vapor should yield similar results in the concentration range tested.
In conclusion, the SKC dosimeter is a lightweight, reusable personal mercury monitor designed to be carried on the clothing of individuals, and can be analyzed in the lab by a simple analytical technique.
13. References
- 13.1. U.S. Environmental Protection
Agency: Determination of Elemental and Total Mercury Collected
from Ambient Air on Silver Wool. Research Triangle Park, NC: U.S.
Environmental Protection Agency, 1981.
13.2. Brain, D.L.: Personal Monitoring of Mercury Vapor Exposures. ICES, Vol. 2, IEEE Catalogue #75-CH 1004-1 (1976).
13.3. Trujillo, P.E. and E.E. Campbell: Development of a Multistage Air Sampler for Mercury. Anal. Chem. 47: 1629-1634 (1975).
13.4. Rathje, A.0. and D.B. Marcero: Improved Hopcalite Procedure for the Determination of Mercury Vapor in Air by Flameless Atomic Absorption. Am. Ind. Hyg. Assoc. J. 37: 311-314 (1976).
13.5. Moffitt, A.E., Jr. and R.E. Kupel: A Rapid Method Employing Impregnated Charcoal and Atomic Absorption Spectroscopy for the Determination of Mercury. Am. Ind. Hyg. Assoc. J. 32: 614 (1971).
13.6. 3M Co., Occupational Health and Safety Products Division: 3M Mercury Vapor Monitors. Saint Paul, MN: 3M Co., no publication date given.
13.7. SKC Inc.: Gas Monitoring Dosimeter Badge for Mercury (Operating Instructions). Eighty Four, PA: SKC Inc., no publication date given.
13.8. Cee, R., J. Ku, E. Zimowski, S. Edwards, and J. Septon: "An Evaluation of Mercury Vapor Sampling Devices." Paper presented and published in Proceedings of the Mercury in Mining Conference, USDOL/MSHA, Nevada State Division of Mine Inspection, and the Nevada Mining Association, Winnemucca, NV, August 1987.
13.9. Occupational Safety and Health Administration: Industrial Hygiene Field Operations Manual (IHFOM) (OSHA Instruction CPL 2-2.20, 4/2/79, II-70). Office of Field Coordination, U.S. Dept. of Labor, OSHA.
13.10. McCammon, C.S., Jr. and J.W. Woodfin: An Evaluation of a Passive Monitor for Mercury Vapor. Am. Ind. Hyg. Assoc. J. 38: 378-386 (1977).
13.11. Occupational Safety and Health Administration Technical Center: Mercury Vapor in Workplace Atmospheres (OSHA-SLTC Method No. ID-140). Salt Lake City, UT. Revised 1989.
13.12. Occupational Safety and Health Administration Analytical Laboratory: OSHA Mercury Cold Vapor Procedure. Salt Lake City, UT. no date given (unpublished).
13.13. Nelson, G.O.: Controlled Test Atmospheres, Principles and Techniques. Ann Arbor, MI: Ann Arbor Science Publishers, Inc., 1971.
13.14. Occupational Safety and Health Administration Analytical Laboratory: Evaluation of 3M Formaldehyde Monitor. Salt Lake City, UT. 1982 (unpublished).
13.15. National Institute for Occupational Safety and Health: Tentative Laboratory Performance Specifications, Testing Protocol, and Evaluation Criteria for Passive Samplers. Cincinnati, OH: National Institute for Occupational Safety and Health, 1982.
13.16. National Institute for Occupational Safety and Health: Documentation of the NIOSH Validation Tests by D. Taylor, R. Kupel, and J. Bryant (DHEW/NIOSH Pub. No. 77-185). Cincinnati, OH: National Institute for Occupational Safety and Health, 1977.
Independent Methods
|
| |||
| Set# | Method | Hg Concn mg/m3 | N (Samples) |
|
| |||
| I | JA HC TC |
0.064 0.066 0.061 |
* 13 |
| II | JA HC TC |
0.106 0.108 0.105 |
* 14 |
| III | JA HC TC |
0.202 0.203 0.203 |
* 10 |
| IV | JA HC TC |
0.597 0.605 0.573 |
* 4 |
|
| |||
| JA | = | Jerome Model 401 gold film mercury vapor analyzer | ||||||||||||||||||||
| * These samples were taken periodically during each generation | ||||||||||||||||||||||
| HC | = | Hopcalite sorbent | ||||||||||||||||||||
| TC | = | Theoretical concentration. The calculation is based
on the following equation:
| ||||||||||||||||||||
| ||||||||||||||||||||||
| Appendix B contains a more detailed explanation regarding theoretical calculations. | ||||||||||||||||||||||
|
| |||||||||
| Level* | 0.5 × PEL |
1 × PEL |
2 × PEL | ||||||
| µg Taken |
µg Found |
DE |
µg Taken |
µg Found |
DE |
µg Taken |
µg Found |
DE | |
|
| |||||||||
| 0.50 | 0.48 | 0.96 | 1.00 | 0.96 | 0.96 | 2.00 | 1.98 | 0.99 | |
| 0.50 | 0.48 | 0.96 | 1.00 | 1.02 | 1.02 | 2.00 | 2.14 | 1.07 | |
| 0.50 | 0.48 | 0.96 | 1.00 | 1.04 | 1.04 | 2.00 | 2.05 | 1.03 | |
| 0.50 | 0.49 | 0.98 | 1.00 | 1.01 | 1.01 | 2.00 | 2.01 | 1.01 | |
| 0.50 | 0.51 | 1.02 | 1.00 | 1.02 | 1.02 | 2.00 | 2.01 | 1.01 | |
| 0.50 | 0.49 | 0.98 | 1.00 | 1.00 | 1.00 | 2.00 | 1.97 | 0.99 | |
| N Average DE Std Dev CV1 |
6 0.98 0.023 0.024 |
6 1.01 0.027 0.027 |
6 1.02 0.030 0.03 | ||||||
| CV1(pooled) 0.027 | DE = Desorption Efficiency | ||||||||
| * Transitional PEL of 0.100 mg/m3 | |||||||||
|
| |||||||||
80% RH, 25°C and 15.2 m/min (50 ft/min)
|
| |||||||||||
| Hg Concn** | Mass | Sampling Time | Sampling Rate | ||||||||
| (mg/m3) | (µg) | (min) | (L/min) | ||||||||
|
| |||||||||||
| 0.066 | 0.66 | 490 | 0.02041 | ||||||||
| 0.066 | 0.89 | 780 | 0.01729 | ||||||||
| 0.066 | 1.15 | 1,000 | 0.01742 | ||||||||
| 0.066 | 1.67 | 1,415 | 0.01788 | ||||||||
| 0.108 | 0.98 | 480 | 0.01890 | ||||||||
| 0.203 | 0.93 | 240 | 0.01905 | ||||||||
|
6 0.01849 0.00119 0.065 | ||||||||||
|
| |||||||||||
| ** Determined from the hopcalite sampler results | |||||||||||
SKC Mercury Dosimeter
80% RH, 25°C and 15.2 m/min (50 ft/min)
|
| |||||||||||||||||||||||||
| (OSHA-PEL*) mg/m3 Taken |
mg/m3 Found |
F/T |
N |
Mean |
Std Dev |
CV2 |
OE | ||||||||||||||||||
|
| |||||||||||||||||||||||||
| (0.5 × PEL) | |||||||||||||||||||||||||
| 0.061 0.061 0.061 0.061 0.061 0.061 |
0.071 0.067 0.067 0.067 0.066 0.065 |
1.164 1.098 1.098 1.098 1.082 1.066 |
|||||||||||||||||||||||
| 6 | 1.101 | 0.033 | 0.030 | 16.2 | |||||||||||||||||||||
| (1 × PEL) | |||||||||||||||||||||||||
| 0.105 0.105 0.105 0.105 0.105 0.105 |
0.108 0.104 0.096 0.099 0.102 0.103 |
1.029 0.990 0.914 0.943 0.971 0.981 |
|||||||||||||||||||||||
| 6 | 0.971 | 0.039 | 0.041 | 11.0 | |||||||||||||||||||||
| (2 × PEL) | |||||||||||||||||||||||||
| 0.203 0.203 0.203 0.203 0.203 0.203 |
0.200 0.202 0.185 0.183 0.194 0.196 |
0.985 0.995 0.911 0.901 0.956 0.966 |
|||||||||||||||||||||||
| 6 | 0.952 | 0.038 | 0.040 | 12.8 | |||||||||||||||||||||
|
| |||||||||||||||||||||||||
| *Transitional PEL of 0.100 mg/m3 | |||||||||||||||||||||||||
| |||||||||||||||||||||||||
SKC Mercury Dosimeter
80% RH, 25°C, and Known Concentration = 0.108 mg/m3
|
| ||||
| Sample Age (days) |
No. of Dosimeters (N) |
Mean (mg/m3) |
Std
Dev (mg/m3) |
CV |
|
| ||||
| 1 5 14 30 |
6 6 6 6 |
0.102 0.111 0.100 0.111 |
0.0041 0.0034 0.0067 0.0048 |
0.041 0.030 0.067 0.044 |
|
| ||||
SKC Mercury Dosimeters
|
| ||||||
| Set (#) |
Hg Found (µg) |
Hg
Concn (mg/m3) |
Statistical Analysis | |||
|
| ||||||
| 1 |
0.96 0.97 0.89 0.88 0.93 0.94 |
0.200 0.200 0.185 0.183 0.194 0.196 |
N Mean (mg/m3) Std Dev (mg/m3) CV |
= = = = |
6 0.193 0.0078 0.04 | |
| 2 |
0.86 0.82 0.93 0.95 0.91 0.96 |
0.179 0.171 0.194 0.198 0.190 0.200 |
N Mean (mg/m3) Std Dev (mg/m3) CV |
= = = = |
6 0.189 0.011 0.06 | |
|
| ||||||
| Set 1 = Six samples exposed to
0.2 mg/m3 mercury for 4 h Set 2 = Six samples exposed to 0.2 mg/m3 mercury for 4 h and then exposed an additional 4 h to purified air containing no mercury. | ||||||
80% RH, 25°C, and a Concentration Range of 0.1 to 0.6 mg/m3
|
| |||||||||||||
| Flow Rate (L/min) |
Exposure Chamber Used |
Face Velocity m/min (ft/min) |
Samples (N) |
Sampling Rate (L/min) | |||||||||
|
| |||||||||||||
| 8.6 | A | 1.04 | (3.4) | 4 | 0.01294 | ||||||||
| 12 | B | 6.1 | (20.0) | 6 | 0.01445 | ||||||||
| 30 | B | 15.2 | (50.0) | 6 | 0.01849 | ||||||||
| 10 | C | 15.2* | (50.0) | 3 | 0.01512 | ||||||||
| 10 | C | 91.4* | (300.0) | 3 | 0.01915 | ||||||||
|
| |||||||||||||
| |||||||||||||
| |||||||||||||
80% RH, 25°C and Known Concentration = 0.213 ± 0.011 mg/m3
|
| |||
| Sampling Time (h) |
Mercury Weight Collected (µg) |
Statistical Analysis | |
|
| |||
| 4.0 | 0.96 0.97 0.89 0.88 0.93 0.94 |
N Mean (µg) Std Dev (µg) CV |
6 0.93 0.03 0.039 |
| 24.0 | 4.56 4.99 4.65 |
N Mean (µg) Std Dev (µg) CV |
3 4.73 0.23 0.048 |
| 48.0 | 9.40 8.95 9.49 |
N Mean (µg) Std Dev (µg) CV |
3 9.28 0.29 0.031 |
| 72.0 | 16.23 15.93 16.87 |
N Mean (µg) Std Dev (µg) CV |
3 16.34 0.48 0.029 |
| 96.0 | 21.95 22.17 22.28 |
N Mean (µg) Std Dev (µg) CV |
3 22.13 0.17 0.0076 |
| 120.0 | 26.12 25.83 27.57 |
N Mean (µg) Std Dev (µg) CV |
3 26.51 0.93 0.035 |
|
| |||
The following steps were performed when active and passive samples were taken for each experiment:
- Adjust the flow rate of the dilution air and the flow rate of the mercury-saturated air to achieve a specified calculated Hg concentration.
- Remove the complete dosimeter from the package. Keep the packaging material and pouch from potentially contaminated areas of mercury before sampling.
- Record the sample number and the starting exposure time on the back of the monitor.
- To start sampling, pry off the sealing cap.
- * Attach the dosimeters onto a long piece of stiff Teflon tubing.
- * Open the cap of the chamber and put the tubing into the chamber.
- Close the chamber and assure a tight seal.
- Attach the hopcalite samplers to the sampling manifold and to sampling pumps. Simultaneously expose hopcalite and Hydrar® sampling media.
- Sample with hopcalite for 1 to 2 h at a flow rate of 0.2 L/min.
- At the conclusion of the sampling period, immediately remove the dosimeter from the chamber and tubes from the manifold. Cap the tubes with plastic end caps.
- As soon as possible after sampling, place the dosimeters in a clean area and remove the sorbent capsule by unscrewing the back cover. Remove the I.D. label and place on the pouch. Seal the capsule in the pouch by folding the top over twice and pressing flat.
- Record the end of sampling time. Calculate the total exposure time.
| * | Steps 5 and 6 were used for the glass chamber exposures. When using aluminum chamber, dosimeters were fastened onto the built-in supports. |
Theoretical Concentration Calculations for Generating Mercury Concentrations
(Note: Equations and Tables listed below were adapted from reference 13.13.)
Mercury concentrations in ppm (by volume) of the saturated stream of air can be calculated from:
| Cppm | = |
|
|||
| = |
|
(1) | |||
| Where: | |||||
| Cppm | = | concentration by volume (ppm) | |||
| PHg | = | vapor pressure of mercury (torr) | |||
| PA | = | atmospheric pressure (torr) | |||
| W/V | = | weight of mercury per unit volume of air (g/liter) | |||
| Tm | = | measured temperature of air saturated with mercury | |||
| Ps | = | standard pressure = 760 torr | |||
| Ts | = | standard temperature = 273 K | |||
| MHg | = | molecular weight of mercury = 200.6 g/mole | |||
Substituting in the known values and solving for the concentration in mg/m3, the above equation reduces to: Cmg/m3 =
PHg × 200.6 g/mole × 106
PA × 22.4 liter/mole × (Tm/273 K × 760 mm/PA)=
PHg × 3.22 × 10⁶
Tm(2)
Some calculated values for PHg are shown:
(18 to 28°C)
| Temperature (°C) |
Vapor Pressure of
mercury (torr) |
Concentration of saturated air stream (mg/m3) |
|
| ||
| 18 20 24 26 28 |
0.001009 0.001201 0.001691 0.002000 0.002359 |
11.2 13.2 18.3 21.5 25.2 |
When air is used to dilute the saturated mercury vapor, Equation 2 becomes:
| C mg/m3 = | qHg × PHg × 3.22 × 10⁶
(qHg + qair) × Tm |
| Where: | ||||
| qHg | = | flow rate of the mercury-saturated air (liters/min) | ||
| qair | = | flow rate of the dilution air (liters/min) | ||
Some calculations using Equation 3 are shown:
| Flow Rate qair (L/min) |
Flow Rate qHg (L/min) |
mg/m3 Concentration of mercury
vapor [Temperature (°C)] | |||||
|
| |||||||
| 18 | 20 | 22 | 24 | 26 | 28 | ||
|
| |||||||
| 18.0 18.0 14.0 9.95 9.9 9.8 9.7 9.6 8.0 12.0 6.0 6.0 None |
0.018 0.036 0.050 0.050 0.10 0.20 0.30 0.40 0.50 0.90 0.60 0.67 All |
0.011 0.022 0.040 0.056 0.11 0.22 0.34 0.45 0.68 0.78 1.02 1.12 11.2 |
0.013 0.026 0.047 0.066 0.13 0.26 0.40 0.53 0.78 0.92 1.20 1.32 13.3 |
0.016 0.031 0.056 0.078 0.16 0.31 0.47 0.62 0.92 1.09 1.42 1.56 15.7 |
0.018 0.037 0.065 0.091 0.18 0.37 0.55 0.73 1.08 1.28 1.66 1.83 18.4 |
0.021 0.043 0.077 0.11 0.22 0.43 0.65 0.86 1.26 1.50 1.95 2.15 21.5 |
0.025 0.050 0.090 0.13 0.25 0.50 0.76 1.01 1.48 1.76 2.29 2.52 25.3 |
Production of Mercury
Atmospheres
SKC Mercury Badge
SKC Mercury Badge Vs. Hopcalite Active Sampler
