| Method Number: | ID-213 | |||
| Matrix: | Air | |||
| OSHA Permissible Exposure Limits | ||||
| * Final Rule Limits | ||||
| Insoluble Tungsten (Insol. W): | 5. mg/m3 Time Weighted
Average (TWA) 10. mg/m3 | |||
| Soluble Tungsten (Sol. W): | 1. mg/m3 TWA 3. mg/m3 STEL | |||
| Cobalt (Co): | 0.05 mg/m3 TWA | |||
| Transitional Limits | ||||
| Insol. and Sol. W: | Not Applicable (NA) | |||
| Co: | 0.1 mg/m3 TWA | |||
| Collection Device: | An air sample is collected on a | |||
| Recommended Sampling Rate TWA and STEL: |
2. liters per minute (L/min) | |||
| Recommended Air Volumes | ||||
| TWA (W and Co): | 480. L | |||
| STEL (W): | 30. L | |||
| Analytical Procedure: | The MCE filter is subjected to a sequence of digestion steps using ammonium hydroxide (aqueous ammonia), water, hydrochloric acid, nitric acid, and phosphoric acid. The resulting solution is analyzed by aspiration into the argon stream of an inductively coupled plasma atomic emission spectrometer (ICP-AES). | |||
| Detection Limit (mg/m3) | ||||
| Qualitative: TWA (W and Co) STEL (W) Quantitative: TWA (W and Co) STEL (W) |
| |||
| * Precision and Accuracy
(TWA): Validation Ranges (mg/m3): CV (pooled): Bias: Overall Error (OE): |
| |||
| Precision and Accuracy
(STEL): Validation Level (mg/m3): CV: Bias: Overall Error: |
| |||
| Method Classification: | Validated Method | |||
| Chemist: | Mike C. Rose | |||
| Date: | February, 1994 | |||
OSHA Salt Lake Technical Center
Salt Lake City, Utah
for descriptive use only and do not constitute endorsements by
* Note: The U.S. Court of Appeals, Eleventh Circuit, recently
decided that the Final Rules of the Air Contaminants Standard (29 CFR
1910.1000) be vacated. The Federal Occupational Safety and Health
Administration (OSHA) enforcement would follow the "Transitional Limits"
of Tables
1. Introduction
This method describes the sample collection and analysis of airborne tungsten (W) and cobalt (Co). Most industrial exposures to W also involve exposures to Co (5.1.). Tungsten carbide (WC or W2C) materials used for abrasives and cutting tools are frequently made containing Co metal which adheres to the surface of the hard but brittle tungsten carbide grains and cements them together into a tough composite. Other common components of cemented tungsten carbide materials include intermetallic compounds of W and Co (e.g., Co6W6C) in addition to other metals and their carbides. Because Co often occurs at significant levels in these materials, it is potentially present in airborne dusts along with W when tungsten carbide composites are used in the workplace. The Co component of cemented tungsten carbides has often been attributed as the etiological agent for certain occupational diseases observed in the tungsten carbide industry (5.1., 5.2.). For these reasons, the sampling and analysis of Co was included in this method. Air samples are taken in the breathing zone of workplace personnel. Wipe and bulk samples can also be taken. Analysis is performed for elemental W and Co by Inductively Coupled Plasma Atomic Emission Spectrometry (ICP-AES).
During abrasive cutting or grinding, the matrix being cut or ground can aerosolize in addition to the grinding agent itself. The method is also suitable for screening other elements such as Al, As, Be, Ca, Cd, Cr, Cu, Fe, Mg, Mn, Mo, Ni, Pb, Sb, Se, Si, Sn, Te, Ti, V, Zn, and Zr.
- 1.1. History
Prior to this method, several analytical approaches of W particulates were used.
- 1.1.1. Atomic Absorption Spectroscopy (AAS)
Tungsten samples were digested by NIOSH Method P&CAM 271
(5.3.) and analyzed by AAS. The high AAS detection limit (DL) for W
limited its utility and the acid extraction of interferences such as
Fe and Co introduced sources of sample loss. The use of hydrofluoric
acid (HF) required the use of expensive Teflon labware and presented
a potential hazard to the analyst. Because of these limitations,
samples submitted for the analysis of W were often screened using
qualitative
1.1.2. Direct Current Plasma Atomic Emission Spectroscopy (DCP-AES)
When
1.1.3.
Although an initial recovery study looked promising, attempts to
validate an XRF technique using samples of various sieved
1.1.4. Inductively Coupled Plasma Atomic Emission Spectroscopy
The next methodology investigated was
Attempts to validate an
In pursuing digestion techniques, a procedure for the determination of Fe in bulk samples of tungsten carbide matrices was found (5.6.) which offered the potential of digesting tungsten carbide under relatively mild digestion conditions to produce a final solution consisting of a 6% phosphoric acid (H3PO4) matrix. Additional reagents and steps were needed, and the digestion procedure was adjusted until six diverse W matrices were completely digested. A final matrix of 2% H3PO4 in water was selected as being adequate for samples.
1.2. Principle
Samples are collected in the workplace using classical monitoring equipment and techniques. Sampling is further detailed in Section 2.
The wide variety of W matrices found in industry requires use of a sequence of digestion steps in sample preparation. The chemical principles involved in the digestion are detailed at the appropriate steps in the procedure in Section 3.5.
Digested samples are analyzed by aspiration into an inductively
coupled argon plasma. This technique uses a
The instrument currently in use at the
- (1) Analytical channels are selected which minimize
interferences so that normally only large amounts of interfering
elements must be present before significant interference is
observed.
(2) Additional analytical channels that monitor for the presence of interfering elements are included in the analysis so that interelement corrections (IECs) can be readily made.
See Table 16 in Section 4.3. for a listing of the channels, wavelength, orders, and interferences used in this method.
1.3. Advantages and Disadvantages
- 1.3.1. This method has adequate sensitivity, accuracy, and
precision for determining compliance with the OSHA
1.3.2. Digestion conditions are surprisingly mild and the final solution matrix is dilute 2% H3PO4 reducing potential matrix effects.
1.3.3. The use of HF is avoided. This acid was commonly used in the past for W matrix digestions and required Teflon® ware. Therefore, this method should be compatible with common silica glass ICP torch and nebulizer assemblies, and should be significantly safer for the analyst.
1.3.4. This method screens for many other elements that could be present in the workplace.
1.3.5. Pending further validation, Fe and Ni may also be analyzed
by this method. This digestion matrix should be suitable for the
analysis of these elements by either
1.3.6. A disadvantage is the need to separately determine both soluble and insoluble W when both are known to be present in the workplace. See Table 7 in Section 1.6. for solubility designations for various common materials used in industrial applications.
1.3.7. Another disadvantage is the long digestion time required.
1.4. Method Performance
An Applied Research Lab (ARL) Model 3560 Atomic Emission
Spectrometer with accompanying software (ARL, Sunland, CA) was used to
determine method performance. Uncorrected results from the computer of
the ARL Model 3560 were captured via a VAX 850 and networked to a
personal computer (PC). Custom
- a) Speed the workup of data
b) Provide the ability to assess different interelement correction algorithms without need to reanalyze the samples
c) Avoid a "bug" found in the manufacturer's software (5.7.)
d) Present the results in a form amenable to reporting samples
A synopsis of method performance is presented below. Further information can be found in Section 4.
- 1.4.1. This method was validated for spiked MCE filter samples
corresponding to air concentrations of 0.025 to 1.41
mg/m3 Co and 0.50 to 10.3
mg/m3 W. See Sections 4.5. to 4.8. for
details.
1.4.2. The qualitative detection limits (2 × SD) are shown in Table 1:
| Co | W | Assumptions |
| 0.0032 µg/mL | 0.041 µg/mL | |
| 0.16 µg | 2.1 µg | 50 mL soln. vol. |
| 0.0003 mg/m3 | 0.0043 mg/m3 | 480 L air vol. |
| 0.0053 mg/m3 | 0.069 mg/m3 | 30 L air vol. |
See Table 16 in Section 4.3. for qualitative detection limits of the screening elements.
1.4.3. The quantitative detection limits (10 × SD) are shown in Table 2 below:
| Co | W | Assumptions |
| 0.016 µg/mL | 0.21 µg/mL | |
| 0.80 µg | 10.3 µg | 50 mL soln. vol. |
| 0.0017 mg/m3 | 0.022 mg/m3 | 480 L air vol. |
| 0.027 mg/m3 | 0.34 mg/m3 | 30 L air vol. |
1.4.4. The sensitivity of the analytical method [(KPulse units per 1 µg/mL), KPulse is an integration unit used by a specific manufacturer of ICP instruments] was determined for W and Co while using the instrumental parameters listed in Table 10 (Section 4.) and Table 16 (Section 4.3.). The calibration is applicable over the analytical range shown. Above the analytical range, detector saturation can occur. The sensitivity is the slope of the calibration curve using the calibration range listed in Table 3:
| Element | Sensitivity | Calibration Range | Analytical Range |
| Co | 3.8 | 0 to 10 µg/mL | 0 to 200 µg/mL |
| W | 1.0 | 0 to 100 µg/mL | 0 to 1,000 µg/mL |
1.4.5. The total pooled coefficients of variation (CVT), biases, and OE for sample masses expected at about 0.5, 1, and 2 times the OSHA TWA PEL (Sections 4.5.-4.7.) are listed in Table 4 below:
| TWA | |||
| Element | CVT | Bias | OE (%) |
| Co | 0.027 | + 0.046 | ± 10.0 |
| W (Insol.) | 0.045 | + 0.012 | ± 10.2 |
| W (Sol.) | 0.0097 | + 0.073 | ± 9.2 |
The OE (5.8.) was calculated using the equation:
OEi = ±(|biasi| + 2CVi) × 100% (95% confidence level)
Where i is the respective sample pool being examined. Air volumes of 480 L/min were used in calculating masses.
The results shown in Table 5 below were obtained using amounts approximating the Final Rule STEL concentrations (Section 4.5.-4.6.):
| STEL | |||
| Element | CVT | Bias | OE (%) |
| W (Insol.) | 0.020 | + 0.047 | ± 8.7 |
| W (Sol.) | 0.0070 | + 0.062 | ± 7.6 |
An air volume of 30 L was used to calculate masses found near STEL determinations.
When sampling cemented tungsten carbides, Co is potentially present in amounts that greatly exceed the Co PEL when W is near its PEL. For this reason, additional Co analyses were performed in the evaluation of this method to ensure that quantitation of Co can be performed at the higher levels. The total pooled coefficients of variation (CVT) and biases for samples analyzed for Co from 3.2 to 28 times the OSHA Final Rule PEL (Section 4.8.) are listed in Table 6:
| High Concentration Co | |||
| Element | CVT | Bias | OE (%) |
| Co | 0.018 | + 0.028 | ± 6.5 |
Bias and overall error (OE) values were calculated from those found analytically versus theoretical (known or certified) values.
1.4.6. Sample stability: No stability problems are expected in the case of matrices involving insoluble forms of W and Co. Some very soluble compounds of W, particularly sodium tungstate, may absorb enough water from the air to dissolve and penetrate into the backup pad. A procedure to stabilize such samples is presented in Section 2.2.6.
1.5. Interferences
- 1.5.1. There are no known chemical interferences.
1.5.2. Spectral interferences depend on the selection of wavelengths of the element channels (listed in Table 16 in Section 4.3.). In the case of this analytical method, W and Co spectrally interfered slightly with one another when using the wavelengths recommended by the instrument manufacturer. In addition, Ti [present in some tungsten carbide matrices as titanium carbides (5.1.)] interfered slightly with both W and Co. Additional elements of interest to industrial hygienists which might be present in tungsten carbide grinding operations (and elements interfering with the analysis of W and Co) were included for use in performing interelement corrections and screening. Also see Section 4.3. for more details regarding spectral interferences.
1.5.3. This method includes the analysis of Co, W, and the 22 screening elements listed in Section 1. The industrial hygienist should note the identity of additional elements suspected to be present in the workplace atmosphere so the analyst can evaluate the potential for possible interference.
1.6. Sources of Potential Exposure to W (CAS
| Material | Application |
| Tungsten (Insol. W) |
Welding electrodes, alloys, high speed tool steels, filaments in incandescent lamps, heating elements, rocket nozzles, and solar energy devices |
| Tungsten carbide (Insol. W) |
Abrasive, cemented carbide tools,
dies, and |
| Tungsten disulfide (Insol. W) |
Solid lubricant |
| Tungsten carbonyl (Insol. W) |
Deposition of tungsten coatings |
| Tungsten chlorides and
fluorides (includes both Insol. W and Sol. W) | |
| Tungstic acid and tungsten oxide (Insol. W) |
Textiles, ceramics, and plastics |
| Sodium tungstate (Sol. W) |
Biological assays, fire proofing and waterproofing fabrics |
| Cobalt | Component in cemented tungsten carbide composites and alloys |
1.7. Physical and Chemical Properties of W and Co (5.2.):
Table 8 displays properties of the elemental forms of W and Co. Compounds and alloys containing these elements are also regulated under the OSHA PELs.
| Property | W | Co |
| Atomic weight | 183.85 | 58.9332 |
| Specific gravity | 19.3 | 8.92 |
| Melting point (°C) | 3410 | 1493 |
| Boiling point (°C) | 5927 | 3200 |
| Vapor pressure (torr) | non-volatile at room temp. | |
| Aqueous solubility | insoluble | |
1.8. Toxicology (5.2., 5.10.)
Note: Information listed within this section is a synopsis of current knowledge of the physiological effects of W and Co and is not intended to be used as a basis for OSHA policy.
- 1.8.1. When ingested or given intravenously to guinea pigs, the
chief effects of W (insoluble) and
Na2WO4.2H2O
(soluble) are anorexia, colic, weight loss, incoordination of
movement, trembling, and dyspnea (5.2).
1.8.2. The toxic effects of W are greater for the more soluble
forms. In terms of W content, the compounds
Na2WO4,
WO
1.8.3. Reports of occupational effects from exposures to soluble W compounds are not found in the literature (5.1., 5.2.).
1.8.4. Toxic response to Co often involves hypersensitivity. Pulmonary involvement in humans has been observed to lead to chronic interstitial pneumonitis. Effects on the lungs are often reversible. However, acute exposures to levels below 1 to 2 mg/m3 have been fatal. Allergic dermatitis has also been observed in humans (5.2.).
1.8.5. In the mineral assay and hard metal industries, human
exposures to Co have been associated with
1.8.6. Cardiomyopathy and elevated Co levels in human heart
tissue has also been found in
1.8.7. In guinea pigs, obliterative bronchiolitis adenomatosis is observed when high doses of cobalt are injected intratracheally. Animal studies appear to confirm hypersensitivity but do not necessarily model human lung responses (5.2.).
2. Sampling
- 2.1. Equipment
- 2.1.1.
Note: Polyvinyl chloride (PVC) filters are applicable for
analysis if only soluble forms of W or Co are suspected. See Table 7
in Section 1.6. for solubility designations of materials in various
common industrial applications. See reference 5.1. for any materials
not listed in Section 1.6. Insoluble forms of W or Co collected on
PVC cannot be analyzed by this method, but may be analyzed
gravimetrically in the field and may also be submitted for
"Qualitative XRF" analysis (OSHA Method no.
2.1.2. Gel bands (Omega Specialty Instrument Co., Chelmsford, MA) for sealing cassettes.
2.1.3. Calibrated personal sampling pumps capable of sampling within "5% of the recommended flow rate of 2 L/min.
2.1.4. Various lengths of polyvinyl chloride tubing to connect sampling cassettes to pumps.
2.1.5. A stopwatch and bubble tube or meter to calibrate pumps.
2.1.6. Smeartabs (part no.
2.1.7. Scintillation vials, 20 mL, (part no. 74515 or 58515,
Kimble, Div. of
2.2. Sampling Procedure - Air Samples (5.1.)
Collect samples on 0.8-µm pore size,
Note: Some welding operations involve W. If a welding operation is
being sampled for W, conduct the welding fume sampling with the MCE
filter cassette located inside the welding helmet. If the
- 2.2.1. Place a MCE filter and a cellulose backup pad in each
2.2.2. Prepare at least one blank for each batch of ten samples. Use the same lot of MCE filters for blank and collected samples. Handle the blank filters in the same manner as the samples except that no air is drawn through blanks.
2.2.3. Calibrate each personal sampling pump with a prepared
cassette
2.2.4. Attach prepared cassettes to calibrated sampling pumps
(the backup pad should face the pump) and place in appropriate
positions on the employee or in the workplace area. For STEL
samples, use a flow rate of 2 L/min and a minimum sampling time of
15 min. For TWA determinations, take two consecutive
Note: If other regulated soluble compounds (e.g.,
Cr2+, Cr3+,
soluble salts of Al, Fe, Mo, Ni, ZnCl2,
etc.) are suspected to be present in the sampled air, take separate
samples. Request analysis for the specific regulated compound(s).
These samples are analyzed using OSHA Method No.
2.2.5. If the filter becomes overloaded while sampling, another filter cassette should be prepared. Consecutive samples using shorter sampling periods should be taken if overloading occurs. After sampling, place plastic end caps tightly on both ends of the cassette.
2.2.6. Special instructions for soluble W samples: Prudent precautions should be used to stabilize certain air samples after collection. In humid air, some soluble W compounds are deliquescent, i.e., they can absorb water vapor from humid air and form a solution. Such solution formation on a filter could spread to the backup pad (which is not analyzed) resulting in low recoveries. For soluble W samples:
- 1) Open the cassette.
2) Carefully lift out the MCE filter with forceps. Do not disturb any of the particulate on the filter.
3) Remove and discard the backup pad.
4) Replace the MCE filter in its original orientation.
Apply OSHA 21 seals in such a way as to secure the end caps. Record the sampling conditions. Treat the blank(s) in the same way. For air samples on MCE filters that are suspected of containing only soluble W, request "Soluble W." Otherwise, request "Soluble and Insoluble W" analysis on the OSHA 91A. Ship air and blank samples to the lab. Cobalt results will be reported in addition to the requested W analysis.
2.2.7. Instructions for air samples not containing soluble W: Apply OSHA 21 seals in such a way as to secure the end caps. Record the sampling conditions. Specify "W+Co" analysis and ship air and blank samples to the laboratory. When "W+Co" is requested, soluble W will not be reported.
2.2.8. When other compounds are known or suspected to be present in the air, such information should be transmitted with the sample. This is particularly important for elements not included among the 22 screened elements listed in Section 1. Other more exotic elements may produce spectral interferences in the analysis of W and Co. The industrial hygienist should note the identity of additional elements suspected to be present in the workplace atmosphere so that the analyst can evaluate possible interferences.
2.3. Bulk Samples and Wipe Samples
Very finely divided bulk material can be analyzed by this method.
Settled dust samples are preferred. The laboratory may not be able to
grind coarse samples of many of the hard industrial W matrices to a
fine enough particle size for digestion by this method. As an
alternative for bulk analysis, OSHA Method
Wipe samples taken on smear tabs may be submitted for analysis. Do not collect wipe samples using PVC filters, large Whatman filters, or backup pads.
- 2.3.1. Bulks: Place bulk samples in
2.3.2. Wipes: Prepare at least one blank for every ten wipe samples.
- 1) Wear clean, impervious, disposable gloves when taking each
wipe sample.
2) Moisten the wipe filters with deionized water prior to use.
3) If possible, wipe a surface area covering 100 cm2.
4) Fold the wipe sample with the exposed side in.
5) Transfer the wipe sample into a
2.3.3. Complete the OSHA Form 91A. See Table 7 in Section 1.6. for solubility designations for materials in various common industrial applications. Specify "W+Co", "Soluble W", "Soluble and Insoluble W" and/or "Qualitative XRF" analyses as appropriate and ship the bulk and wipe samples to the laboratory separately from air samples.
3. Analysis
- 3.1. Safety Precautions
- 3.1.1. Refer to appropriate
3.1.2. Observe laboratory safety regulations and practices.
3.1.3. The reagents NH3(aq), HCl, HNO3, and H3PO4 are corrosive. Use appropriate personal protective equipment such as safety glasses, goggles, splash shield, gloves, and lab coat when handling corrosive chemicals. Prepare solutions in an exhaust hood.
3.2. Equipment
- 3.2.1. Inductively coupled plasma atomic emission spectrometer
(ARL Model 3560 or equivalent configured with channels Co, W, and
major interferant elements).
3.2.2. Automatic sampler, if desired.
3.2.3. Laboratory computer system for data reduction, if desired.
3.2.4. Filtering apparatus for extractions: vacuum system or aspirator, assorted hoses, trap, suction flask, filtering stand, filtering funnel, clamp, wash bottle, and container to receive filtrate.
3.2.5. Miscellaneous volumetric ware: Pipettes; micropipettes;
* Note: Concentrated H3PO4 is syrupy and wets glass. To deliver aliquots of H3PO4 quantitatively and reproducibly, use a plastic pipette tip that is not appreciably wetted by H3PO4.
3.2.6. Parafilm®.
3.2.7. Forceps.
3.2.8. Plastic wrap or aluminum foil.
3.2.9. Thermostated hot plate(s) 70 to 100 °C and 180 to 200 °C.
3.3. Reagents
All chemicals should be at least reagent grade. Refer to Material Safety Data Sheets (MSDSs) for safe and proper handling of reagents.
- 3.3.1. Reagents:
Deionized water (DI H2O).
Ammonium
hydroxide (NH3(aq)), concentrated (28.6%
as NH3).
Hydrochloric acid (HCl),
concentrated (36.5 - 38.0%).
Nitric acid
(HNO3), concentrated
(70.9%).
Phosphoric acid
(H3PO4),
concentrated (85.5%).
3.3.2. ICP stock standards:
The stock standards used in the validation are listed in Table 11 in Section 4. All calibration standards are prepared from 1,000 µg/mL ICP stock standards (except for the 10,000 µg/mL Fe standard). Atomic spectral (ICP) standards may be used. Standards normally classified as "atomic absorption" may not be appropriate due to the presence of contaminants. Stock standards prepared in water, dilute nitric acid, and dilute hydrochloric acid matrices are suitable provided that they do not cause precipitation when mixed together to prepare calibration standards.
3.4. Preparation of Standards
Table 9 below summarizes the preparation of standards. All the
calibration standards and the reagent blank use a final 2%
H3PO4 matrix
except for the 1,000 µg/mL solution of Ti. The 1,000
µg/mL Ti stock standard is used neat (without any added
H3PO4) because a
high concentration of Ti in 2%
H3PO4 tends to
produce a precipitate after several hours. Prepare the calibration
standards (except Ti) in
The ICP stock solutions listed in Table 11 in Section 4. were compatible when mixed together at the dilutions used in preparing the standards listed below. If substitutions for these stock solutions are made, different combinations for standards may be necessary in order to avoid possible precipitation reactions, (e.g., do not mix together ICP stock solutions containing SO42- and Pb2+). After adding the aliquots of ICP stock standards, dilute to 100 mL with DI H2O. Mix thoroughly.
Immediately transfer the standard which contains the silicon standard (labelled "4" in Table 9 below) to a plastic bottle. The other standards may be stored in glass volumetric flasks.
| Label | ICP Stock Standards | mL | Final Concentration (µg/mL) |
| Acid | none | NA | 0 (reagent blank) |
| 1 | Be, Cd, Co*, Cu, Pb, Zn | 0.200 | 2.00 each |
| 2 | Cr, Mo, Ni, Sb, V, Fe | 0.200 | 2.00 each and 20.00 for Fe |
| 3 | Ca, Mg, Mn, Al, As, Se, Te | 0.200 | 2.00 each |
| 4 | Sn, Si, Zr | 1.00 | 10.00 each |
| W | W | 10.00 | 100.0 |
| Co | Co* | 1.000 | 10.00 |
| Ti | Ti | NA | 1,000. |
| * | A three point calibration curve is used for Co; two point calibration curves are used for the other elements. |
3.5. Sample Preparation
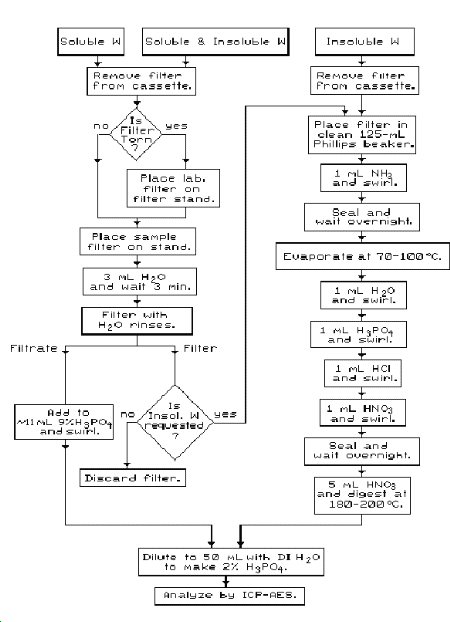
A flow chart is shown in Figure 1 to assist the analyst in preparing samples. Observe laboratory safety rules. Use personal protective equipment necessary to conduct safe acid digestions and a laboratory exhaust hood appropriate for acid use when preparing samples and glassware.
- 3.5.1. Glassware cleaning.
- 1) Clean
2) Rinse the
3.5.2. Soluble W air sample preparation.
Note: It is often possible to determine by the nature of the operation that only soluble W or only insoluble W may be present. (See Table 7 in Section 1.6. for solubility designations of various common tungsten materials in industrial applications.) In such cases where only one solubility designation applies, the separate extraction and analysis of soluble W is not necessary. For example, grinding operations using cemented tungsten carbides normally need not be analyzed for soluble W.
- 1) Carefully remove the filter from the polystyrene cassette
with forceps and place the sample filter, dust side up, on the
moistened platform of a filtering apparatus. Secure the filtering
funnel, and add
Note: If the sample filter is torn, place the filter on the filtering stand on top of a laboratory 0.8-µm pore size MCE filter. (If insoluble W is requested, combine filters. For corresponding blank corrections, combine a field and laboratory blank.)
Allow to stand for 3 minutes. (See Section 3.5.3. step 2 regarding treatment of contaminated backup pads.)
2) Apply vacuum while supplying several mL of DI H2O from a wash bottle to quantitatively transfer the solution to a receiving container.
3) Quantitatively transfer the solution from the receiving
container to a clean
4) If insoluble W is also requested, carefully place each
extracted filter in a clean labelled
Note: Care should be exercised to avoid getting the filter or filter fragments up on the glass beaker where digestion will be inefficient.
5) For the soluble portion, proceed to Section 3.6. below.
6) For the insoluble portion, proceed to Section 3.5.3., steps 2 to 11.
3.5.3. Insoluble W air sample preparation.
Complete sample digestion of certain insoluble W matrices
requires reaction times for steps 3 and 8 listed below that exceed
the analyst's normal
Note: Use extreme caution in handling concentrated HF. Hydrofluoric acid is both corrosive and toxic. It is particularly hazardous because it rapidly penetrates deep below intact skin and causes extensive tissue damage. Check first aid procedures before using. Cleanup spills promptly with appropriate spill cleanup materials.
Observe laboratory safety rules. Use personal protective equipment and an appropriate laboratory exhaust hood when preparing samples.
- 1) Carefully remove the filter from the polystyrene cassette
with forceps.
2) Transfer each sample filter into a clean labelled
Note: Care should be exercised to avoid getting the filter or filter fragments up on the glass beaker where digestion will be inefficient.
Contaminated backup pads may be analyzed in the manner of MCE filters with the additional treatment noted in step 10 below. If analysis of contaminated backup pads is performed, also analyze the backup pad of the blank so that blank corrections may be performed.
3) In an exhaust hood, add 1 mL of concentrated NH3(aq) to each Phillips beaker and quickly seal the tops of the Phillips beakers with Parafilm followed by plastic wrap or aluminum foil. Allow to stand overnight.
Note: The concentrated NH3(aq) weakens MCE filters and dissolves any WO3 to form soluble tungstate. The WO3 matrix is not soluble in the acid digestion steps used in this method. Some Co in samples containing cemented tungsten carbides may also dissolve as a result of air oxidation and complexation of Co by NH3. The minimum practical volume of concentrated NH3(aq) to use in this step is 1 mL. Concentrated NH3(aq) tends to evaporate readily; therefore, to avoid loss of NH3 and speed the process, the plastic wrap and Parafilm should be cut to size before the aqueous NH3(aq) is added. More NH3(aq) (2 mL total) could be used if desired because the excess is removed in step 4. Be consistent in the volume of NH3(aq) used for samples and blanks.
The H3PO4
used in Step 6 dissolves any remaining insoluble
4) After standing overnight, the sealed beakers should still contain liquid. If no liquid is present, the previous step must be repeated (including allowing it to stand overnight) because the ammonia may have evaporated before the reaction was complete.
Note: If Co is present in sufficient amounts, a purple or brown solution may result.
Uncover the beakers and quickly evaporate the remaining liquid
in an exhaust hood on a
5) Add 1 mL DI H2O or distilled H2O (to dissolve soluble tungstates and prevent dehydration to insoluble tungstic acid when the acids are added). Swirl to dissolve soluble components; some Co complexes present may decompose to a brownish mass during the gentle heating in the previous step but will quickly dissolve in subsequent steps when the acids are added.
6) Add 1 mL of H3PO4. Swirl to mix well.
7) Add 1 mL of HCl. Swirl. A blue [CoCl4]2- complex may form.
8) Add 1 mL of HNO3. Swirl. Seal the beakers with Parafilm (or cover with watch glasses) and allow to stand overnight.
Note: The low viscosity of this mixed acid matrix solution is important in dissolving the residual Co out of the tungsten carbide composites. Diffusion is limited in these matrices; the formation of both slightly soluble tungstates and gas bubbles formed during the digestion may clog the passages between the carbide grains. It takes time for the H3PO4 to diffuse between the grains and complex any tungstic acid that forms. Gaseous oxidants present in the solution are less soluble at elevated temperatures. This digestion is hindered if high temperatures are applied too soon; therefore, the samples are allowed to sit overnight for the reaction to take place.
9) Add 5 mL of HNO3 to the samples and digest at 180 to 200 °C until the volume is reduced to approximately 1 mL (mostly H3PO4) and digestion is complete. Cool to room temperature.
Note: To determine completion of digestion (![]() 1 mL left), the
1 mL tends to draw away from the center because Phillips beakers
have slightly raised centers. Completion is also evidenced by the
following events: The
1 mL left), the
1 mL tends to draw away from the center because Phillips beakers
have slightly raised centers. Completion is also evidenced by the
following events: The
10) To digest any backup pads that may be contaminated with sample, add 2 mL DI H2O and swirl to mix well. Add 5 mL HNO3 and repeat step 9 once more.
11) Point the mouth of the flask away from yourself. Slowly and
cautiously add DI H2O to the
H3PO4 solution
and transfer quantitatively to
3.5.4. Bulk sample preparation:
Prepare bulk samples by weighing 3 to 5 mg of each dry bulk
sample on individual tared 0.8-µm pore size,
3.5.5. Wipe sample preparation:
Transfer each Smeartab wipe sample to individual
3.6. Standard and Sample Analysis
Note: If particulate remains after digestion, the sample(s) should
be filtered using a
- 1) Analyze the standards and reagent blank by
2) If necessary, analyze standard and reagent blanks to determine
the detection limits using the appropriate manufacturer's software.
3) Analyze the samples, calibration standards, and blanks by ICP-AES.
4) Follow the SOP for further instructions regarding analysis (5.13.).
5) Some samples require reanalysis. These include the following:
- a) Dilute and reanalyze any samples which have calculated
concentrations above the analytical range. This especially
includes samples which saturate (overdrive) any channels. Evidence
for overdriven channels may vary, and is described further in the
ICP SOP for the particular instrument (5.13.). Pipet an
appropriate aliquot of the high concentration sample into a clean
volumetric flask and dilute to volume with 2%
H3PO4.
b) Reanalyze any samples and corresponding blanks if results indicate a high degree of imprecision . This problem is evidenced by a high relative standard deviation (CV > 10%) of the three exposure measurements/sample.
3.7. Calculations
- 3.7.1. Perform interelement corrections. According to the
equation below, a final concentration for each analyte is
calculated:
| Where: | ||
| Cc | = | corrected concentration of an element |
| Cunc | = | uncorrected concentration of the element |
| Ci | = | concentration from each contributing interference for the element |
| Ki | = | respective Interelement Correction (IEC) factor for the interference |
Application of this equation is an iterative process described in
greater detail in Section 4.3. These corrections are calculated
either "real-time" using software provided by the instrument
manufacturer or
3.7.2. Obtain hard copies of the data and results from a printer.
3.7.3. The amount of analyte in each sample or blank is calculated as:
| µg A | = | (µg/mL A) × (mL S) × (DF) |
| Where: | ||
| µg A | = | Total µg of analyte in the sample or blank |
| µg/mL A | = | Measured concentration of analyte in solution (derived from calibration curve) |
| mL S | = | Total volume of the solution analyzed |
| DF | = | Amount of dilution applied to an aliquot of the original solution (ratio of final volume divided by the aliquot volume) |
3.7.4. The blank value, if any, is subtracted from each sample:
| µgc A | = | (µg A) - (µgb A) |
| Where: | ||
| µgc A | = | µg of analyte, blank corrected |
| µg A | = | µg of analyte from equation in Section 3.7.3. above |
| µgb A | = | µg of analyte in blank |
Wipe samples are reported in terms of µg of analyte.
3.7.5. For air samples, calculate mg/m3 exposures for all screened elements, Co, soluble W, and insoluble W:
| mg/m3 A = | (µgc A) × (GF)
(L) |
| Where: | ||
| GF | = | Gravimetric factor |
| L | = | Air volume in liters |
For those elements having a PEL listed as an oxide, the gravimetric factors are calculated from formula weights (FW):
| GF | = | 1.2447 for FWZnO/FWZn |
| GF | = | 1.4298 for FWFe2O3 /2FWFe |
| GF | = | 1.7852 for FWV2O5/2FWV |
3.7.6. Compare the calculated mg/m3 exposures to the various PELs or OSHA action limits. Evaluate the reliability of the results for all detected elements whose air concentration may exceed a PEL or an action limit. With the custom software available at the OSHA SLTC, the analytical results reported for each sample includes a listing of the total interelement correction and the corrected concentration for each element detected in the sample.
3.7.7. Convert bulk sample analytes to % composition using:
| % A = | (µgc A) × (100%)
(mg B) × (1,000 µg/mg) |
| Where: | ||
| mg B | = | milligrams of bulk sample |
3.8. Reporting Results
- 3.8.1. When evidence of migration of the sample to the backup
pad is observed on any air sample, advise the industrial hygienist
that part of the sample was collected on the backup pad. When this
occurs, report the sum of exposure results for the air filter sample
and the corresponding backup pad.
3.8.2. Report exposures in terms of mg/m3 as appropriate for Co, soluble W, and insoluble W.
3.8.3. Discuss high exposures of screened elements with your supervisor and the industrial hygienist. Resubmit air samples and blanks for additional confirmation and quantitation of any screened elements near or over the PEL, or discuss resampling with the industrial hygienist. Include copies of sampling information and results when resubmitting samples.
4. Backup Data
This analytical method has been validated for the spiked MCE filters
specified in Section 2.1.1. The method validation was performed
according to guidelines (5.14., 5.15.) with the exception of the
sampling validation. The analytical method validation was conducted at
the respective OSHA Final Rule
- a) Aerosol generation of cemented tungsten carbides is very
difficult because of the high density of this matrix. The great
hardness of this material precludes grinding to a smaller particle
size range.
b) The generation of cemented tungsten carbide aerosols of known composition is not feasible because cemented tungsten carbides are non-stoichiometric.
c) The
d) Equipment to generate and measure aerosols was not available at the time of this validation.
Instrument parameters used during validation are listed in Table 10 below. (Additional information regarding this instrument may be found in reference 5.7.):
| The Specifications for the ARL 3560 Simultaneous ICP-AES | |||
| RF GENERATOR: | Snout Gas Flow (L/min) | 1.5 | |
| Generator (Model No. Henry) | 2.5 kW * | Nebulizer Uptake Rate (mL/min) | 2.3 |
| Incident Power (W) | 1,175 | Nebulizer type | Meinhard-Type A |
| Reflected RF Power (W) | 0-20 | Peristaltic Pump Used? (yes/no) | no |
| P.A. Plate Supply Voltage (V) | 4,100 | Pre-Integration Flow Time (s) | 30 |
| P.A. Plate Current (mA) | 700 | Integration Time (s) | 5 |
| P.A. Grid Current (mA) | 125 | Number of Exposures | † |
| P.A. Filament Voltage (V) | 7.5 | SPECTROMETER: | |
| P.A. Tune (Setting) | 190 | Instrument Model | 3560 |
| P.A. Load (Setting) | 050 | Grating (lines/mm) | 1,080 |
| (where P.A. = Power Amplifier) | Primary Slit Size (µm) | 20 | |
| EXCITATION: | Profiling Element | Mn | |
| Plasma Observation Height (mm) | 15 | Profile Point (peak dial div.) | 496 ‡ |
| Coolant Gas Flow (L/min) | 12 | Vacuum (µmHg) | 20 |
| Coolant Gas Pressure (psi) | 25.5 | Path Length (m) | 1 |
| Plasma Gas Flow (L/min) | 0.8 | COMPUTER CONFIGURATION: | |
| Plasma Gas Pressure (psi) | 21.5 | Disk Drive Capacity | 30 Megabyte fixed 1.2 Megabyte 5.25 in. floppy |
| Carrier Gas Flow (L/min) | 1 | Computer System | Micro 11/53 DEC Computer |
| Carrier Gas Pressure (psi) | 30.5 | Software (operating system) | DPS/TSX+ |
* Indicates peak rf power capability in kW.
† Dependent on
software program used; 10 for DL determinations, and 3 for calibrations
and analyses.
‡ From spectral scanning device (SAMI). This value can
change over time.
The instrument calibration standards were those listed in Table 11 below:
| ICP Stock Standards* | Matrix | ICP Stock Standards* | Matrix |
| Al | 0.3 M HCl | Ni | 0.3 M HNO3 |
| As | 0.3 M HCl | Pb | 0.3 M HNO3 |
| Be | 0.3 M HCl | Sb | H2O |
| Ca | 0.3 M HNO3 | Se | 0.3 M HNO3 |
| Cd | 0.3 M HNO3 | Si | H2O |
| Co | 0.3 M HNO3 | Sn | 2.5 M HCl |
| Cr | H2O | Te | 10% HCl |
| Cu | 0.3 M HNO3 | Ti | H2O |
| Fe | 5% HNO3 | V | 0.3 M HNO3 |
| Mg | 0.3 M HNO3 | W | H2O |
| Mn | 0.3 M HNO3 | Zn | 0.3 M HNO3 |
| Mo | H2O | Zr | 2% HNO3 |
| * All calibration standards are prepared from 1,000 µg/mL ICP stock standards (except for the 10,000 µg/mL Fe standard). |
The method validation consisted of the following experimental protocol:
- 1. Preliminary assessments of reference materials.
2. Preliminary determination of W and Co analytical recoveries of
diverse
3. Determination of interelement corrections.
4. Determination of the qualitative and quantitative detection limits and background equivalent concentrations.
5. Determination of analytical method precision and accuracy for insoluble W. Preparation and analysis of spiked MCE filter samples of three samples each of the two most difficult insoluble matrices (94% WC/6% Co and 88% W2C/12% Co) at W exposures at 0.5 ×, 1 ×, and 2 × TWA PEL. Preparation and analysis of six spiked MCE filter samples of pure W metal which represent concentrations of insoluble W near the STEL.
6. Determination of analytical method precision and accuracy for soluble W. Preparation and analysis of spiked MCE filter samples of six samples each of soluble W (Na2WO4.2H2O) representing W exposures at 0.5 ×, 1 ×, and 2 × TWA PEL. Preparation and analysis of six spiked MCE filter samples which represent concentrations of soluble W near the STEL.
7. Determination of analytical method precision and accuracy for
Co. Preparation and analysis of
8. Determination of analytical method precision and accuracy for Co
at higher levels. Analysis of
9. Assessment of typical levels of blank contamination, analyte
10. Summary.
All analytical results were calculated from
- 4.1. Preliminary Assessment of Reference Materials:
In order to develop a method for measuring atmospheric exposures in
the workplace, unsieved reference materials of six diverse common
industrial
Procedure
The cemented tungsten carbide matrices were
Particle sizing for each of the six materials was also assessed based on product information, measurement, and visual inspection.
Results
The powder diffraction patterns corresponding to WC and Co were
identified by
The powder diffraction patterns corresponding to WC, Co, and
Co6W6C were
identified in the 88% W2C/12% Co matrix. The
compound with the formula W2C (suggested by
the label 88% W2C/12% Co) was not identified
by
The use of these materials in the validation offers an excellent opportunity to determine recoveries for chemically bound and interstitial elemental Co.
The
Na2WO4.2H2O
was
4.2. Preliminary Determination of W and Co Analytical Recoveries of
Diverse
This study was performed to test the matrix independence of the
digestion procedure of this analytical method. Six diverse
Because this method is based on the analysis of elemental composition, gravimetric conversion factors must be used to convert from the mass of a matrix spike to the mass of an analyte element. In order to accurately evaluate recoveries, the manufacturer's reagent label information and Certificates of Analysis were used to calculate the gravimetric factors listed in Tables 12 to 15 below. In addition to chemical formula information, these data included percent purity and, in some cases, elemental composition. For example, Na2WO4.2H2O was listed as 100.4% pure based on tungsten content (presumably due to water of hydration lost during manufacture). In the case of the tungsten carbide matrices, the respective gravimetric factors implied by the nominal compositions 88% W2C/12% Co and 94% WC/6% Co were in good agreement with the gravimetric factors calculated from the certification provided by the manufacturer.
Procedure
Matrix spikes were prepared from reagent and certified sources
independent of calibration standards. Two samples of each of the six
dry matrices were prepared. Known amounts of each dry sample matrix
were added to individual tared 0.8-µm pore size,
The amounts of W and Co in these analyte spikes were calculated
from assay information provided by the chemical manufacturer. All W
and Co results were calculated from
Results
Results for the preliminary analyses for spiked W and Co samples are shown in Table 12 (repeat analyses of tungsten carbide/Co samples are tabulated separately):
| Tungsten Matrix Digestion Evaluation - Tungsten Results | |||||
| Matrix in 2% H3PO4 | Amount (mg) | % W in Matrix | µg/mL Theory (T) | µg/mL Found (F) | W Recovery F/T |
| W, powder | 2.446 | 100.00 | 48.92 | 49.72 | 1.0164 |
| W, powder | 4.769 | 100.00 | 95.38 | 96.30 | 1.0097 |
| WO3, powder | 3.068 | 79.10 | 48.54 | 48.61 | 1.0014 |
| WO3, powder | 6.121 | 79.10 | 96.83 | 95.00 | 0.9811 |
| WC, < 1 µm | 3.496 | 93.40 | 65.31 | 65.83 | 1.0080 |
| WC, < 1 µm | 3.637 | 93.40 | 67.94 | 69.37 | 1.0211 |
| 94% WC, < 45 µm |
4.201 | 87.87 | 73.83 | 71.67 | 0.9708 |
| 94% WC, < 45 µm |
9.922 | 87.87 | 174.37 | 167.70 | 0.9618 |
| 88%
W2C, 5 to 45 µm |
5.742 | 84.08 | 96.56 | 97.37 | 1.0084 |
| 88%
W2C, 5 to 45 µm |
8.551 | 84.08 | 143.79 | 145.49 | 1.0118 |
| Na2WO4.2H2O | 2.401 | 55.96 | 26.87 | 27.07 | 1.0074 |
| Na2WO4.2H2O | 7.638 | 55.96 | 85.48 | 87.88 | 1.0280 |
| Na2WO4.2H2O | 9.684 | 55.96 | 108.38 | 106.50 | 0.9826 |
| Average | 1.0007 | ||||
| (SD = 0.0202) CV | ±0.0202 | ||||
The tungsten carbide spiked samples were reanalyzed for W confirming the recoveries obtained above. These results are shown in Table 13:
| Tungsten Matrix Digestion
Evaluation - Tungsten Results (Repetitions) | |||||
| Matrix in 2% H3PO4 | Amount (mg) | % W in Matrix | µg/mL Theory (T) | µg/mL Found (F) | W Recovery F/T |
| 94% WC (repeat) | 4.201 | 87.87 | 73.83 | 72.26 | 0.9788 |
| 94% WC (repeat) | 9.922 | 87.87 | 174.37 | 166.61 | 0.9555 |
| 88% W2C (repeat) | 5.742 | 84.08 | 96.56 | 96.71 | 1.0016 |
| 88% W2C (repeat) | 8.551 | 84.08 | 143.79 | 145.05 | 1.0087 |
| Average | 0.9862 | ||||
| (SD = 0.0241) CV | ±0.0244 | ||||
The same tungsten carbide spiked samples were also analyzed on the
| Tungsten Matrix Digestion Evaluation - Cobalt Results | |||||
| Matrix in 2% H3PO4 | Amount (mg) | % Co in Matrix | µg/mL Theory (T) | µg/mL Found (F) | Co Recovery F/T |
| 94% WC, < 45 µm | 4.201 | 5.45 | 4.58 | 4.93 | 1.0766 |
| 94% WC, < 45 µm | 9.922 | 5.45 | 10.82 | 11.56 | 1.0689 |
| 88% W2C, 5 to 45 µm | 5.742 | 11.70 | 13.44 | 13.65 | 1.0159 |
| 88% W2C, 5 to 45 µm | 8.551 | 11.70 | 20.01 | 20.44 | 1.0215 |
| Average | 1.0457 | ||||
| (SD = 0.0314) CV | ±0.0301 | ||||
These samples were reanalyzed for Co confirming the recoveries shown above. The results of the Co reanalyses are listed in the Table 15:
| Tungsten Matrix Digestion
Evaluation - Cobalt Results (Repetitions) | |||||
| Matrix in 2% H3PO4 | Amount (mg) | % Co in Matrix | µg/mL Theory (T) | µg/mL Found (F) | Co Recovery F/T |
| 94% WC (repeat) | 4.201 | 5.45 | 4.58 | 4.96 | 1.0832 |
| 94% WC (repeat) | 9.922 | 5.45 | 10.82 | 11.53 | 1.0661 |
| 88% W2C (repeat) | 5.742 | 11.70 | 13.44 | 13.53 | 1.0070 |
| 88% W2C (repeat) | 8.551 | 11.70 | 20.01 | 20.44 | 1.0215 |
| Average | 1.0445 | ||||
| (SD = 0.0361) CV | ±0.0345 | ||||
4.3. Determination of Interelement Corrections (IECs):
Spectral interferences in
| Where: | ||
| Ki | = | IEC factor for a particular pairing of affected element with affecting element |
| Bi | = | apparent concentration determined on the
channel of the affected element produced by aspiration of
the |
| Ci | = | concentration of the interference element |
These IEC factors are typically small. A typical factor of 2 × 10⁻⁴ means that a 1,000 µg/mL standard of the interferant produces a signal on the channel comparable to 0.2 µg/mL of the element represented by the channel. The determination of interelement correction factors requires the presence of large amounts of the interfering elements; therefore, the stock solutions used in the interference study have concentrations that far exceed levels expected in actual samples. The solutions used were of high purity and expected to give reliable indications of interferences. However, interferences on the Si channel may not be as reliable due to contamination from Si in the glassware used in manufacture and preparation.
Spectral corrections are minimal for most screened elements but are included to avoid misleading indications of overexposures to screened elements. Interferences from matrix background and contamination are minimized by the experimental design. During calibration, a reagent blank is measured on all channels. The intercept of the resulting calibration curve therefore corrects for the reagent matrix background and for any contamination from the aqueous ammonia and reagent acids. When the MCE filter or Smeartab wipe sample medium contributes background, the blank sample media results can also be subtracted. When the sample dust matrix contributes to the background, only interferences from those elements measured on other channels can be corrected in this method. Spectral interferences on an affected line are corrected based on measurements at the analytical lines of known interferant elements. Most elements potentially present in W matrices are included in the list.
Background corrections were not applied in this method other than for intercept and blanks. Other approaches to background corrections are often provided by instrument manufacturers. Background interference corrections are sometimes performed by background modelling. The simplest model is to assume that the background level measured at a preselected wavelength near the affected line represents the background level "under" a peak signal. Such an approach considers the elevated background without regard to cause and requires a familiarity with the sample matrix for all samples to be analyzed. A wide variety of sample matrices may be problematic using this approach, unless each sample is scanned to determine that the background model is appropriate. It is an appropriate strategy if the background is known to be level across the ICP scan, and the selected background wavelength does not overlap spectral interference peaks of any other elements (not just screening elements). Such assumptions regarding background corrections may be inappropriate for matrices submitted for routine analyses by this method; therefore, that approach was not used.
A few interferences having an elevated background component were noted (such as the interference of W on the Co channel). In this method, both background and spectral interferences were treated as linear functions of the interfering element and are corrected as spectral interferences.
Once determined, the IEC factors are used in the iterative interelement correction equation given in Section 3.7.1. When the channels for interference elements do not have interferences from other elements; the measured concentrations of the interferant elements are accurate, and the corrections are first order and can be made in one step. Second and higher order interferences are common in ICP; interferences themselves often have interferences, and the initial estimates of interference element concentrations may be progressively corrected in an iterative process. In such a process, the concentrations of interference elements having interferences are progressively corrected so that the Cc of the interferant element resulting from the previous step substitutes for Ci in making corrections in the subsequent step. (Cunc in the equation does not change.) Estimates of concentrations of both analytes and interferences are improved at each step and the process is continued until there are no significant differences in concentrations of the elements calculated at each step or until the differences are less than the corresponding detection limits. The iterative process converges to an internally consistent set of results.
Procedure
For W, Co, and all screening elements, one or more standard solutions each containing 1,000 µg/mL of a single interferant element (10,000 µg/mL in the case of Fe) were analyzed, and apparent concentrations were measured on the other element channels for indications of interference. These stock solutions are listed in Table 11 in Section 4.
The analysis of high concentration standards can result in
Archived scans for interferences on W and Co were visually examined to assess the types of interferences affecting the analysis of these elements and to help assess the appropriateness of using a linear model to correct for these interferences.
Results
The IEC factors for each interference noted were calculated as
described in the introductory remarks above. These IEC factors are
instrument dependent; for brevity, only a relative ranking of
interferences is shown in Table 16 below along with pertinent channel
parameters, qualitative DL, and background equivalent concentration
(BEC) data (DL and BEC results are further discussed in Section 4.4.).
Interferences shown in bolded type have correction factors
exceeding 10-4 expressed as µg/mL
channel per µg/mL interferant. The range of interest for
interference correction factors extends below
10-4 for certain elements; these additional
detected interferences are indicated by element symbols in small type.
Interferences are included without distinction to background or
spectral type and are listed by element symbol in order of decreasing
magnitude. Only significant interferences are shown and are corrected
for. The cutoff criterion for determining significant interelement
correction factors was whether an element, at a concentration of 100
µg/mL, would produce an apparent concentration on another
element's channel exceeding 5% of the Final Rule Limit for that
element (50-mL solution volume and
Although an interference was noted for Ti on both W and Co determinations, in the absence of additional complexing agents (e.g., oxalate ion) any digested titanium would be converted to insoluble titanium phosphate. For this reason, the interference from titanium may be minimal. (Spot tests of various titanium compounds using the digestion procedure indicate that the anatase and rutile forms of TiO2 are only slightly soluble, while titanium oxalate is completely soluble.) The instrument in use at the OSHA SLTC was not equipped with a Ti channel, but Ti could be monitored adequately on the Os channel (225.585 nm) where Ti strongly interferes. Titanium has a peak centered at 225.580 nm. Osmium is a very rare element that is not expected to be present in workplace atmospheres sampled for W and Co.
In addition to those listed, other potential interferences were identified in this study, but they were judged insignificant for the expressed purposes of this method.
| ICP-AES Instrumental Parameters and Observed Interferences | |||||
| Channel | Wavelength (nm) | Order * | DL, µg/mL (2 × SD) |
BEC, µg/mL | Interferences |
| Al | 308.215 | 2 | 0.11050 | 6.32 | Be |
| As | 189.042 | 3 | 0.03150 | 1.30 | Si Mo Cr Al Be W Fe1 |
| Be | 313.042 | 2 | 0.00055 | 0.0345 | V Zr Ti |
| Ca | 393.366 | 2 | 0.00040 | 0.0891 | |
| Cd | 226.502 | 3 | 0.00425 | 0.232 | Fe1 Ni Mo As Ti Co Al W |
| Co | 228.616 | 2 | 0.00320 (ID-213) 0.00850 (ID-125G) | 0.569 | Ti W Cr Ni Cd Mg Fe1 Mo Zr Be |
| Cr | 267.720 | 3 | 0.01000 | 0.766 | |
| Cu | 324.754 | 2 | 0.01000 | 0.665 | Mo Cd |
| Fe1 | 259.940 | 3 | 0.00600 | 0.431 | |
| Fe2 | 271.440 | 3 | 0.16150 | 9.34 | Co |
| Mg | 279.080 | 2 | 0.10250 | 5.86 | |
| Mn | 257.610 | 3 | 0.00195 | 0.0680 | |
| Mo | 202.030 | 3 | 0.01200 | 0.495 | |
| Ni | 231.604 | 3 | 0.01600 | 0.649 | |
| Pb | 220.353 | 3 | 0.06500 | 2.44 | Al Ni W Co Zr Se Mn Cu Cd Zn Fe1 |
| Sb | 217.581 | 3 | 0.06250 | 2.46 | W Be Zn |
| Se | 196.090 | 3 | 0.05150 | 2.52 | W Al Mn Sb |
| Si | 288.158 | 2 | 0.06550 | 3.52 | Sb Al W |
| Sn | 189.980 | 3 | 0.01800 | 0.877 | |
| Te | 214.275 | 2 | 0.06450 | 3.79 | V Cd Mo Ti Mg W Zn Al Fe1 Mn Cu |
| Ti † | (225.585) | 3 | (0.2 estimated) | 7.39 | Fe1 Ni W |
| V | 310.230 | 2 | 0.03000 | 1.21 | Be Zr W |
| W | 239.709 | 3 | 0.041 (ID-213) 0.04600 (ID-125G) |
2.56 | Co Mo Fe1 Be Zr Ni Ti |
| Zn | 213.856 | 3 | 0.00400 | 0.181 | |
| Zr | 343.823 | 1 | 0.01800 | 1.95 | |
| * See Section 1.2. for a
discussion of the use of |
| † With the exception of the Fe channels (Fe1 and Fe2), the symbols used in the Channel and Interferences columns above are interchangeable with the elements having the same symbol. The Fe1 channel was used to monitor the Fe concentration in the samples, because it generally provides more accurate corrections in the concentration range expected in air samples. The Fe2 channel is an alternate, less sensitive, channel that may be used at high Fe concentrations to assist in determining appropriate dilutions when the Fe1 channel is saturated. The third order osmium (Os) channel at 225.585 nm was the channel used to monitor the Ti concentration (see discussion in Section 1.5.2.) Titanium was evaluated as a possible interference because it is common in industrial operations where W and Co are found; Osmium was not evaluated as an interference because it is an exceedingly rare element. |
4.4. Determination of Qualitative and Quantitative Detection Limits and Background Equivalent Concentrations (5.7.):
A modification of the International Union of Pure and Applied
Chemistry (IUPAC) qualitative detection limit equation (5.16.) was
used for this study. According to the IUPAC convention, 3 × SD defines
the qualitative detection limit; however,
Procedure:
The instrument was calibrated for W, Co, and the screening elements. BECs were calculated from the calibration information. The detection limits for W and Co were measured during the validation. Detection limit estimates for screened elements were obtained from reference 5.7. Reagent blanks and calibration standards of 100 µg/mL W and 10 µg/mL Co were aspirated to obtain the slope of the calibration curve. The reagent blank was measured ten times at the W and Co wavelengths to determine the SDs of the measurements. The ARL software (5.13.) was used to perform these calculations. Each DL was calculated as follows:
Qualitative DL = 2 × SDrblank / m
Quantitative DL = 10 × SDrblank / m
| Where: | ||
| SDrblank | = | standard deviation of the reagent blank signal |
| Istd | = | signal intensity of the aspirated calibration standard |
| Irblank | = | signal intensity of the aspirated reagent blank |
| Cstd | = | concentration of the aspirated standard |
| m | = | slope of the calibration curve |
Note: Some
According to this latter approach, the DL is estimated to be a small fraction, e.g., 2%, of the BEC.
Results:
The results for qualitative and quantitative detection limits are shown in terms of solution and exposure concentrations in Tables 1 (in Sections 1.4.2.) and 2 (in Section 1.4.3.). Qualitative DLs as well as BECs for Co, W, and all the screening elements are shown in Table 16 (Section 4.3.) in terms of solution concentration. The DLs averaged 2% of the corresponding BECs with a range of 0.5% to 3%.
4.5. Determination of Analytical Method Precision and Accuracy for Insoluble W:
Tungsten carbide composites with Co binder were the most
representative of previous analyses requested at the OSHA Salt Lake
Technical Center and they also presented the most severe test of this
analytical method. Tungsten carbide and many other tungsten compounds
are very dense. The pure tungsten carbides WC and
W2C have densities of 15.63 and 17.15
respectively (5.9.). At 19.3 g/mL, the density of W is too high to
obtain stable aerosols above 5 µm diameter (5.2.). The
commercially available reference materials for these composites exceed
5 µm. For this validation the materials were not sieved because
they may not be sufficiently homogeneous for sieved material to match
the certified composition. In addition, larger particles are generally
less easily digested because they offer a small
Procedure
Three spiked samples of each of the two most difficult insoluble
matrices, 94% WC/6% Co and 88% W2C/12% Co,
(certified materials described in Section 4.1.) were prepared by
spiking tared 0.8-µm pore size,
Six spiked MCE filter samples representing concentrations of insoluble W near the STEL were made from pure W in order to avoid problems associated with small sample weight and the inhomogeneity in the tungsten carbide matrices. All the reagents and certified materials used for spiking were independent of the stock standards used to prepare calibration standards.
Results
The theoretical amounts of W in all insoluble analyte spikes were calculated from assay information provided by the chemical manufacturer. The analytical method precision and accuracy for insoluble W are shown in Tables 17 and 18.
| Analysis - Insoluble W TWA
Determination Tungsten Carbide Matrices * (2 L/min, 4 h, 480 L, | |||||
| OSHA-PEL Level | N † | Mean F/T | Std Dev | CV | OE (%) |
| 0.5 × | 6 | 1.0190 | 0.0160 | 0.0157 | ± 5.04 |
| 1 × | 6 | 1.0248 | 0.0139 | 0.0135 | ± 5.18 |
| 2 × | 6 | 0.9935 | 0.0744 | 0.0748 | ± 15.61 ‡ |
| Summary | 18 | 1.0124 | NA | 0.0448 | ± 10.2 |
* Composition of certified materials:
87.87 for W in 94%
WC
84.08 for W in 88% W2C
† At each exposure level, three 94% WC and three 88% W2C spiked samples were analyzed.
‡ One of the 94% WC samples at 2 × PEL gave a recovery of 0.854 and was not deleted in the statistical analysis. Reanalysis of this sample also gave a low recovery (F/T = 0.841). This was not an outlier by the Grubb's test (99% confidence level). Nothing unusual was observed in the analysis of the Co content of this sample. Variation was probably due to the inhomogeneity of the WC/Co composite.
| Analysis - Insoluble W
STEL Determination Pure Tungsten Matrix * (2 L/min, 15 min, 30 L, | |||||
| OSHA-STEL Level | N | Mean FT | Std Dev | CV | OE (%) |
| 1 × | 6 | 1.0467 | 0.0212 | 0.0202 | ± 8.71 |
* The composition indicated on reagent certification is 100.00% W.
4.6. Determination of Analytical Method Precision and Accuracy for Soluble W:
Cobalt is not commonly present when sampling for soluble W, so it was not included in this experiment.
Procedure
Analyte spikes of W were prepared from reagents independent of calibration standards. Spikes of soluble W were made by delivery of solutions of known concentration using pipettes and micropipettes.
The 0.8-µm pore size,
Results
The analytical method precision and accuracy data for soluble W are shown in Tables 19 and 20:
| Analysis - Soluble W TWA
Determination Sodium Tungstate Dihydrate Matrix (2 L/min, 4 h, 480 L, | |||||
| OSHA-PEL Level | N | Mean F/T | Std Dev | CV | OE (%) |
| 0.5 × | 6 | 1.0892 | 0.0100 | 0.0092 | ± 10.76 |
| 1 × | 6 | 1.0652 | 0.0087 | 0.0082 | ± 8.16 |
| 2 × | 6 | 1.0640 | 0.0121 | 0.0114 | ± 8.68 |
| Summary | 18 | 1.0728 | NA | 0.0097 | ± 9.22 |
| Analysis - Soluble W STEL
Determination Sodium Tungstate Dihydrate Matrix (2 L/min, 15 min, 30 L, | |||||
| OSHA-STEL Level | N | Mean F/T | Std Dev | CV | OE (%) |
| 1 × | 6 | 1.0615 | 0.0074 | 0.0070 | ± 7.55 |
4.7. Determination of Analytical Method Precision and Accuracy for Co:
Procedure
The 0.8-µm pore size,
Note: The 100 µg/mL Co spiking solution was a 1:10 dilution made from a different bottle of atomic spectral standard than was used to make the two Co calibration standards. Because both bottles had the same lot number, this experiment did not provide a completely independent measure of Co recovery but did provide an adequate measure of precision. When new ICP calibration standards are prepared at SLTC, a quality assurance check is made by analyzing and comparing the old and new calibration standards. This Co ICP stock standard has checked out fine on this quality assurance test and on subsequent quality control tests using independent Co sources. A fully independent test of Co recovery is provided by the additional Co recovery experiments performed in Section 4.8.
After preparation, the resulting final solution matrix was 100 µg/mL W and would represent exposures to soluble W at 10 × TWA PEL or exposures to insoluble W at 2 × TWA PEL.
Results
Analytical method data and precision and accuracy for Co are shown below in Table 21. The analytical method data, precision, and accuracy for 100 µg/mL W matrix is provided below Table 21:
| Analysis - Co TWA
Determination (In 100 µg/mL W Solution Matrix) * (2 L/min, 480 L, | |||||
| OSHA-PEL Level | N | Mean F/T | Std Dev | CV | OE (%) |
| 0.5 × | 6 | 1.0627 | 0.0484 | 0.0456 | ± 15.39 † |
| 1 × | 6 | 1.0440 | 0.0014 | 0.0014 | ± 4.68 |
| 2 × | 6 | 1.0328 | 0.0063 | 0.0061 | ± 4.50 |
| Summary | 18 | 1.0465 | NA | 0.0266 | ± 9.97 |
| * | Analysis for W (100 µg/mL) matrix: | ||
| Bias | = | + 0.0411 | |
| CV (Pooled) | = | 0.0079 | |
| Overall Error (Total) | = | ± 5.69% | |
† One of the samples at 0.5 × PEL was overlooked on the day all the other samples were analyzed; it was analyzed two days later at the first opportunity. The result was not an outlier according to Grubb's test (99% confidence level).
4.8. Determination of Analytical Method Precision and Accuracy for Co at Higher Levels:
The spiked MCE filter samples of the cemented tungsten carbide matrices prepared in Section 4.5. also contained substantial amounts of Co (3.2 ×, 6.5 ×, 7.4 ×, 12.3 ×, 14.9 ×, and 28.0 × TWA PEL). These samples were also analyzed for Co. This supplementary experiment serves two purposes:
- 1) To provide an independent test of Co recovery not provided in
Section 4.7.
2) To extend the validation to include levels of Co potentially found in sampling for W in cemented tungsten carbide operations.
Procedure
As described in Section 4.5., analyte spikes were prepared from
certified sources independent of calibration standards. The amounts of
W and Co in all insoluble analyte spikes were calculated from assay
information provided by the chemical manufacturer. The weights of the
spikes of the cemented tungsten carbide matrices were determined by
weighing on tared 0.8-µm pore size,
Results
This experiment gave an average Co recovery of 1.028 which compares well to the average Co recovery of 1.046 obtained in Section 4.7. The Co results are listed in Table 22:
| Analysis - Co TWA
Determinations Above Usual Validation Range (In Insoluble Tungsten Carbide Samples at 0.5, 1, and 2 × W PEL)* (2 L/min, 4 h, 480 L, | |||||
| OSHA-PEL Level † | Matrix | Mean F/T | Std Dev | CV | OE (%) |
| 3.2 × | Co in 94% WC | 1.0653 | 0.0190 | 0.0179 | ± 10.11 |
| 6.5 × | Co in 94% WC | 1.0663 | 0.0083 | 0.0078 | ± 8.19 |
| 7.4 × | Co in 88% W2C | 1.0067 | 0.0099 | 0.0098 | ± 2.63 |
| 12.3 × | Co in 94% WC | 1.0330 | 0.0380 | 0.0368 | ± 10.66 |
| 14.9 × | Co in 88% W2C | 0.9997 | 0.0101 | 0.0101 | ± 2.05 |
| 28.0 × | Co in 88% W2C | 1.0000 | 0.0056 | 0.0056 | ± 1.12 |
| Summary | 18 samples (Pooled) |
1.0285 | NA | 0.0181 (df=12) | ± 6.47 |
| 18 samples (Combined) |
1.0285 | NA | 0.0325 (df=17) | ± 9.35 | |
F/T = Found/Theoretical Overall
error (± %) df = degrees of freedom
* Composition of the certified materials: 5.45% Co in 94% WC,
11.70% Co in 88% W2C
† N = 3 samples for
each
4.9. Assessment of Typical Levels of Blank Contamination, Analyte
Typical blank contamination,
Procedure
Four blanks were prepared from the same lot of 0.8-µm pore
size,
All results were calculated from
Results
Table 23 shows the blank contamination levels (µg/mL) observed:
| Element | N, µg/mL* | Element | N, µg/mL | Element | N, µg/mL | Element | N, µg/mL |
| Al | 2, 0.12 | Cr | 1, 0.020 | Ni | ND | Te | 1, 0.080 |
| As | ND | Cu | ND | Pb | ND | Ti | ND |
| Be | ND | Fe | ND | Sb | ND | V | ND |
| Ca | 4, 0.018 | Mg | 2, 0.11 | Se | 2, 0.064 | W | 2, 0.070 |
| Cd | ND | Mn | ND | Si | 4, 3.3 | Zn | ND |
| Co | 4, 0.015 | Mo | ND | Sn | 1, 0.020 | Zr | 2, 0.020 |
* The levels of contamination are reported in the following format:
number detected, mean of detected. ND indicates all four blanks were
Carry-over and noise were observed during the validation. The worst instances are listed in Table 24:
| Preceding Sample Element(s) | Apparent |
| 2 µg/mL Cr,Mo,Ni,Sb,V 20 µg/mL Fe * |
0.075 µg/mL As |
| " | 0.020 µg/mL Co |
| " | 0.13 µg/mL Mg |
| " | 0.079 µg/mL Sb |
| " | 0.21 µg/mL Se |
| " | 0.080 µg/mL Sn |
| " | 0.12 µg/mL Te |
| 99.26 µg/mL W, 56 µg/mL Co |
0.18 µg/mL W |
*
The long delay in
4.10. Summary:
The validation results indicate the method meets both the NIOSH and
OSHA criteria for accuracy and precision (5.5., 5.17.). The results
are within an acceptable range (OE < ± 25%). Detection limits are
adequate when samples are taken for TWA determinations for 480 min at
2 L/min, or for
5. References
- 5.1. National Institute for Occupational Safety and Health:
Criteria for a recommended standard .... occupational exposure to
Tungsten and Cemented Tungsten Carbide (DHEW/NIOSH Pub. No.
5.2. American Conference of Governmental Industrial Hygienists Inc.: Documentation of the Threshold Limit Values and Biological Exposure Indices; 5th ed. Cincinnati, OH: ACGIH, 1986. pp. 144, 614.
5.3. National Institute for Occupational Safety and Health:
NIOSH Manual of Analytical Methods by D. Taylor (DHEW/NIOSH
Pub. No.
5.4. Occupational Safety and Health Administration Analytical Laboratory: Insoluble Tungsten and Compounds (WC). Special Project by P. Giles (In house report). Salt Lake City, UT: USDOL/OSHA Salt Lake Technical Center, November, 1989.
5.5. Occupational Safety and Health Administration Analytical Laboratory: Insoluble and Soluble Tungsten in Workplace Atmospheres by XRF by M. C. Rose (In house report). Salt Lake City, UT: USDOL/OSHA Salt Lake Technical Center, June, 1988 (revised February, 1993).
5.6. Perkin-Elmer: Analysis of Tungsten Carbide,
5.7. Occupational Safety and Health Administration Analytical
Laboratory: ICP Backup Data Report (ARL 3560) for Metal and
Metalloid Particulates in Workplace Atmospheres (ICP Analysis),
(USDOL/OSHA Method No.
5.8. Mandel, J.: Accuracy and Precision, Evaluation and
Interpretation of Analytical Results, The Treatment of Outliers. In
Treatise On Analytical Chemistry, 2nd ed., Vol.1, edited by I.
M. Kolthoff and P. J. Elving. New York: John Wiley and Sons, 1978. pp.
5.9. Weast, R.C., ed.: Handbook of Chemistry and Physics. 60th ed. Boca Raton, FL: Chemical Rubber Company Press, 1979. pp B138 - B139.
5.10. Public Health Service: Toxicological Profile for Cobalt; (U.S., Department of Health & Human Services, Public Health Service, Agency for Toxic Substances and Disease Registry publication ATSDR/TP-91/10), 1992.
5.11. Jarvis, J.Q., E. Hammond, R. Meier, and C. Robinson: Cobalt Cardiomyopathy. Journal of Occupational Medicine. 34:620-626 (1992).
5.12. Occupational Safety and Health Administration Salt Lake Technical Center: ARL ICP Analysis Reference Guide - OSHA LAB (Comprehensive Version) by J. Septon. Salt Lake City, UT: USDOL/OSHA Salt Lake Technical Center, November, 1991 (unpublished).
5.13. Occupational Safety and Health Administration Salt Lake Technical Center: ARL ICP Tungsten + Cobalt Standard Operating Procedure by M.C. Rose. Salt Lake City, UT: USDOL/OSHA Salt Lake Technical Center (in progress), 1993 (unpublished).
5.14. National Institute for Occupational Safety and Health:
Documentation of the NIOSH Validation Tests by D. Taylor, R.
Kupel, and J. Bryant (DHEW/NIOSH Pub. No.
5.15. Occupational Safety and Health Administration Analytical
Laboratory: Precision and Accuracy Data Protocol for Laboratory
Validations. In OSHA Analytical Methods Manual 1st ed. (Pub. No.
ISBN:
5.16. Long, G.L. and J.D. Winefordner: Limit of Detection - A Closer Look at the IUPAC Definition. Anal. Chem. 55:712A-724A (1983).
5.17. Occupational Safety and Health Administration Analytical
Laboratory: OSHA Analytical Methods Manual. Vol III
(USDOL/OSHA-SLTC Method Evaluation Guidelines), (Pub. No. ISBN: