| Method no.: | 26 |
| Matrix: | Air |
| Target concentration: | 0.5 ppm (1.0 mg/m3) |
| OSHA PEL: | 10 ppm (20 mg/m3) |
| Procedure: | Samples are collected on glass fiber filters impregnated with mercuric acetate. Methyl mercaptan is regenerated from the mercuric mercaptide, formed during sampling, by treatment with hydrochloric acid. The methyl mercaptan is extracted into methylene chloride and analyzed by gas chromatography with a flame photometric detector. |
| Recommended air volume and sampling rate: |
20 L at 0.2 L/min |
| Reliable quantitation limit: | 0.027 ppm (0.053 mg/m3) |
| Standard error of estimate at the target concentration: |
8.6% |
| (Section 4.5) | |
| Special requirements: | Samples should be protected from light until analyzed. |
| Status of method: | Evaluated method. This method has been subjected to the established evaluation procedures of the Organic Methods Evaluation Branch. |
| Date: February 1981 | Chemist: Carl J. Elskamp |
OSHA Analytical Laboratory
Salt Lake City, Utah
1. General Discussion
- 1.1 Background
- 1.1.1. History
In the past, samples received at the OSHA laboratory for methyl mercaptan have been collected in bubblers containing an organic solvent, such as xylene, or on activated charcoal. Bubblers, besides being cumbersome to use in the field, are suspected to have low collection efficiencies for methyl mercaptan. From studies done at the OSHA laboratory, it was found that methyl mercaptan reacts in the presence of activated charcoal to form a disulfide. Thus, a better sampling device was needed.
Several sampling devices are mentioned in methods in the literature. One method involves collection in bubblers or impingers containing mercuric acetate in acetic acid and analysis by colorimetry (Ref. 5.1.). Another method describes an absorber tube containing glass wool wetted with a mercuric acetate solution and employs a similar analysis scheme (Ref. 5.2.). Filters impregnated with mercuric cyanide (Ref. 5.3.) or mercuric acetate (Ref. 5.4.) to form the nonvolatile mercuric mercaptide have also been used. Adsorbent tubes methods have been found to be unacceptable for methyl mercaptan. (Ref. 5.5.)
Since it offered the most advantages, a method reported by Knarr and Rappaport using glass fiber filters impregnated with mercuric acetate (Ref. 5.4.) was evaluated. Although methylene chloride was recommended as the extraction solvent, there were problems encountered during this evaluation. The vent tube on the flame photometric detector, which is made of aluminum, was constantly being plugged up. This is likely due to reaction of the vent tube with the combustion products of methylene chloride, i.e. hydrochloric acid, to form aluminum salts. Also, the methylene chloride seemed to easily form bubbles in the syringe. Other solvents such as toluene, isooctane, and chloroform gave lower extraction efficiencies than methylene chloride. Although some precision may be lost using methylene chloride, it was found to be the best solvent of those tested. The plugged detector vent problem was overcome by constructing a glass vent that performed well throughout the evaluation.
The method also recommended using 20 mL of methylene chloride for extraction. It was found that by using 5 mL of methylene chloride comparable extraction efficiencies were obtained, thus the detection limit was decreased by a factor of four.
The recommended flame photometric detector gives a non-linear response for sulfur compounds. The photoionization detector gives a linear response and possibly a lower detection limit (Ref. 5.6.) but is not compatible with methylene chloride. The photoionization detector was successfully used to monitor the methyl mercaptan concentrations during breakthrough studies and sample generations since no methylene chloride was present.
The target concentration of 0.5 ppm (1.0 mg/m3) was chosen because this level has been adopted by the American Conference of Governmental Industrial Hygienists (Ref. 5.7.) and proposed by the National Institute for Occupational Safety and Health (Ref. 5.8.). The current OSHA PEL is 10 ppm. This sampling and analytical procedure appears to also be acceptable for samples at or above the OSHA PEL.
1.1.2. Toxic effects (This section is for information only and should not be taken as the basis of OSHA policy).
It has been reported that methyl mercaptan exhibits a toxicity similar to, but less than that of hydrogen sulfide. Others have reported the toxicity of both compounds being the same. Methyl mercaptan affects the nervous system and can cause convulsions and narcosis. At high concentrations, it causes paralysis of the respiratory center. At lower levels, it produces pulmonary edema (Ref. 5.7.).
A fatal human exposure was described by Shults et al. where a man emptying gas cylinders of methyl mercaptan was overexposed. He was found comatose at the worksite and was hospitalized. He developed acute hemolytic anemia and methemoglobineomia and remained in a deep coma until dying 28 days after the accident (Ref. 5.9.).
1.1.3. Exposure
Methyl mercaptan is extensively used in the synthesis of the amino acid methionine. It is also used as an intermediate in the manufacture of jet fuels, pesticides, fungicides, and plastics. It occurs naturally in the "sour" gas in West Texas, in coal tar, and in petroleum distillates (Ref. 5.10.). It is also produced in large amounts as a by-product in paper manufacturing and petroleum refining (Ref. 5.4.).
It is estimated that over 19,000 U.S. workers were exposed to methyl mercaptan between 1972 - 74 (Ref. 5.11.).
1.1.4. Physical properties - (Ref. 5.12. unless otherwise noted)
| molecular formula: | CH3SH |
| molecular weight: | 48.11 |
| melting point: | -123°C |
| boiling point: | 6.2°C |
| color: | water-white below boiling point or colorless gas (Ref. 5.10.) |
| specific gravity: | 0.8665 (20/4°C) |
| vapor pressure: | 2259 mm Hg at 37.8°C |
| flash point: | 0°F (open cup method) |
| odor: | odor of rotten cabbage (Ref. 5.11.) |
| explosive limits: | 3.9 to 21.8% (Ref. 5.10.) |
| solubility: | 23.30 µg/L in water at 20°C (Ref. 5.11.) soluble in alcohol, ether, petroleum naphtha (Ref. 5.10.) |
| synonyms: | methanethiol, mercaptomethane, methylsulfhydrate, thiomethyl alcohol. |
1.2. Limit defining parameters
- 1.2.1. Detection limit of the analytical procedure.
The detection limit of the analytical procedure is 0.33 nanograms per injection. This is the amount of methyl mercaptan which will give a peak whose height is approximately five times the baseline noise. (Section 4.1.)
1.2.2. Detection limit of the overall procedure
The detection limit of the overall procedure is 1.06 µg per sample (0.027 ppm or 0.053 mg/m3 for a 20-L sample). This is the amount of analyte spiked on the sampling device which allows recovery of an amount of analyte equivalent to the detection limit of the analytical procedure. (Section 4.2.)
1.2.3. Reliable quantitation limit.
The reliable quantitation limit is the same as the detection limit of the overall procedure. This is the smallest amount of analyte which can be quantitated within the requirements of a recovery of at least 75% and a precision of ±25% or better. (Section 4.2.)
The reliable quantitation limit and detection limits reported in the method are based upon optimization of the instrument for the smallest possible amount of analyte. When the target concentration of an analyte is exceptionally higher than these limits, they may not be attainable at the routine operating parameters.
- 1.2.4. Sensitivity
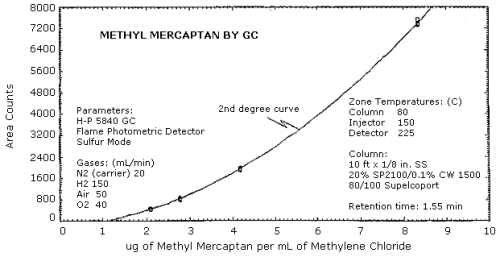
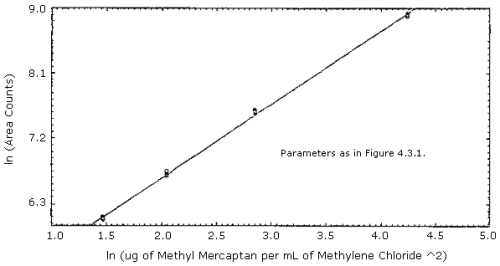
The sensitivity is not a linear function on the flame photometric detector. The response can be fit to a second degree curve over a limited range or can be fit to a ln(concentration)2 versus ln(area) relationship. (Section 4.3)
1.2.5. Recovery
The recovery of analyte from the collection medium must be 75% or greater. The average recovery from generated samples over the range of 0.5 to 2 times the target concentration is 89.7%. (Section 4.4)
1.2.6. Precision (analytical method only)
The pooled coefficient of variation obtained from replicate determinations of analytical standards between 0.5 to 2 times the target concentration for the recommended air volume is 0.011. (Section 4.3.)
1.2.7. Precision (overall procedure)
The precision at the 95% confidence level for the 15-day storage test is ±16.8%. (Section 4.5.) This includes an additional ±5% for sampling error. The overall procedure must provide results at the target concentration that are ±25% or better at the 95% confidence level.
1.3. Advantages
- 1.3.1. The sampling procedure is convenient.
1.3.2. The analytical procedure is quick, sensitive, and reproducible.
1.3.3. Reanalysis of samples is possible.
1.3.4. Samples are stable, even at room temperature.
1.4. Disadvantages
- 1.4.1. The amount of sample that can be taken is limited by the
number of milligrams the filter will collect before breakthrough
occurs.
1.4.2. The precision is limited by the reproducibility of the pressure drop across the filters. The pumps are usually calibrated for one filter only.
1.4.3. The samples must be protected from light until analyzed.
2. Sampling Procedure
- 2.1. Apparatus
- 2.1.1. Personal sampling pump: Calibrated personal sampling
pump, the flowrate of which can be determined within 5% at the
recommended flowrate.
2.1.2. Glass fiber filters impregnated with mercuric acetate: The filters are prepared by soaking 37-mm Gelman type A glass fiber filters (or equivalent) in a 5% (w/v) aqueous solution of mercuric acetate. The filters are allowed to dry, and then assembled in two-piece filter cassettes without backup pads. The filters may be yellowish in color, which does not seem to affect their collection efficiency.
2.2. Reagents
None required
2.3. Sampling technique
- 2.3.1. Immediately before sampling, remove the plugs from the
filter cassette.
2.3.2. Connect the cassette to the sampling pump with flexible tubing. Air being sampled should not pass through any hose or tubing before entering filter cassette.
2.3.3. The cassette is attached to the employee's shirt collar or within his breathing zone. The inlet must be in a downward position during sampling.
2.3.4. Replace the plugs in the filter cassette immediately after sampling.
2.3.5. Protect samples from light after sampling.
2.3.6. With each batch of samples, submit at least one blank filter for analysis. This filter should be subjected to exactly the same handling as the samples except no air is drawn through it.
2.3.7. Transport the samples to the lab for analysis.
2.3.8. If bulk samples are submitted for analysis, they should be transported in a separate container from air samples.
2.4. Breakthrough
- 2.4.1. An attempt was made to determine the breakthrough volume
when sampling from an air stream containing 2.16
mg/m3 methyl mercaptan in air at 80%
relative humidity. No breakthrough was obtained after sampling for
750 min at 0.23 L/min, which is equivalent to over 170 L, or 0.37
milligrams of methyl mercaptan.
2.4.2. Theoretically, the breakthrough volume could be decreased if the atmosphere being sampled contained a significant amount of mercaptans or compounds that would react with the mercuric acetate making the mercuric ions unavailable to react with the methyl mercaptan.
2.5. Extraction efficiency
- 2.5.1. The extraction efficiency for samples generated on the
vapor generator over the range of 0.5 to 2 times the target
concentration is 89.7%. (Section 4.4.)
2.5.2. The extraction efficiency may vary from one laboratory to another and also from one lot of filters to another.
2.6. Recommended air volume and sampling rate
- 2.6.1. The recommended air volume is 20 L.
2.6.2. The recommended sampling rate is 0.2 L/min.
2.7. Interferences
- 2.7.1. An interference study has been reported (Ref. 5.4.). The
four potential interferences studied were hydrogen sulfide, dimethyl
sulfide, dimethyl disulfide, and propylene. There were no
differences in recoveries for samples collected with these
interferences present at either high or low humidity except when
dimethyl disulfide was present at high humidity. It was concluded
that additional methyl mercaptan was produced from the dimethyl
disulfide in the presence of water vapor.
2.7.2. Suspected interferences should be listed on the sample data sheets.
2.8. Safety precautions
- 2.8.1. Sampling equipment should be attached on the employee in
a manner that does not interfere with work performance.
2.8.2. Wear proper safety equipment dictated by the area in which sampling is performed.
2.8.3. To avoid possible exposure to mercuric acetate, which is very toxic, never disassemble the filter cassette.
3. Analytical Procedure
- 3.1. Apparatus
- 3.1.1. Gas chromatograph equipped with a flame photometric
detector used in the sulfur mode.
3.1.2. A GC column capable of separating methyl mercaptan from methylene chloride and any interferences. The column used for validation studies was: 10 ft × 1/8 in. stainless steel 20% SP2100, 0.1% CW 1500 on 80/100 Supelcoport.
3.1.3. An electronic integrator or some other suitable method of measuring peak areas.
3.1.4. Two-mL vials with Teflon-lined caps.
3.1.5. Gas syringe, 25-µL or other convenient size for standard preparations.
3.1.6. Microliter syringe, 2-µL or other convenient size for sample injections.
3.1.7. Separatory funnel, 30-mL.
3.1.8. Scintillation vials and caps.
3.1.9. Pipets or dispenser for the methylene chloride and hydrochloric acid.
3.2. Reagents
- 3.2.1. Chromatographic grade methylene chloride.
3.2.2. Lecture bottle of pure methyl mercaptan.
3.2.3. Hydrochloric acid, 25% in deionized water (v/v).
3.2.4. Purified GC grade nitrogen, hydrogen, air, and oxygen.
3.2.5. Aqueous solution of mercuric acetate (5% w/v).
3.3. Standard preparation (See Section 3.8. before proceeding)
- 3.3.1. Standards are prepared by injecting pure methyl mercaptan
using a gas syringe into methylene chloride contained in a
scintillation vial. The vial is immediately capped and then shaken
for a few seconds. The methylene chloride is dispensed into the vial
using the same pipet or dispenser as used for the samples.
3.3.2. Corrections must be made for temperature and pressure to calculate the standard concentration. Shown below is the calculation for a standard prepared by injecting 25.0 µL of methyl mercaptan into 5 mL (from same dispenser used for samples extractions) of methylene chloride. The atmospheric conditions were 640 mm Hg and 20°C.
| 25 µL
sample |
× | 640 mm
760 mm |
× | 273°K
(273+20)°K |
× | µmole
22.41 µL* |
× | 48.11 µg
µmole |
= | 42.11 µg
sample |
*Molar volume at 760 mm Hg, 0°C
3.3.3. Standards are transferred to 2-mL vials and sealed with Teflon-lined caps.
3.4. Sample preparation
- 3.4.1. Twenty milliliters of 25% hydrochloric acid and 5 mL of
methylene chloride are added to a 30-mL separatory funnel.
3.4.2. The sample filter is folded and inserted into the neck of the separation funnel, but not allowed to contact the liquid.
3.4.3. The filter is then pushed into the funnel with the stopper, which is seated in the same motion.
3.4.4. The funnel is shaken for 2 min without venting.
3.4.5. After the phases have separated, the methylene chloride is drained into a vial. The vial is then sealed with a Teflon-lined cap.
3.5. Analysis
- 3.5.1. GC conditions
| flow rates (mL/min) | zone temperatures (°C) | ||
| nitrogen (carrier) | 20 | column oven | 80 |
| hydrogen | 150 | injector | 150 |
| air | 50 | detector | 225 |
| oxygen | 40 | ||
| injection size | 2.0 µL | ||
| elution time | methyl mercaptan 1.6 min | ||
| chromatogram | (Section 4.6.) | ||
3.5.2. Peak areas are measured by an integrator or other suitable means.
3.5.3. A calibration curve is constructed from peak areas of standard injections. (Section 4.3.) Sample concentrations must be bracketed by standards.
3.6. Interferences
- 3.6.1. Any compound that has the same general retention time as
methyl mercaptan and responds on the flame photometric detector
(sulfur mode) is an interference. Possible interferences should be
listed on the sample data sheets.
3.6.2. GC parameters (i.e. column temperature, column, etc.) may be changed to circumvent any interferences.
3.6.3. Retention time on a single column is not considered proof of chemical identity. Samples over the PEL should be confirmed by GC/MS or other suitable means.
3.7. Calculations
The methyl mercaptan concentration (µg/sample) is obtained from the calibration curve from Section 3.5.3. The air concentration for samples is calculated using the following formulae.
| mg/m3 = A/(B)(C) | where | A | = | µg/sample from curve |
| B | = | liters of air sampled | ||
| C | = | extraction efficiency |
ppm = (mg/m3)(24.46)/48.11 = (mg/m3)(0.5084)
| where | 48.11 | = | molecular weight of methyl mercaptan |
| 24.46 | = | molar volume at 760 mm Hg and 25°C |
3.8. Safety precautions
- 3.8.1. Mercuric acetate is highly toxic by ingestion,
inhalation, and skin absorption (Ref. 5.13.). All work with it
should be done in a hood. After samples are extracted, dispose of
the aqueous layer in a labeled waste bottle. Do not dispose it down
a sink drain.
3.8.2. All work with methyl mercaptan standard preparations must be done in a hood. It is convenient to use a septum adapter for the lecture bottle. A length of flexible tubing is connected to the side vent of the adapter. The other end of the tubing is then placed in a beaker containing a solvent in which methyl mercaptan is soluble. The lecture bottle is then opened just far enough so bubbles are formed about one per five seconds. The beaker of solvent serves as a flow indicator as well as a partial trap for the methyl mercaptan. After standards are prepared the tubing is removed from the beaker of solvent and the lecture bottle is turned off. If the tubing is left in the solvent, the solvent will rise up the tube and enter the adapter. The solvent is then poured into a labeled waste bottle.
3.8.3. Extractions must be done in a hood. Avoid skin contact with solvents and sample filters.
3.8.4. Wear safety glasses and a lab coat at all times.
4. Backup Data
- 4.1. Detection limit of the analytical procedure
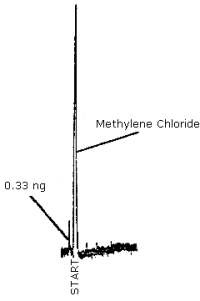
The detection limit of the analytical procedure was determined by making a 2.0-µL injection of a 0.167 µg/mL standard. The chromatogram is shown in Figure 4.1. The detection limit of the analytical procedure is 0.33 ng, which is equivalent to 0.834 µg per sample when using 5.0 mL of methylene chloride for extraction.
4.2. Detection limit of the overall procedure and reliable quantitation limit.
Detection limit samples were generated from a dry atmosphere containing approximately 1.0 mg/m3 methyl mercaptan by sampling for 5 min at approximately 0.2 L/min. The amount of methyl mercaptan recovered was near the analytical detection limit (0.834 µg per sample) for a sample extracted into 5.0 mL of methylene chloride. The detection limit of the overall procedure and the reliable quantitation limit are both 1.06 µg/sample (0.834/0.787).
Detection Limit of the Overall Procedure
|
| |||
| sample number |
theoretical amount (µg) |
amount recovered (µg) |
% recovery |
|
| |||
| 1 2 3 4 5 6 |
1.046 0.978 1.055 1.095 1.077 1.016 |
0.747 0.850 0.858 0.816 0.799 0.850 |
71.4 86.9 81.3 74.5 74.2 83.7 SD = 6.17 |
|
| |||
4.3. Sensitivity and analytical precision
Replicate injections of standards in the range of 0.5 to 2 times the target concentration were made. The data was fit to a second degree curve and a ln(concentration)2 versus ln(area) curve as shown in Figures 4.3.1. and 4.3.2. respectively.
Sensitivity and Analytical Precision
|
| ||||
| µg/sample µg/mL |
10.43 2.09 |
13.90 2.78 |
20.86 4.17 |
41.47 8.34 |
|
| ||||
| area counts SD CV |
450 443 446 449 442 445 445.8 3.19 0.0072 |
805 811 848 820 809 820 818.8 15.51 0.0189 |
1911 1923 1958 1965 1956 1959 1945.3 22.47 0.0116 |
7370 7370 7532 7344 7410 7394 7403.3 66.98 0.0090 |
|
| ||||
4.4. Recovery/extraction efficiency
Samples were generated from a dry atmosphere containing approximately 1.0 mg/m3 methyl mercaptan by sampling for 50, 100, and 200 min at approximately 0.2 L/min. These samples were equivalent to 0.5, 1, and 2 times the target concentration based on a recommended air volume of 20 L, respectively. The average recovery/extraction efficiency over the range studied was 89.7%.
Recovery/Extraction Efficiency
|
| ||||
| concentration level |
theoretical amount (µg) |
recovered amount (µg) |
% recovered | |
|
| ||||
| 0.5× | 9.19 | 8.82 | 96.0 | 87.9 |
| 8.59 | 7.57 | 88.1 | ||
| 9.26 | 7.62 | 82.3 | ||
| 9.62 | 7.53 | 78.3 | ||
| 9.46 | 8.45 | 89.3 | ||
| 8.92 | 8.33 | 93.4 | ||
| 1× | 20.90 | 17.54 | 83.9 | 87.6 |
| 19.54 | 19.16 | 98.1 | ||
| 21.08 | 18.39 | 87.2 | ||
| 21.89 | 18.98 | 86.7 | ||
| 21.53 | 17.15 | 79.7 | ||
| 20.31 | 18.27 | 90.0 | ||
| 2× | 44.04 | 41.95 | 95.3 | 93.6 |
| 41.16 | 42.16 | 102.4 | ||
| 44.41 | 43.09 | 97.0 | ||
| 46.11 | 41.61 | 90.2 | ||
| 45.35 | 37.74 | 83.2 | ||
| 42.78 | 40.01 | 93.5 | ||
|
| ||||
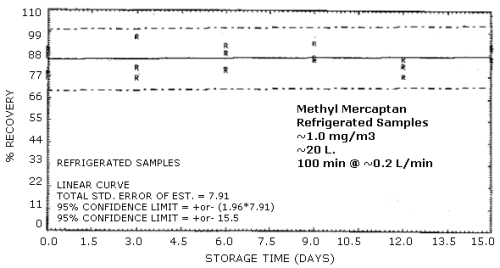
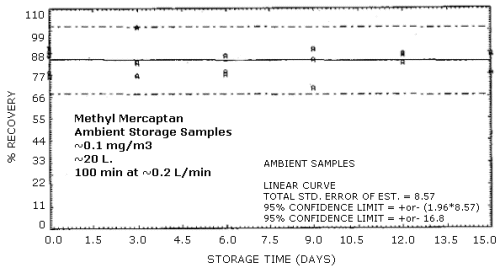
4.5. Storage test
Samples were generated at the target concentration at 80% relative humidity. All samples were taken for 100 min at approximately 0.2 L/min. Six samples were analyzed immediately and fifteen samples each were stored at refrigerated (-5°C) and ambient temperatures protected from light. These samples were analyzed over a period of 15 days. The tabulated results below are shown graphically in Figures 4.5.1. and 4.5.2. The samples are stable over the 15-day storage period under both storage conditions.
Storage Tests
|
| |||||||
| storage time | % recovery | ||||||
| (days) | (refrigerated) | (ambient) | |||||
|
| |||||||
| 0 | 89.8 | 78.3 | 88.5 | 89.8 | 78.3 | 88.5 | |
| 0 | 90.6 | 76.1 | 86.6 | 90.6 | 76.1 | 86.6 | |
| 3 | 81.1 | 76.0 | 96.7 | 83.1 | 100.9 | 76.5 | |
| 6 | 80.0 | 88.6 | 92.3 | 78.3 | 77.4 | 86.3 | |
| 9 | 93.4 | 85.2 | 86.4 | 69.9 | 89.5 | 84.1 | |
| 12 | 77.4 | 86.0 | 82.3 | 86.7 | 87.3 | 82.6 | |
| 15 | 92.3 | 86.0 | 91.4 | 86.9 | 87.4 | 78.0 | |
|
| |||||||
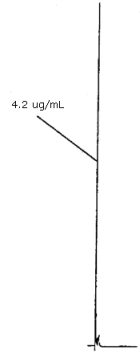
4.6. Chromatogram
A typical chromatogram using the GC parameters as in Section 3.5.1., is shown in Figure 4.6. The chromatogram is from a 4.2 µg/mL standard.
5. References
- 5.1. Moore, H., Helwig, R.J. Amer. Ind. Hyg. Assoc. J.
1960, 21, 466-70.
5.2. Nathans, M.W.; Jeong, A. In "Analytical Techniques in Occupational Health Chemistry", Dollberg, D.D.; Verstuyft, A.W., Eds.; American Chemical Society: Washington, D.C., 1980; p 231-9.
5.3. Okita, T. Atmos. Environ. 1970, 4, 93-102.
5.4. Knarr, R., Rappaport, S. Anal. Chem. 1980, 52, 733-6.
5.5. "Criteria for a Recommended Standard . . . Occupational Exposure to n-Alkane Monothiols, Cyclohexanethiol, and Benzenethiol", U.S. Dept. of Health, Education, and Welfare, Public Health Service, Center for Disease Control, National Institute for Occupational Safety and Health: Cincinnati, OH 1978; p 116.
5.6. Technical information brochure for the HNU Model 52-02 Photoionization detector, HNU Systems, Inc., 30 Ossipee Road, Newton, MA 1978.
5.7. "Threshold Limit Values for Chemical Substances and Physical Agents in the Workroom Environment", American Conference of Governmental Industrial Hygienists: Cincinnati, OH, 1978; p 21.
5.8. Reference 5.5, p 3.
5.9. Shults, W.T., Fountain, E.N., Lynch E.C. J. Am. Med. Assoc. 1970, 211, 2153-4.
5.10. Reference 5.5., p 18.
5.11. Reference 5.5., p 20.
5.12. Reference 5.5., p 127 - 9.
5.13. "The Condensed Chemical Dictionary", Eighth Edition, Van Nostrand, Reinhold Company, New York, NY, 1971, p 577-8.
5.14. "The Merck Index," Eighth Edition, Stecher, P.G., Ed. Merck & Company, Inc., Rahway, N.J., 1968, p 671.