| Method no.: | 30 |
| Matrix: | Air |
| Target concentration: | 1.0 ppm (1.8 mg/m3) |
| Procedure: | Samples are collected on two charcoal tubes in series and desorbed with a benzene/CS2 (99:1) desorption solution. The samples are derivatized with HBr and treated with sodium carbonate. Analysis is done by gas chromatography with an electron capture detector. |
| Recommended air volume and sampling rate: |
1 L and 0.05 L/min |
| Detection limit of the overall procedure: |
13.3 ppb (24.0 µg/m3) |
| Reliable quantitation limit: | 52.2 ppb (94.0 µg/m3) |
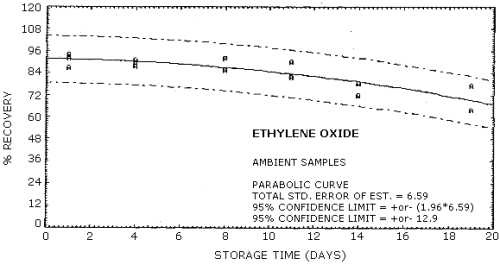
| Standard error of estimate: (Figure 4.6.2.) |
6.59% |
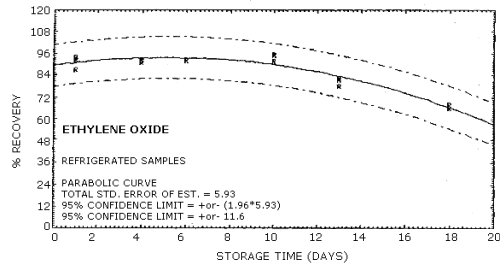
| Special requirements: | Samples must be analyzed within 15 days of sampling date. (Figures 4.6.1. and 4.6.2.) |
| Status of method: | Evaluated method. This method has been subjected to the established evaluation procedures of the Organic Methods Evaluation Branch. |
| Date: August 1981 | Chemist: Wayne D. Potter |
OSHA Analytical Laboratory
Salt Lake City, Utah
1. General Discussion
- 1.1. Background
- 1.1.1. History
Ethylene oxide air samples analyzed at the OSHA Laboratory have normally been collected on activated charcoal and desorbed with carbon disulfide (CS2). The analysis is performed with a gas chromatograph equipped with a flame ionization detector (FID), as described in NIOSH Method S286 (Ref. 5.l). This method is based on a PEL of 50 ppm and has a detection limit of about 1 ppm.
Recent studies (Section 1.1.2.) have prompted the need for a method to detect and quantitate ethylene oxide at very low concentrations.
Several attempts were made to form an ultraviolet (UV) sensitive derivative with ethylene oxide for analysis with HPLC. Among those tested that gave no detectable product were: p-anisidine, methylimidazole, aniline, and 2,3,6-trichlorobenzoic acid. Each was tested with catalysts such as triethylamine, aluminum chloride, methylene chloride and sulfuric acid, but no detectable derivative was produced.
The next derivatization attempt was to react ethylene oxide with
HBr to form
1.1.2. Toxic effects (This section is for information only and should not be taken as the basis for OSHA policy.)
Ethylene oxide has recently been found to cause an increase in incidences of mononuclear cell leukemia and peritoneal mesothelioma in rats. The rats were exposed to ethylene oxide vapor concentrations of 10, 33 and 100 ppm for 6 h a day, 5 days a week, for up to two years. Postmortem examinations were made on all animals that died or were killed when moribund, and at scheduled intervals of 6, 12, 18, 24 and 25 months. Female rats exposed to 100 ppm ethylene oxide had a significant increase in mononuclear cell leukemia and female rats exposed to 33 and 100 ppm also showed a dose response for leukemia incidences. In male rats, the incidences of peritoneal mesothelioma was found to be treatment-related at exposures of 33 and 100 ppm (Ref. 5.3.).
- The ability of a chemical to serve as an alkylating agent and
to cause mutations in a variety of biological test systems is
widely accepted as an indicator that the chemical may have
carcinogenic potential. Both alkylation and mutagenicity have been
demonstrated for ethylene oxide (Ref. 5.3.).
According to NIOSH, epidemiologic investigations for cancer in humans are too limited to be cited as definitive evidence of an excess risk of cancer resulting from ethylene oxide exposure, but their findings should be considered evidence that an excess risk of cancer may exist for those ethylene oxide workers studied. NIOSH recommends that ethylene oxide be regarded in the workplace as a potential occupational carcinogen (Ref. 5.3.).
- Ethylene oxide may be described as a central depressant,
irritant, and protoplasmic poison. Contact with even a dilute
solution may cause irritation and necrosis of the eyes, and
irritation, blistering, edema, and necrosis of the skin. Excessive
exposure to the vapor may cause irritation of the eyes,
respiratory tract and lungs, and central depression. Nausea and
vomiting are usually delayed and may be followed by convulsive
seizure and profound weakness of the extremities, and secondary
infection of the lungs (Ref. 5.2.).
1.1.3. Potential workplace exposure
Industries and activities which use a small portion of the annual production of ethylene oxide, such as health care, are responsible for high occupational exposures to many workers. In 1977, NIOSH estimated 75,000 health care workers in sterilization areas were potentially exposed to ethylene oxide. It is also used in small volumes as a fumigant or sterilant in the following areas: medical products manufacturing, libraries, museums, research laboratories, bookkeeping, spices, seasonings, black walnut meat fumigation, dairy packaging, cosmetics manufacturing, animal and plant quarantine service at ports of entry, transportation vehicles fumigation, clothing, furs, and furniture fumigation. The large volume uses of ethylene oxide such as in the production of ethylene glycol, surface-active agents, glycol ethers and ethanol amines may not involve serious occupational exposure since process equipment generally consists of tightly closed and highly automated systems (Ref. 5.3.).
1.1.4. Physical properties (Refs. 5.4.-5.6.)
| synonyms: | oxirane; dimethylene oxide; oxane; 1,2-epoxy ethane; C2H4O; ETO |
| molecular weight: | 44.06 |
| boiling point: | 10.7°C |
| melting point: | -111°C |
| description: | colorless, flammable gas |
| vapor pressure: | 1095 mm Hg at 20°C |
| odor: | ether-like odor |
| lower explosive limit: | 3.0% (by volume) |
| flash point (TOC): | below 0°F |
| molecular structure: |  |
1.2. Limit defining parameters
- 1.2.1. Detection limit of the analytical procedure
The detection limit of the analytical procedure is 12.0 pg of ethylene oxide per injection. This is the amount of analyte which will give a peak whose height is five times the height of the baseline noise. (Section 4.1.)
1.2.2. Detection limit of the overall procedure
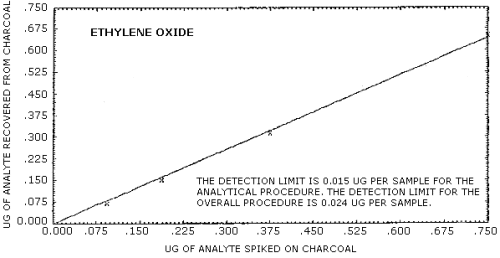
The detection limit of the overall procedure is 24.0 ng of ethylene oxide per sample (13.3 ppb or 24.0 µg/m3). This is the amount of analyte spiked on the sampling device which allows recovery of an amount of analyte equivalent to the detection limit of the analytical procedure (Figure 4.2.1.).
1.2.3. Reliable quantitation limit
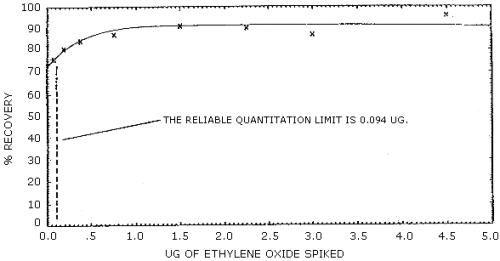
The reliable quantitation limit is 94.0 ng of ethylene oxide per sample (52.2 ppb or 94.0 µg/m3). This is the smallest amount of analyte which can be quantitated within the requirements of 75% recovery and 95% confidence limits of ±25%. (Figure 4.2.2.)
The reliable quantitation limit and detection limits reported in the method are based upon optimization of the instrument for the smallest possible amount of analyte. When the target concentration of an analyte is exceptionally higher than these limits, they may not be attainable at the routine operating parameters.
- 1.2.4. Sensitivity
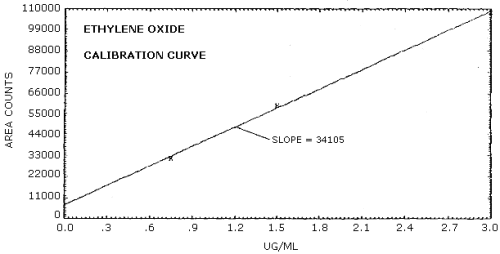
The sensitivity of the analytical procedure over a concentration range representing 0.5 to 2 times the target concentration based on the recommended air volume is 34,105 area units per µg/mL. The sensitivity is determined by the slope of the calibration curve. (Section 4.3.) The sensitivity will vary somewhat with the particular instrument used in the analysis.
1.2.5. Recovery
The recovery of analyte from the collection medium must be 75% or greater. The average recovery from spiked samples over the range of 0.5 to 2 times the target concentration is 88.0%. (Section 4.4.) At lower concentrations the recovery appears to be nonlinear. (Figure 4.2.2.)
1.2.6. Precision (analytical method only)
The pooled coefficient of variation obtained from replicate determination of analytical standards at 0.5, 1 and 2 times the target concentration is 0.036. (Section 4.5.)
1.2.7. Precision (overall procedure)
The overall procedure must provide results at the target
concentration that are ±25% or better at the 95% confidence level.
The precision at the 95% confidence level for the
1.3. Advantages
- 1.3.1. The sampling procedure is convenient.
1.3.2. The analytical procedure is very sensitive and reproducible.
1.3.3. Reanalysis of samples is possible.
1.3.4. Samples are stable for at least 15 days at room temperature.
1.3.5. Interferences are reduced by the longer GC retention time of the new derivative.
1.4. Disadvantages
- 1.4.1. Two tubes in series must be used because of possible
breakthrough.
1.4.2. The precision of the sampling rate may be limited by the reproducibility of the pressure drop across the tubes. The pumps are usually calibrated for one tube only.
1.4.3. The use of benzene as the desorption solvent increases the hazards of analysis because of the potential carcinogenic effects of benzene.
1.4.4. After repeated injections there can be a build-up of residue formed on the electron capture detector which decreases sensitivity.
1.4.5. Recovery from the charcoal tubes appears to be nonlinear at low concentrations.
2. Sampling Procedure
- 2.1. Apparatus
- 2.1.1. A calibrated personal sampling pump whose flow can be
determined with ±5% of the recommended flow.
2.1.2. SKC Lot 120 Charcoal tubes (catalog no. 226-01): glass tube with both ends flame sealed, 70 mm × 6-mm o.d. × 4-mm i.d., containing 2 sections of coconut shell charcoal separated by a 2-mm portion of urethane foam. The adsorbing section contains 100 mg of charcoal, the backup section 50 mg. A 3-mm portion of urethane foam is placed between the outlet end of the tube and the backup section. A plug of silylated glass wool is placed in front of the adsorbing section.
2.2. Reagents
None required
2.3. Sampling technique
- 2.3.1. Immediately before sampling, break the ends of the
charcoal tubes. All tubes must be from the same lot.
2.3.2. Connect two tubes in series to the sampling pump with a short section of flexible tubing. A minimum amount of tubing is used to connect the two sampling tubes together. The tube closer to the pump is used as a backup. This tube should be identified as the backup tube.
2.3.3. The tubes should be placed in a vertical position during sampling to minimize channeling.
2.3.4. Air being sampled should not pass through any hose or tubing before entering the charcoal tubes.
2.3.5. Seal the charcoal tubes with plastic caps immediately after sampling.
2.3.6. With each batch of samples, submit at least one blank tube from the same lot used for samples. This tube should be subjected to exactly the same handling as the samples (break, seal, transport) except that no air is drawn through it.
2.3.7. Transport the samples (and corresponding paperwork) to the lab for analysis.
2.3.8. If bulk samples are submitted for analysis, they should be transported in glass containers with Teflon-lined caps. These samples must be mailed separately from the container used for the charcoal tubes.
2.4. Breakthrough
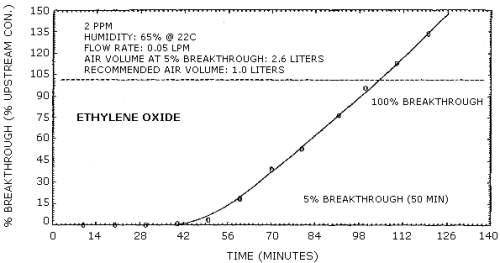
The breakthrough (5% breakthrough) volume for a 3.0 mg/m3 ethylene oxide sample stream at approximately 85% relative humidity, 22°C and 633 mm Hg is 2.6 L sampled at 0.05 L/min. This is equivalent to 7.8 µg of ethylene oxide. Upon saturation of the tube it appeared that the water may be displacing ethylene oxide during sampling as shown in Figure 4.7.
2.5. Desorption efficiency
- 2.5.1. The desorption efficiency, determined from charcoal tubes
spiked by liquid injection, averaged 88.0% from 0.5 to 2.0 times the
target concentration for a 1-L air sample (Section 4.4.). At lower
levels it appears that the desorption efficiency is nonlinear
(Section 4.2.).
2.5.2. The desorption efficiency may vary from one laboratory to another and also from one lot of charcoal to another. Thus, it is necessary to determine the desorption efficiency for a particular lot of charcoal.
2.6. Recommended air volume and sampling rate
- 2.6.1. The recommended air volume is 1.0 L.
2.6.2. The recommended maximum sampling rate is 0.05 L/min.
2.7. Interferences
- 2.7.1. Ethylene glycol and Freon 12 at target concentration
levels did not interfere with the collection of ethylene oxide.
2.7.2. Suspected interferences should be listed on the sample data sheets.
2.7.3. The relative humidity may affect the sampling procedure.
2.8. Safety precautions
- 2.8.1. Attach the sampling equipment to the employee so that it
does not interfere with work performance.
2.8.2. Wear safety glasses when breaking the ends of the sampling tubes.
2.8.3. If possible, place the sampling tubes in a holder so the sharp end is not exposed while sampling.
3. Analytical Procedure
- 3.1. Apparatus
- 3.1.1. Gas chromatograph equipped with a linearized electron
capture detector.
3.1.2. GC column capable of separating the derivative of ethylene
oxide
3.1.3. An electronic integrator or some other suitable method of measuring peak areas.
3.1.4. Two-milliliter vials with Teflon-lined caps.
3.1.5. Gas-tight syringe, 500-µL or other convenient sizes for preparing standards.
3.1.6. Microliter syringes, 10-µL or other convenient sizes for
diluting standards and
3.1.7. Pipets for dispensing the benzene/CS2 (99:1) desorption solution. A Glenco 1-mL dispenser is adequate and convenient.
3.1.8. Volumetric flasks, 5-mL and other convenient sizes for preparing standards.
3.1.9. Disposable Pasteur pipets.
3.2. Reagents
- 3.2.1. Benzene, reagent grade.
3.2.2. Carbon disulfide, reagent grade.
3.2.3. Desorbing reagent, benzene/CS2 (99:1) (v/v).
3.2.4. Ethylene oxide, 99.7% pure.
3.2.5. Hydrobromic acid, 48%, reagent grade.
3.2.6. Sodium carbonate, anhydrous, reagent grade.
3.3. Standard preparation
- 3.3.1. Standards are prepared by injecting pure ethylene oxide
gas into the desorbing reagent.
3.3.2. A range of standards are prepared to make a calibration curve. A concentration of 1.0 µL of ethylene oxide gas per 1 mL of desorbing reagent is equivalent to 1.0 ppm air concentration (all gas volumes at 25°C and 760 mm) for the recommended 1-L air sample.
3.3.3. One drop of HBr per milliliter of standard is added and mixed well.
3.3.4. About 0.15 g of sodium carbonate is carefully added for each drop of HBr. (A small gas-producing reaction will occur).
3.4. Sample preparation
- 3.4.1. The front and back sections of each sample are
transferred to separate 2-mL vials.
3.4.2. Each sample is desorbed with 1.0 mL of desorbing reagent.
3.4.3. The vials are sealed immediately and allowed to desorb for 1 h with occasional shaking.
3.4.4. Desorbing reagent is drawn off the charcoal with a disposable pipet and put into clean 2-mL vials.
3.4.5. One drop of HBr is added to each vial. The vials are resealed and HBr is mixed well with the desorbing reagent.
3.4.6. About 0.15 g of sodium carbonate is carefully added to each vial. The vials are again resealed and mixed well.
3.5. Analysis
- 3.5.1. GC conditions
| nitrogen flow rate: | 10 mL/min |
| injector temperature: | 250°C |
| detector temperature: | 300°C |
| column temperature: | 100°C |
| injection size: | 0.8 µL |
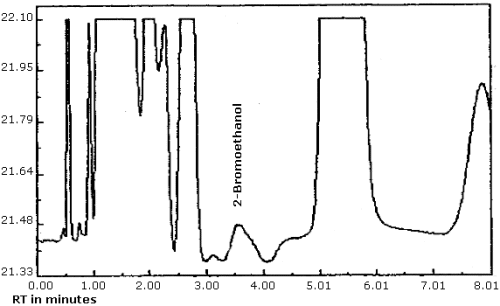
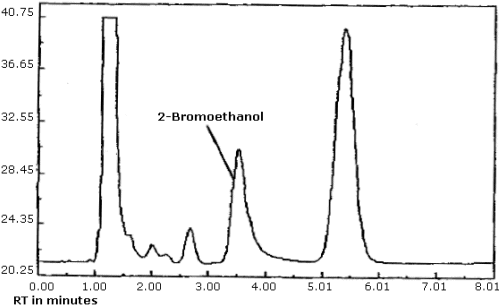
| elution time: | 3.9 min |
| chromatogram: | Figure 4.8. |
3.5.2. Peak areas are measured by an integrator or other suitable means.
3.5.3. A calibration curve is prepared by plotting concentration of ethylene oxide (in µg/mL) versus area units.
3.6. Interferences
- 3.6.1. Any compound having the same retention time as
3.6.2. GC parameters may be changed to circumvent interferences.
3.6.3. There are usually trace contaminants in benzene. These contaminants, however, presented no interference problems.
3.6.4. Retention time data on a single column is not considered proof of chemical identity. Samples over the PEL should be confirmed by GC/MS or other suitable means.
3.7. Calculations
- 3.7.1. The concentration in µg/mL for a sample is determined by
comparing the peak area of the
3.7.2. The amount of analyte in each sample is corrected for desorption efficiency by use of a desorption curve (Figure 4.2.2.).
3.7.3. Analytical results (A) from the two tubes that compose a particular air sample are added together.
3.7.4. The concentration for a sample is calculated by the following equation:
ETO, mg/m3 = (A)(B)/C
| where | A | = | µg/mL |
| B | = | desorption volume in milliliters | |
| C | = | air volume in liters |
3.7.5. To convert mg/m3 to parts per million (ppm) the following relationship is used:
ETO, ppm = (mg/m3)(24.46)/44.05
| where | mg/m3 | = | results from 3.7.4. |
| 24.46 | = | molar volume at 25°C and 760 mm Hg | |
| 44.05 | = | molecular weight of ETO |
3.8. Safety precautions
- 3.8.1. Ethylene oxide and benzene are potential carcinogens and
care must be exercised when working with these compounds.
3.8.2. All work done with the solvents (preparation of standards, desorption of samples, etc.) should be done in a hood.
3.8.3. Avoid skin contact with all of the solvents.
3.8.4. Wear safety glasses at all times.
3.8.5. Avoid skin contact with HBr because it is highly toxic and a strong irritant to eyes and skin.
4. Backup Data
- 4.1. Detection limit
The detection limit was determined by injecting 0.8 µL of a 0.015 µg/mL standard of ethylene oxide into benzene/CS2 (99:1). The detection limit of the analytical procedure is taken to be 12 pg per injection. This is equivalent to 8.3 ppb (15.0 µg/m3) for the recommended air volume. A chromatogram of the analytical detection limit is shown in Figure 4.1.
4.2. Desorption efficiency
Ethylene oxide was spiked onto charcoal tubes and the following recovery data was obtained. The detection limit for the overall procedure is shown in Figure 4.2.1. The recovery curve is shown in Figure 4.2.2.
Desorption Efficiency
|
| ||
| amount spiked (µg) | amount recovered (µg) | % recovery |
|
| ||
| 4.5 3.0 2.25 1.5 1.5 0.75 0.375 0.375 0.1875 0.094 |
4.32 2.61 2.025 1.365 1.38 0.6525 0.315 0.132 0.151 0.070 |
96.0 87.0 90.0 91.0 92.0 87.0 84.0 83.2 80.5 74.5 |
|
| ||
| At lower amounts the recovery appears to be nonlinear. | ||
4.3.Sensitivity
The following data, resulting from the multiple injections of three analytical standards, were used to determine the calibration curve. The calibration curve is shown in Figure 4.3.
Sensitivity Data
|
| |||
| × target conc. µg/mL |
0.5× 0.75 |
1× 1.5 |
2× 3.0 |
|
| |||
| area counts |
30904 30987 32555 32242 31672 |
59567 62914 58578 57173 59558 |
111778 106016 106122 109716 108408 |
|
| |||
4.4. Recovery
The recovery was determined by spiking sets of lot 120 charcoal tubes with ethylene oxide and desorbing them with benzene/CS2 (99:1). Recoveries were determined at 0.5, 1.0, and 2.0 times the target concentration (1 ppm) for the recommended air volume.
Recovery
|
| |||
| × target conc. | 0.5× | 1× | 2× |
|
| |||
| %
recovered (desorption efficiency) |
88.7 83.8 84.2 88.0 88.0 86.5 |
95.0 95.0 91.0 91.0 86.0 85.0 90.5 |
91.7 87.3 86.0 8.30 87.0 |
| weighted average = 88.2 | |||
|
| |||
4.5. Precision of the analytical procedure
The following data was used to determine the precision of the analytical method:
Precision of the Analytical Procedure
|
| |||
| × target conc. µg/mL |
0.5× 0.75 |
1× 1.5 |
2× 3.0 |
|
| |||
| µg/mL found SD CV |
0.7421 0.7441 0.7831 0.7753 0.7612 0.0211 0.0277 |
1.4899 1.5826 1.4628 1.4244 1.4899 0.0674 0.0452 |
3.1184 3.0447 2.9149 2.9185 2.9991 0.0998 0.0333 |
|
| |||
4.6. Storage data
Samples were generated at 1.5 mg/m3 ethylene oxide at 85% relative humidity, 22°C and 633 mm Hg. All samples were taken for 20 min at 0.05 L/min. Four samples were analyzed as soon as possible (1 day later) and fifteen samples were stored at refrigerated (5°C) and fifteen samples were stored at ambient temperature (23°C). These stored samples were analyzed over a period of nineteen days. The results are shown graphically in Figures 4.6.1. and 4.6.2.
Storage Tests
|
| |||||||
| storage time (days) |
%
recovery (refrigerated) |
%
recovery (ambient) | |||||
|
| |||||||
| 1* 4 6 8 10 11 13 14 18 19 |
92.0 92.0 91.7 78.0 66.0 |
87.0 93.0 92.0 95.5 81.4 68.0 |
93.0 91.0 95.7 82.4 |
94.0 91.0 92.0 90.0 78.5 64.0 |
92.0 88.0 86.0 82.0 72.1 77.0 |
89.0 | |
|
| |||||||
| * Results from the first day of storage used in both storage tests. | |||||||
4.7. Breakthrough data
Breakthrough studies were done at 2 ppm (3.6 mg/m3) at approximately 85% relative humidity and 22°C (ambient temperature). Two charcoal tubes were used in series. The backup tube was changed every 10 min and analyzed for breakthrough. The flow rate was 0.050 L/min. The results are shown graphically in Figure 4.7.
Breakthrough Data
|
| ||
| tube no. | time (min) | % breakthrough |
|
| ||
| 1 2 3 4 5 6 7 8 9 10 11 12 |
10 20 30 40 50 60 70 80 90 100 110 120 |
none none none 1.23 3.46 18.71 39.2 53.3 72.0 96.0 113.0 133.9 |
|
| ||
The 5% breakthrough volume (2.6 L) was reached after 52 min of sampling.
5. References
- 5.1. "NIOSH Manual of Analytical Methods", 2nd ed. NIOSH:
Cincinnati, 1977; Method S286.
5.2. Hine, C.H., and Rowe, V.K. In "Industrial Hygiene and Toxicology", 2nd ed.; Patty, F.A., Fassett, D.W., and Irish, D.D., Eds.; Interscience Publishers: New York, 1963; Vol. II, p. 1627.
5.3. "Current Intelligence Bulletin 33: Ethylene Oxide" NIOSH, May 1981.
5.4. "IARC Monographs on the Evaluation of Carcinogenic Risk of Chemicals to Man", International Agency for Research on Cancer: Lyon, 1976; Vol. II, p. 157.
5.5. Sax., N. I. "Dangerous Properties of Industrial Materials", 4th ed.; Van Nostrand Reinhold Company. New York, 1975; p. 741.
5.6. "The Condensed Chemical Dictionary", 9th ed.; Hawley, G.G., ed.; Van Nostrand Reinhold Company, New York, 1977; p. 361.