| VOLATILE NITROSAMINE MIXTURE II |
N-Nitrosomethyl-n-butylamine (NMBA) N-Nitrosoethyl-n-butylamine (NEBA) N-Nitroso-n-propyl-n-butylamine (NPBA) |
| Method no.: | 38 |
| Matrix: | Air |
| Procedure: | Samples are collected using ThermoSorb/N air samplers. The samples are desorbed with a dichloromethane/methanol (75:25)(v/v) solution. Analysis is by gas chromatography and detection with a Thermal Energy Analyzer. |
| Recommended air volume and sampling rate: |
75 L at 1 L/min (0.2 to 2 L/min is permissible) |
| Special requirements: | It is recommended that collected samples be stored in a freezer. |
| Status of method: | A sampling and analytical method that has been subjected to the established procedures of the Organic Methods Evaluation Branch. |
| Date: June 1982 | Chemist: Warren Hendricks |
OSHA Analytical Laboratory
Salt Lake City, Utah
|
| ||||||
| analyte | NMEA | NDiPA | NMBA | NEBA | NPBA | NDAmA |
|
| ||||||
| target
concentration1 µg/m3 ppb reliable quantitation limit µg/m3 ppb standard error of estimate at the target concentration, % (Section 4.7.) |
2.7 0.74 0.13 0.036 7.83 |
2.9 0.55 0.15 0.028 6.48 |
2.5 0.53 0.13 0.027 6.68 |
2.9 0.55 0.15 0.028 7.01 |
2.7 0.45 0.13 0.022 6.7 |
4.0 0.52 0.20 0.026 6.67 |
|
| ||||||
| 1 Air
concentrations are based on a | ||||||
1. General Discussion
- 1.1. Background
- 1.1.1. History
The purpose of this work was to extend previously developed
volatile
Volatile
The commercially available ThermoSorb/N air sampling system is
reported to be free of the many problems associated with sampling
air for
Previous analytical methods for
Gas and liquid chromatographic analytical techniques have greater
application to trace level analysis of
The Thermal Energy Analyzer (TEA) is a highly selective detector
for
This method uses a GC/TEA procedure for the analysis of the component analytes. A HPLC/TEA procedure is also presented for use as a confirmatory technique.
1.1.2. Toxic effects (This section is for information and should not be taken as the basis of OSHA policy).
The effects of acute exposure to each of the analytes were similar. The administration of a lethal dose to rats led to a progressively weakened and emaciated condition frequently with the appearance of jaundice. Death usually occurred within seven days. The autopsy revealed severe centrilobular liver damage with hemorrhaging into the lungs in most cases. The response to a lethal dose was the same for male and female rats (Ref. 5.8.).
Each of the analytes evaluated in this method has a carcinogenic
effect on the rat. There is no evidence that exposure to the
analytes has led to cancer in humans and extrapolation of animal
data to humans is controversial, but experience with similar
A high correlation between carcinogenicity and mutagenicity has been reported (Ref. 5.10.). NDAmA, NMBA, and NPBA were found to be mutagenic on Salmonella typhimurium when incubated with a rat liver activating system (Ref. 5.11.). No information regarding the mutagenicity of NMEA, NDiPA, and NEBA was obtained through a literature search.
A generally accepted theory of
The metabolic activation of a
Detailed information regarding chronic exposure to the analytes is presented in Section 4.9.
1.1.3. Potential workplace exposure
A literature search resulted in no citations regarding occupational exposure to any of the analytes.
Occupational exposure to the analytes is probably the result of the formation of the agent from precursor amines and suitable nitrosating species. The amino group can be primary, secondary or tertiary (Ref. 5.25.). The amine can be free or a portion of a more complex molecule such as a drug or a herbicide. Amines can be nitrosated in air (Ref. 5.41.) or in solution under acidic, neutral or alkaline conditions (Refs. 5.23. and 5.25.). The nitrosation reaction is catalyzed by thiocyanate, halide ions, metal ions, formaldehyde and ozone (Refs. 5.23., 5.25., and 5.31.). Suitable nitrosating species include nitrogen oxides (NO, NO2, N2O4, N2O3), nitrite and nitrous acid (Refs. 5.23. and 5.25.).
Nitrosation can occur as a result of transnitrosation. This is a
chemical reaction in which a
Exposure to the analytes includes the endogenous formation of the
agents in the human gastrointestinal tract. Precursor amines have
been shown to react with nitrite to form the corresponding
The size of the work population that is exposed is unknown. Since amines and suitable nitrosating species are ubiquitous, the number of potential exposures could be large (Refs. 5.3. and 5.25.).
1.1.4. Physical properties
The following data were taken from Refs. 5.8. and 5.26.
|
| ||||
| analyte | NMEA | NDiPA | NEBA | NDAmA |
|
| ||||
| CAS no. mol wt bp, °C (mm Hg) solubility in water, g/100 mL UV absorption data l max, nm log e l max, nm log e |
10595-95-6 88.13 70 (35) 30 230 3.85 335 1.90 |
601-77-4 130.22 96 (28) 194.5 (760) 1.3 232 3.86 343 1.84 |
4549-44-4 130.22 94-96 (14) 1.2 231 3.88 337 1.94 |
13256-06-9 186.34 136 (14) 0.014 234 3.86 349 1.94 |
|
| ||||
- The following data were taken from Refs. 5.27. and 5.28.
|
| ||||
| analyte | NMEA | NDiPA | NEBA | NDAmA |
|
| ||||
| physical appearance density mp, °C |
yellow liquid 0.9448 (18/4) |
yellow1 solid 0.9442 (20/4) 48 |
yellow1 liquid |
yellow1 liquid |
|
| ||||
| 1 personal observation | ||||
- The following data were taken from Refs. 5.26. and 5.37.
|
| ||
| analyte | NMBA | NPBA |
|
| ||
| CAS no. mol wt bp, °C physical appearance |
7068-83-9 116.19 56 (1.5 mm Hg) yellow1 liquid |
25413-64-3 144.25 yellow1 liquid |
|
| ||
| 1 personal observation | ||
synonyms (Ref. 5.26.)
ethylamine,
diisopropylamine,
N-nitrosomethyl-n-butylamine
butylamine,
N-nitrosoethyl-n-butylamine
N-nitroso-n-propyl-n-butylamine
dipentylamine,
structure and molecular formula (Ref. 5.26.).
| NMEA |  |
C3H8N2O |
| NDiPA | 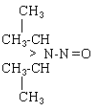 |
C6H14N2O |
| NMBA | 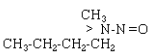 |
C5H12N2O |
| NEBA | 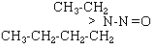 |
C6H14N2O |
| NPBA |  |
C7H16N2O |
| NDAmA | 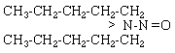 |
C10H22N2O |
1.2. Limit defining parameters (All air concentrations presented
are based on a 75 L air sample volume and a
- 1.2.1. Detection limits of the analytical procedure
The detection limit of the analytical procedure is the mass of analyte per injection which will result in a peak whose height is about five times the amplitude of the baseline noise. (Section 4.1.)
Analytical Procedure (pg/injection)
|
| |||||
| NMEA | NDiPA | NMBA | NEBA | NPBA | NDAmA |
|
| |||||
| 50 | 55 | 47 | 55 | 50 | 75 |
|
| |||||
1.2.2. Detection limits of the overall procedure
The detection limit of the overall procedure is the amount of analyte spiked on the sampling device which allows recovery of an amount of analyte equivalent to the detection limit of the analytical procedure. (Section 4.2.)
|
| ||||||
| analyte | NMEA | NDiPA | NMBA | NEBA | NPBA | NDAmA |
|
| ||||||
| ng/sample µg/m3 ppb |
10 0.13 0.036 |
11 0.15 0.028 |
9.4 0.13 0.027 |
11 0.15 0.028 |
10 0.13 0.022 |
15 0.20 0.026 |
|
| ||||||
1.2.3. Reliable quantitation limits
The reliable quantitation limit is the smallest amount of analyte which can be quantitated within the requirements of at least 75% recovery and a precision (±1.96 SD) of ±25% or better, based on six samples.
The reliable quantitation limits were the same as the detection limits of the overall procedure since the desorption efficiencies were above 75% and the precisions were better than ±25%. (Section 4.2.)
|
| ||||||
| analyte | NMEA | NDiPA | NMBA | NEBA | NPBA | NDAmA |
|
| ||||||
| ng/sample µg/m3 ppb |
10 0.13 0.036 |
11 0.15 0.028 |
9.4 0.13 0.027 |
11 0.15 0.028 |
10 0.13 0.022 |
15 0.20 0.026 |
|
| ||||||
The reliable quantitation limit and detection limits reported in the method are based upon optimization of the instrument for the smallest possible amount of analyte. When the target concentration of an analyte is exceptionally higher than these limits, they may not be attainable at the routine operating parameters.
- 1.2.4. Sensitivity
The sensitivity of the analytical procedure is determined by the slope of the calibration curve over a concentration range from 0.5 to 2 times the target concentration. The sensitivity will vary somewhat with the particular instrument used in the analysis. (Section 4.4.)
(area units per µg/mL)
|
| |||||
| NMEA | NDiPA | NMBA | NEBA | NPBA | NDAmA |
|
| |||||
| 279441 | 204894 | 192333 | 231792 | 174773 | 114093 |
|
| |||||
1.2.5. Recovery
The recovery of analyte from the collection medium during storage must be 75% or greater. The minimum recoveries which are presented below were determined from the regression line of the plotted ambient temperature storage data. (Section 4.7.)
|
| |||||
| NMEA | NDiPA | NMBA | NEBA | NPBA | NDAmA |
|
| |||||
| 93.6 | 97.6 | 93.6 | 93.3 | 90.6 | 93.4 |
|
| |||||
1.2.6. Precision (analytical method only)
The pooled coefficients of variation obtained from replicate determinations of analytical standards at 0.5, 1 and 2 times the target concentrations are presented below. (Section 4.3.)
|
| |||||
| NMEA | NDiPA | NMBA | NEBA | NPBA | NDAmA |
|
| |||||
| 0.013 | 0.018 | 0.020 | 0.026 | 0.017 | 0.025 |
|
| |||||
1.2.7. Precision (overall procedure)
The overall procedure must provide results at the target
concentrations that are ±25% or better at the 95% confidence level.
The precisions at the 95% confidence level for the
|
| |||||
| NMEA | NDiPA | NMBA | NEBA | NPBA | NDAmA |
|
| |||||
| 15.3 | 12.7 | 13.0 | 13.7 | 13.1 | 13.0 |
|
| |||||
1.2.8. Reproducibility
Six
|
| ||||||
| analyte | NMEA | NDiPA | NMBA | NEBA | NPBA | NDAmA |
|
| ||||||
| amount vapor spiked, µg SD, % |
0.20 100.8 6.65 |
0.22 99.2 5.29 |
0.19 100.9 3.99 |
0.22 100.0 2.85 |
0.20 103.4 4.01 |
0.30 104.4 3.45 |
|
| ||||||
1.3. Advantages
- 1.3.1. The sampling and analytical procedures permit the
simultaneous determination of a mixture of analytes.
1.3.2. The sampling and analytical procedures are precise, reliable, safe and convenient.
1.3.3. The sampling procedure is artifact free under the tested conditions. The capacity of the sampling device to prevent artifacts is probably limited.
1.3.4. The air sampling device is commercially available and is
constructed of opaque plastic to prevent
1.3.5. The samples are stable when stored at ambient temperatures for at least 16 days.
1.4. Disadvantages
- 1.4.1. Smaller laboratories may not be able to support the cost
of the recommended sampling and analytical instruments.
1.4.2. The ability of the sampling device to collect and retain the analytes is limited.
2. Sampling Procedure
- 2.1. Apparatus
- 2.1.1. An air sampling pump, the flow of which can be determined
to within ±5% at the recommended air flow rate with the air sampler
in line.
2.1.2. ThermoSorb/N air sampling cartridges, available from Thermo Electron Corporation, Waltham, Mass.
2.1.3. Equipment to calibrate the air flow rate through the sampling device.
2.2. Reagents
None required
2.3. Technique
- 2.3.1. Prior to sampling, remove the ThermoSorb/N air sampling
device from the foil container. Save the container for reuse.
2.3.2. Prior to sampling, remove the red end caps from the inlet and outlet ports. Store the caps on the air sampler in the places that are provided for this use.
2.3.3. Label the air sampler and attach the device to the air
sampling pump with flexible tubing. Adjust the pump to obtain the
proper air flow rate. The recommended rate is 1 L/min but flow rates
of from 0.2 to 2 L/min may be used. If air volumes larger than the
recommended 75 L are required or if large amounts of
2.3.4. Attach the sampling device in the breathing zone of the employee to be monitored. The molded clip is convenient for this purpose.
2.3.5. After sampling for the appropriate time, remove the device and replace the red end caps on the inlet and outlet ports of sampler.
2.3.6. Wrap each sample end to end with official OSHA seals (Form 21). Place the sealed air sampler inside the foil container from Section 2.3.1.
2.3.7. With each set of samples, submit at least one blank sample. The blank should be subjected to the same handling as the sample except that no air is drawn through it.
2.3.8. Place the samples in a freezer if they are to be stored before shipping to the laboratory.
2.3.9. List possible interferences on the sample data sheet.
2.4. Breakthrough
Breakthrough studies were conducted by connecting two samplers in series. The first sampler was vapor spiked at twice the target concentrations with a mixture of the analytes and then air at about 80% relative humidity and 22°C was drawn through the sampling train. The rear sampler was removed and analyzed after an appropriate air volume had been sampled. The rear sampler was replaced with a new cartridge and sampling was continued. The first tube was also analyzed when the study was terminated.
NMEA was the only component of the mixture to be lost from the first sampling device. Two breakthrough studies were conducted and the average 5% breakthrough air volume was 169 L (Section 4.5.). The 5% breakthrough air volume was defined as the air volume at which 5% of the amount of the component vapor spiked on the first tube was found on the second tube. None of the other analytes moved from the front tube after 365 L of air was drawn through the sampling train.
In the interests of a general
2.5. Desorption efficiency
The average desorption efficiency for each of the analytes vapor spiked at 0.5, 1 and 2 times the target concentration on ThermoSorb/N air samplers is presented below (Section 4.6.).
|
| |||||
| NMEA | NDiPA | NMBA | NEBA | NPBA | NDAmA |
|
| |||||
| 101.1 | 100.7 | 100.7 | 99.5 | 99.5 | 95.7 |
|
| |||||
2.6. Recommended air volume and sampling rate
- 2.6.1. The recommended air volume is 75 L.
2.6.2. The recommended air sampling rate is 1 L/min. Studies indicate that flow rates of from 0.2 to 2 L/min may be used if required.
2.7. Interferences (sampling)
- 2.7.1. The commercial ThermoSorb/N
The process by which the ThermoSorb/N tubes prevent artifact
formation is proprietary. The manufacturer states that the device
has an amine trap that removes incoming amines and holds them
unavailable for nitrosation. The sampled air, after passing through
the amine trap, enters a solid sorbent bed where the
The resistance of the ThermoSorb/N air sampler to artifact formation was verified using morpholine (a precursor amine for NMOR) and nitrogen dioxide. Morpholine was selected as the test amine because it has been shown to be easily nitrosated. Nitrogen dioxide in a gas bag, mixed with humid air, has been shown to be an effective nitrosating species. A Teflon gas bag was prepared containing 33 µg/L morpholine in nitrogen and another containing 4.8 ppm v/v NO2 in air at about 75% relative humidity. The morpholine bag was sampled for 50 min at 1 L/min and then the nitrogen dioxide bag was sampled for 50 min at 1 L/min. The total morpholine loaded on the tube was 1650 µg. There was no NMOR formed on the ThermoSorb/N cartridge. The experiment was repeated using a standard Florisil tube. The result showed that 7 µg of NMOR could be formed, as an artifact on the tube, after sampling each bag for 7 min.
2.7.2. It is unknown if there are other interferences with the
collection of
2.8. Safety precautions (sampling)
- 2.8.1. Attach the sampling equipment to the worker so it will
not interfere with work performance or safety.
2.8.2. Follow all safety practices that apply to the work area to be monitored.
3. Analytical Procedure
- 3.1. Apparatus
- 3.1.1. A temperature programmable gas chromatograph (GC).
3.1.2. A high performance liquid chromatographic (HPLC) pump.
3.1.3. A HPLC sample injector.
3.1.4. A Thermal Energy Analyzer (TEA), Thermo Electron Corporation, Waltham, Mass.
3.1.5. A GC column capable of resolving the analytes from each
other and potential interferences. The column used in this work was
3.1.6. A HPLC analytical column capable of resolving the analytes from each other and potential interferences. The column used in this work was a DuPont Zorbax CN (4.6 mm × 25-cm).
3.1.7. The necessary hardware to interface the TEA to the GC and the HPLC apparatus.
3.1.8. An electronic integrator or other suitable means to
measure peak area and record chromatograms. A
3.1.9. Vials,
3.1.10. Syringes, of convenient sizes for sample and standard preparations and injections.
3.1.11. Hypodermic needles, 23 gauge × 1 in., Luer hub.
3.1.12. Volumetric flasks,
3.1.13. Dewar flasks, of convenient sizes for liquid nitrogen.
3.1.14. Microanalytical balance.
3.2. Reagents
- 3.2.1. Analytical standards: NMEA, NDiPA, NMBA, NEBA, NPBA and
NDAmA.
3.2.2. Dichloromethane and methanol, HPLC grade. The sample desorption solution is composed of 75% dichloromethane and 25% methanol by volume.
3.2.3. Isopropanol and
3.2.4. n-Propanol, technical grade.
3.2.5. Nitrogen, liquid.
3.2.6. Helium, GC grade.
3.2.7. Oxygen and air, medical grade.
3.3. Standard preparation
- 3.3.1. Keep the exposure of the standards to light at a minimum
because light will decompose each of the analytes.
3.3.2. Prepare individual stock standards of by diluting known quantities of each component with isopropanol.
3.3.3. Prepare an intermediate standard mixture using known
volumes of each stock standard and diluting the mixture with
|
| |||||
| NMEA | NDiPA | NMBA | NEBA | NPBA | NDAmA |
|
| |||||
| 10 | 11 | 9.4 | 11 | 10 | 15 |
|
| |||||
3.3.4. Prepare fresh working range standards daily by diluting the standard mixture with desorbing solution. Standards at the target concentration were obtained by diluting the above standard mixture 1 to 50 with desorbing solution.
3.3.5. Additional standards at other than the target concentration should be prepared in order to generate the calibration curve.
3.3.6. Store the standards in a freezer using
3.4. Sample preparation
- 3.4.1. Store the samples in a freezer until analysis.
3.4.2. The sample should be received in a foil container. Remove the sample from the container.
3.4.3. Insure that the official OSHA seal (Form 21) is intact and complete.
3.4.4. Check the laboratory sample number against the field identification number to be sure that the sample has been properly identified.
3.4.5. Prepare the desorption solution described in Section 3.2.2. Store the solution in a well sealed, dark bottle.
3.4.6. Label two
3.4.7. Remove the OSHA seal and the red end caps from the sample.
3.4.8. Attach a syringe needle to the male Luer fitting at the inlet port of the air sampler.
3.4.9. Fill a syringe with about 4 mL of the desorbing solution. Attach the syringe to the female Luer fitting located at the outlet end of the air sampler.
3.4.10. Elute the sample by gently forcing the desorption solvent
through the air sampler at approximately 0.5 mL/min. Collect the
first
3.4.11. Because light will decompose
3.4.12. If the eluted samples are not to be analyzed immediately,
transfer the contents of each flask to a separate vial which can be
sealed with a
3.5. Analysis
- 3.5.1. Instrument conditions
- 3.5.1.1. GC conditions
| injector temperature: | 150°C |
| column temperature: | 150 to 220°C at 4°C/min |
| carrier gas flow rate: | 30 mL/min (helium) |
| injection volume: | 5 µL |
The recommended GC column is
3.5.1.2. TEA Conditions
The following conditions apply to the Model
| GC transfer temperature: | 220°C |
| GC pyrolyzer temperature: | 500°C |
| oxygen: | 5 mL/min |
| attenuation: | 4 |
| cold trap temperature: | -130°C |
| (n-propanol and liquid nitrogen) | |
3.5.2. Chromatogram Section 4.8.
3.5.3. Detector response is measured with an electronic integrator or other suitable means.
3.5.4. An external standard procedure is used to prepare a calibration curve using at least 3 standard solutions of different concentrations. The calibration curve is prepared daily. The integrator is calibrated to report results in µg/mL.
3.5.5. Bracket the samples with analytical standards.
3.6. Interferences (analytical)
- 3.6.1.
3.6.2. Because the TEA has been shown to respond to compounds
other than
- 3.6.2.1. HPLC conditions
| column: | DuPont Zorbax CN (4.6 mm × 25 cm) |
| mobile phase: | 94.5% |
| flow rate: | 1.3 mL/min |
| injection volume: | 5 to 25 µL |
The TEA conditions are the same as for the GC/TEA analysis
except that the HPLC pyrolyzer is used at 550°C and the cold trap
is maintained at -80°C with a mixture of water,
3.6.2.2. Chromatogram Figure 4.8.4.
3.6.3. GC and HPLC parameters may be changed to circumvent interferences. Possible interferences are listed on the sample data sheets.
3.6.4. The only unequivocal means of structure designation is by gas chromatography/mass spectrometry with continuous peak matching. It is recommended this procedure be used to confirm samples whenever possible.
3.7. Calculations
- 3.7.1. The integrator value in µg/mL is used for reference only.
More reliable results are obtained by use of a calibration curve.
The detector response, for each standard, is compared to its
equivalent concentration in µg/mL and the best straight line through
the data points is determined by linear regression.
3.7.2. The concentration, in µg/mL, for a particular determination is obtained by comparing its detector response to the calibration curve.
3.7.3. The result obtained from the analysis of each vial or flask is corrected by the appropriate desorption efficiency, and then the corrected results from the "A" and "B" determinations that compose a particular air sample are added together.
3.7.4. The analyte air concentrations for a sample are calculated by the following equation:
concentration in µg/m3 = (C)(D)(1000)/E
| where | C | = | µg/mL from Section 3.7.3. |
| D | = | desorption volume in milliliters (1 mL) | |
| E | = | air volume in liters |
3.7.5. To convert the results from Section 3.7.4. to parts per billion (at 760 mm and 25°C) the following relationship is used:
concentration in ppb = (µg/m3)(24.46)/MW
| where | µg/m3 | = | result from Section 3.7.4. |
| 24.46 | = | molar volume of an ideal gas at 25°C and 760 mm Hg. | |
| MW | = | molecular weight of the analyte, obtained below. |
|
| |||||
| NMEA | NDiPA | NMBA | NEBA | NPBA | NDAmA |
|
| |||||
| 88.13 | 130.22 | 116.19 | 130.22 | 144.25 | 186.34 |
|
| |||||
3.8. Safety precautions (analytical)
- 3.8.1. The analytes are extremely potent animal carcinogens and
utmost care must be exercised when working with these compounds.
3.8.2. Avoid skin contact with liquid nitrogen and the solvents.
3.8.3. Confine the use of solvents to a fume hood.
3.8.4. Wear safety glasses in all laboratory areas.
3.8.5. Check to be sure that the TEA exhaust is connected to a fume hood.
4. Backup Data
- 4.1. Detection limit of the analytical procedure
Figure 4.1. is a chromatogram obtained from a
|
| |||||
| NMEA | NDiPA | NMBA | NEBA | NPBA | NDAmA |
|
| |||||
| 0.010 | 0.011 | 0.0094 | 0.011 | 0.010 | 0.015 |
|
| |||||
Each ThermoSorb/N tube was vapor spiked with the analytes by first injecting a liquid mixture of the analytes on Polar Partition resin. The spiked resin tube was then placed in front of the ThermoSorb/N cartridge and 50 L (1 L/min) of air, at about 80% relative humidity and 22°C, were drawn through the sampling train. The analytes were vaporized from the resin and collected on the ThermoSorb/N tube. The vaporization process was determined to be complete after 25 L of air had passed through the resin.
4.2. The detection limit of the overall procedure and the reliable quantitation limit
The following data were obtained by vapor spiking the analytes on air samplers. The injection size recommended in the analytical procedure (5-µL) was used to determine the detection limit of the overall procedure and the reliable quantitation limit.
Desorption Efficiency at the Detection Limit
|
| ||||||
| analyte ng/sample |
NMEA 10 |
NDiPA 11 |
NMBA 9.4 |
NEBA 11 |
NPBA 10 |
NDAmA 15 |
|
| ||||||
| recovery, % SD 1.96 SD |
95.6 92.7 102.0 91.5 86.9 99.1 94.6 5.45 10.7 |
94.8 88.2 85.0 103.9 97.2 97.5 94.4 6.85 13.4 |
95.2 87.3 83.9 100.0 95.4 85.1 91.2 6.58 12.9 |
94.9 99.9 95.2 98.8 102.1 105.9 99.5 4.20 8.22 |
83.2 95.1 104.5 94.4 102.7 102.6 97.1 8.01 15.7 |
107.2 107.0 98.5 105.1 101.9 100.6 103.4 3.59 7.03 |
|
| ||||||
Since the desorption efficiencies were near 100% and also the precisions were better than ±25%, the detection limits of the overall procedure and the reliable quantitation limits were the same.
4.3. Precision data
The following data were obtained from multiple injections of analytical standards:
Precision at 0.5× Target Concentration
|
| ||||||
| analyte µg/mL |
NMEA 0.10 |
NDiPA 0.11 |
NMBA 0.094 |
NEBA 0.11 |
NPBA 0.10 |
NDAmA 0.15 |
|
| ||||||
| area
counts SD CV |
27065 27193 27690 27758 27851 27511.4 356.612 0.0130 |
22586 22420 22124 22999 22323 22490.4 329.788 0.0147 |
18524 19648 19363 19412 19727 19334.8 478.557 0.0248 |
25698 23684 25931 25189 24922 25084.8 879.157 0.0350 |
18686 17699 18217 18418 18052 18214.4 372.786 0.0205 |
19604 19083 18838 18479 19805 19161.8 544.637 0.0284 |
|
| ||||||
Precision at 1× Target Concentration
|
| ||||||
| analyte µg/mL |
NMEA 0.20 |
NDiPA 0.22 |
NMBA 0.19 |
NEBA 0.22 |
NPBA 0.20 |
NDAmA 0.30 |
|
| ||||||
| area
counts SD CV |
52963 53081 54020 54539 53835 53687.6 661.458 0.0123 |
44183 44391 43683 42981 42851 43617.8 691.924 0.0159 |
38450 37254 36628 38216 37771 37663.8 737.453 0.0196 |
47220 49112 47969 48028 46244 47714.6 1063.36 0.0223 |
34422 34512 33540 34727 34285 34297.2 452.753 0.0132 |
35067 34259 35449 35120 36502 35279.4 811.673 0.0230 |
|
| ||||||
Precision at 2× Target Concentration
|
| ||||||
| analyte µg/mL |
NMEA 0.40 |
NDiPA 0.44 |
NMBA 0.38 |
NEBA 0.44 |
NPBA 0.40 |
NDAmA 0.60 |
|
| ||||||
| area
counts SD CV |
111830 108836 110374 112323 111588 110990.2 1401.72 0.0126 |
87667 89592 87938 92364 91555 89823.2 2104.25 0.0234 |
73717 75536 73669 73607 75048 74315.4 908.889 0.0122 |
1011134 100335 98393 102487 102664 101002.6 1749.05 0.0173 |
70263 69945 68823 71697 71112 70368.0 1106.43 0.0157 |
69269 69635 72803 71145 68670 70304.4 1668.91 0.0237 |
|
| ||||||
The Pooled Coefficients of Variation
|
| |||||
| NMEA | NDiPA | NMBA | NEBA | NPBA | NDAmA |
|
| |||||
| 0.013 | 0.018 | 0.020 | 0.026 | 0.017 | 0.025 |
|
| |||||
4.4. Sensitivity
The data in Tables 4.3.1. - 4.3.3. are presented graphically in Figures 4.4.1. - 4.4.6. The sensitivity of the analytical procedure is determined by the slope of the calibration curve over a concentration range of from 0.5 to 2 times the target concentrations.
4.5. Breakthrough
Two breakthrough studies were conducted at about 80% relative humidity and 22°C. Two ThermoSorb/N tubes were connected in series and the front tube was vapor spiked at 2 times the target concentration with a mixture of the analytes. The rear tube was removed and replaced at intervals and analyzed. NMEA was the only analyte to move from the front to the rear tube. The data is presented in Tables 4.5.1. and 4.5.2. and also in Figures 4.5.1. and 4.5.2.
Breakthrough Study One
|
| ||
| air sampled L |
NMEA recovery, % |
cumulative
NMEA recovery, % |
|
| ||
| 100 150 200 250 300 front tube |
ND 2.8 24.3 36.4 26.0 10.5 |
0.0 2.8 27.1 63.5 89.5 |
|
| ||
Breakthrough Study Two
|
| ||
| air sampled L |
NMEA recovery, % |
cumulative
NMEA recovery, % |
|
| ||
| 123 174 229 275 365 front tube |
ND 2.0 19.1 35.5 43.4 ND |
0.0 2.0 21.1 56.6 100.0 |
|
| ||
4.6. Desorption efficiency
The following data represent the analysis of ThermoSorb/N tubes vapor spiked with the analytes at 0.5, 1, and 2 times the target concentrations.
Desorption Efficiency at 0.5× the Target Concentration
|
| ||||||
| analyte ng/sample |
NMEA 100 |
NDiPA 110 |
NMBA 94 |
NEBA 110 |
NPBA 100 |
NDAmA 150 |
|
| ||||||
| % recovery |
98.4 104.2 97.9 103.6 105.2 98.6 101.3 |
94.1 93.9 102.8 102.2 111.0 94.2 99.7 |
99.0 88.6 103.2 96.6 112.1 97.1 99.4 |
99.4 89.2 97.9 91.6 105.5 96.2 96.6 |
92.8 84.5 98.5 97.9 109.1 100.5 97.2 |
102.3 99.6 104.2 91.0 94.7 101.0 98.8 |
|
| ||||||
Desorption Efficiency at 1× the Target Concentration
|
| ||||||
| analyte ng/sample |
NMEA 200 |
NDiPA 220 |
NMBA 188 |
NEBA 220 |
NPBA 200 |
NDAmA 300 |
|
| ||||||
| % recovery |
92.0 105.3 105.1 100.0 98.7 106.7 101.3 |
92.4 105.4 106.8 100.6 97.5 104.0 101.1 |
90.8 106.2 106.0 104.4 95.4 104.5 101.2 |
92.9 106.9 105.7 102.1 94.4 104.5 101.1 |
96.6 104.0 105.1 100.0 95.4 101.8 100.5 |
95.4 96.3 93.7 90.2 99.6 96.0 95.2 |
|
| ||||||
Desorption Efficiency at 2× the Target Concentration
|
| ||||||
| analyte ng/sample |
NMEA 400 |
NDiPA 440 |
NMBA 376 |
NEBA 440 |
NPBA 400 |
NDAmA 600 |
|
| ||||||
| % recovery |
101.3 102.1 103.2 103.8 98.0 96.5 100.8 |
101.5 103.7 100.8 100.0 104.9 97.8 101.4 |
102.6 102.6 99.8 101.4 103.9 99.3 101.6 |
101.6 103.0 97.8 101.2 102.4 99.5 100.9 |
100.9 102.2 100.1 102.0 104.4 95.2 100.8 |
87.0 92.5 93.6 95.5 94.6 94.8 93.0 |
|
| ||||||
Average Desorption Efficiency at
0.5, 1, and 2 Times the Target Concentration
|
| |||||
| NMEA | NDiPA | NMBA | NEBA | NPBA | NDAmA |
|
| |||||
| 101.1 | 100.7 | 100.7 | 99.5 | 99.5 | 95.7 |
|
| |||||
4.7. Storage data
The data in Tables 4.7.1. and 4.7.2. represent the effects of storage at ambient (21 to 26°C) and reduced (-20°C) temperatures on vapor spiked ThermoSorb/N cartridges. The tubes were vapor spiked at the following levels. The results are not corrected for desorption efficiency. The data are also presented graphically in Figures 4.7.1. to 4.7.12.
|
| |||||
| NMEA | NDiPA | NMBA | NEBA | NPBA | NDAmA |
|
| |||||
| 0.20 | 0.22 | 0.19 | 0.22 | 0.20 | 0.30 |
|
| |||||
Ambient Temperature Storage, % Recovery
|
| |||||||
| day | sample | NMEA | NDiPA | NMBA | NEBA | NPBA | NDAmA |
|
| |||||||
| 0 3 6 9 13 16 |
1 2 3 1 2 3 1 2 3 1 2 3 1 2 3 1 2 3 |
105.8 102.8 105.1 96.1 99.9 104.2 85.9 86.4 92.8 91.8 96.9 91.0 103.8 95.4 92.0 95.5 100.6 93.2 |
105.4 101.5 104.8 102.8 108.5 104.7 94.0 90.2 98.1 100.2 101.9 98.5 101.9 98.3 100.9 98.1 100.8 95.1 |
105.8 100.2 104.0 98.2 105.0 97.1 92.4 87.5 95.9 94.8 95.2 92.9 100.8 98.4 96.0 95.0 97.0 90.2 |
104.2 98.6 104.5 100.4 107.2 104.0 89.7 86.2 95.4 99.3 98.8 98.2 94.2 92.2 97.1 93.4 99.0 91.8 |
104.2 101.0 105.1 96.1 105.0 102.0 89.8 88.2 98.1 97.1 96.9 95.0 91.6 88.4 89.5 93.6 98.5 89.6 |
92.0 97.3 98.4 91.3 102.7 99.4 88.8 85.4 94.4 90.7 93.4 89.7 93.0 93.3 94.3 94.0 100.0 94.4 |
|
| |||||||
Reduced Temperature Storage, % Recovery
|
| |||||||
| day | sample | NMEA | NDiPA | NMBA | NEBA | NPBA | NDAmA |
|
| |||||||
| 0 3 6 9 13 16 |
1 2 3 1 2 3 1 2 3 1 2 3 1 2 3 1 2 3 |
99.0 94.4 91.6 98.0 93.8 99.3 94.2 100.2 97.3 100.6 101.6 100.6 103.1 92.8 97.0 91.1 92.1 93.2 |
100.8 94.9 101.9 100.4 99.8 99.7 100.4 101.7 99.9 103.9 99.5 101.1 104.8 95.2 98.8 95.1 99.1 97.4 |
102.6 94.3 98.4 97.6 98.0 97.7 98.7 97.6 97.1 99.1 97.2 95.8 98.6 91.9 89.8 90.2 94.2 96.9 |
103.5 94.5 98.5 99.5 100.0 98.3 99.3 100.1 98.2 104.4 99.0 97.4 98.7 94.8 94.1 88.8 92.6 94.2 |
103.3 93.6 95.0 103.5 101.5 97.0 97.5 93.6 89.6 101.2 91.4 92.7 101.1 94.5 99.4 91.0 94.2 93.3 |
101.1 91.3 86.8 87.7 98.1 97.8 94.4 96.8 98.3 88.4 91.4 95.1 96.4 88.2 103.4 93.4 93.4 93.2 |
|
| |||||||
4.8. Chromatograms
- 4.8.1. GC/TEA Chromatogram
Figure 4.8.1. is a typical GC/TEA chromatogram obtained by the
injection of a standard mixture containing the analytes. The column
was 1/8-in. ×
4.8.2. GC/TEA Chromatogram
Figure 4.8.2. is a GC/TEA chromatogram obtained from the analysis
of a mixture of
4.8.3. GC/TEA Chromatogram
Figure 4.8.3. is a GC/TEA chromatogram obtained by the analysis
of the same
4.8.4. HPLC/TEA Chromatogram
Figure 4.8.4. is a HPLC/TEA chromatogram obtained by the
injection of the same standard mixture used in 4.8.2. The column was
4.6-mm i.d. ×
4.9. Toxic effects (This data is for information only and should not be taken as the basis of OSHA policy.)
- NMEA: The LD50 for NMEA is 90 mg/kg
following administration by esophageal probe to the rat. In a
chronic effects study, 4 rats received 2 mg/kg and 11 rats 1 mg/kg
daily in the drinking water. Five of the rats in the second group
died without tumors and all the other rats had extensive liver
cancers. One animal had a tumor of the vagina. The mean carcinogenic
doses were 750 and 420 mg/kg and the mean induction periods were 360
and 500 days respectively. The substance was designated a weaker
carcinogen than
NDiPA: The LD50 for NDiPA was 850 mg/kg
following oral administration to the rat. In a chronic effects
study, 25 and 50 mg/kg of NDiPA were administered to 2 groups of
rats daily in the drinking water. The experiment was discontinued
after a total dose of 11 and 14 g/kg had been administered. These
rather large doses produced liver cancer in only 9 of a total of 20
test animals. The mean induction periods were 770 and 430 days for
each group respectively. The weak carcinogenic effect of NDiPA was
attributed to steric hindrance of the enzymatic hydroxylation of the
NMBA: The LD50 for NMBA is 130 mg/kg following oral administration to the rat. The lowest dose which resulted in liver tumors for 50% of the test rats was 600 mg/kg NMBA. The substance was administered by intraperitoneal injection. (Ref. 5.37.). Inhalation of NMBA has been reported to result in incidences of 100% for esophageal tumors and 23% for nasal tumors in rats (Ref. 5.38. and 5.39.).
NEBA: The LD50 for NEBA was 380 mg/kg,
following oral administration to the rat. In a chronic effects
study, five rats received 10 mg/kg and 25 rats 5 mg/kg NEBA daily in
the drinking water. All of the test animals died between the 175th
and the 290th day with extensive cancer of the esophagus. Three
animals also had liver cancer and one a pulmonary cancer. The mean
carcinogenic doses were 1.6 and 0.97 g/kg and the mean induction
periods were 200 and 240 days respectively. In another experiment,
15 rats received 25 mg/kg once per week by intravenous injections.
Five animals developed papillomas and nine cancer of the esophagus.
Six rats had liver tumors, one cancer of the ethmoturbinalia and
another cancer of the pancreas. Seven animals had tumors in multiple
organs. The mean carcinogenic dose was 1.04 g/kg and mean induction
period was 363 days. Bladder cancer which is often the result of
exposure to
NPBA: The daily oral administration of 415 mg NPBA per animal, in the drinking water, for 16 to 19 weeks led to a 100% incidence of liver cancer in the rat. Six of 10 rats also developed esophageal papillomas (Ref. 5.40.).
NDAmA: The LD50 for NDAmA was 3000 mg/kg following subcutaneous administration to the rat. The oral administration of 100 mg/kg NDAmA, daily, in the diet led to liver cancer in 17 of 18 animals; in 5 animals the liver tumors were accompanied by pulmonary metastases. One animal also had lung cancer. The carcinogenic mean dose was 48 g/kg and the mean induction period was 360 days. In another chronic experiment, 500 mg/kg of undiluted NDAmA were administered to rats once per week by subcutaneous injection. Only one animal developed liver cancer but six of ten rats died with lung cancer. The mean carcinogenic dose was 12 g/kg and the mean induction period was 340 days. This experiment was seen as fundamentally important because it demonstrated that pulmonary cancer is not only produced by locally acting inhaled agents but also that it can result from absorbed carcinogens. These experiments also show that the affected organs are not only a function of the chemical and physical properties of the substance but also by the size of the dose and mode of administration (Ref. 5.8.).
Molecular Structure and carcinogenicity: A few generalities regarding the carcinogenic properties of nitrosodialkylamines have been made. Branching of the alkyl group at the alpha carbon tends to decrease carcinogenicity. Increasing molecular weight and polarity seems also to reduce carcinogenic activity. The carcinogenicity of unsymmetrical nitrosamines is often selective toward the esophagus (Ref. 5.9.).
4.10. Reproducibility
Six vapor spiked ThermoSorb/N tubes and a draft copy of this procedure were given to a chemist unassociated with this evaluation. The samples were analyzed after one day of storage at ambient temperature. The recoveries and standard deviations are presented in Table 4.10. The samples were spiked at the target concentrations.
Reproducibility Study
|
| ||||||
| NMEA | NDiPA | NMBA | NEBA | NPBA | NDAmA | |
|
| ||||||
| amount vapor spiked, µg recovery, % SD, % |
0.20 100.0 100.0 110.0 100.0 105.0 90.0 100.8 6.65 |
0.22 100.0 95.5 104.5 100.0 104.5 90.9 99.2 5.29 |
0.19 100.0 94.7 105.3 100.0 105.3 100.0 100.9 3.99 |
0.22 100.0 95.5 104.5 100.0 100.0 100.0 100.0 2.85 |
0.20 100.0 110.0 105.0 105.0 100.5 100.0 103.4 4.01 |
0.30 106.7 100.0 110.0 103.3 103.3 103.3 104.4 3.45 |
|
| ||||||
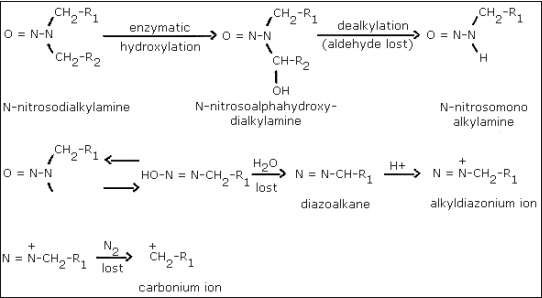
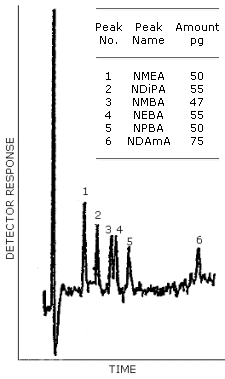
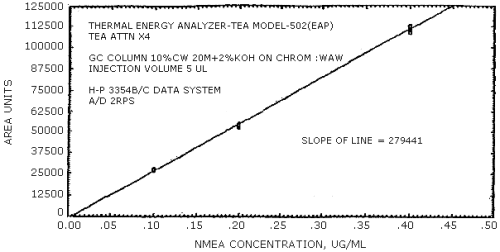
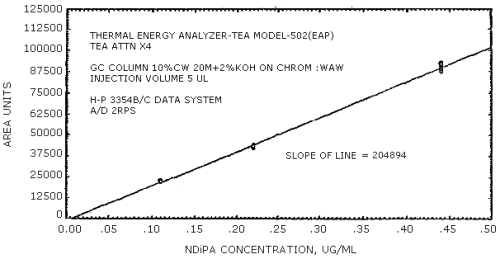
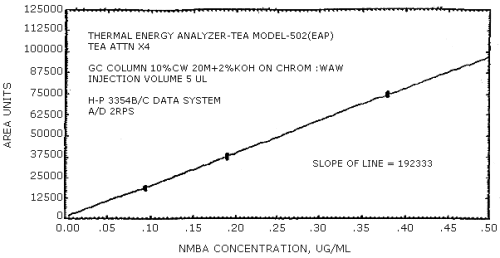
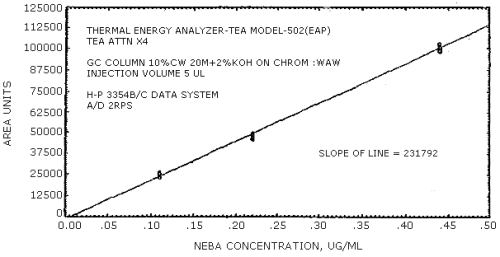
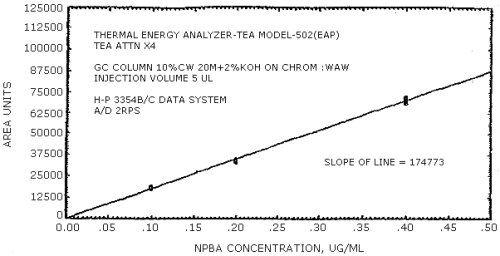
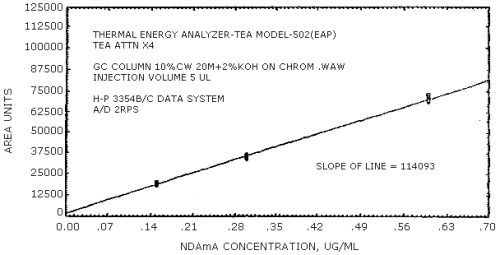
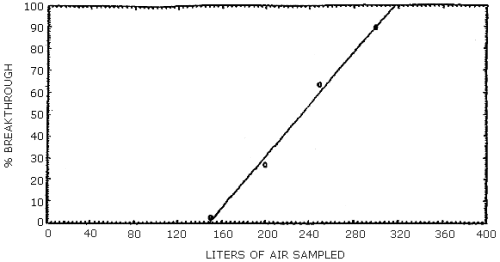
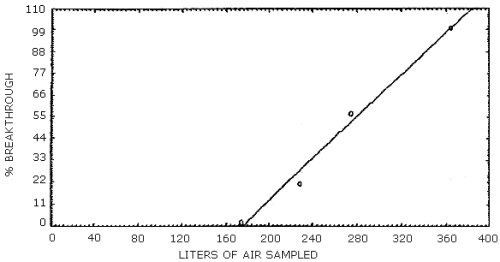
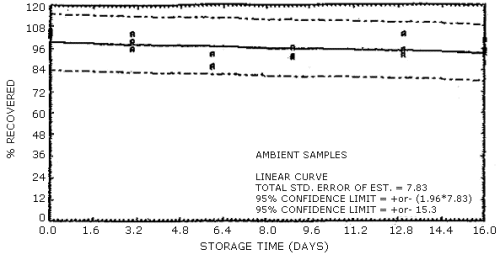
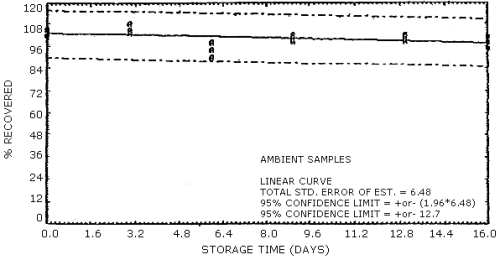
Figure 4.8.1. GC/TRA chromatogram of the analytes with the Carbowax
20M column. The column temperature was programmed from 150 to 220°C at
4°C/min. The injector was set at 150°C and the carrier gas flow rate was
30 mL/min.
Figure 4.8.2. GC/TEA chromatogram of a mixture of
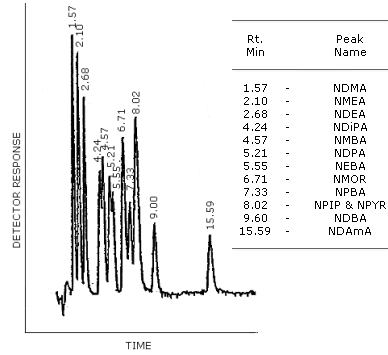
Figure 4.8.3. GG/TEA chromatogram of a mixture of
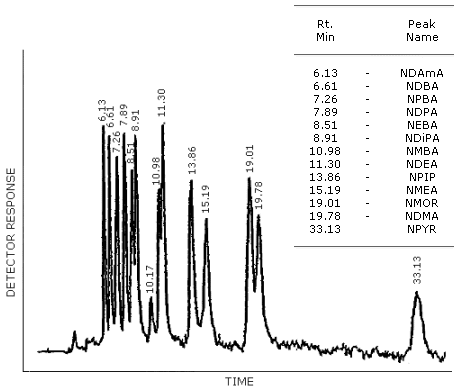
Figure 4.8.4. HPLC/TEA chromatogram of a mixture of
5. References
- 5.1. Hendricks, W. Volatile Nitrosamine Mixture I (Method 27,
Organic Methods Evaluation Branch, OSHA Analytical Laboratory, Salt
Lake City, Utah) Unpublished (2-81).
5.2. Fine, D.H.; Rounbehler, D.P.; Sawicki, E. and Krost, K.
Environ. Science Technol., 11,
5.3. Fine, D.H. Oncology, 37,
5.4. Rounbehler, D.P.; Reisch, J.W.; Coombs, J.R. and Fine, D.H.
Anal. Chem., 52,
5.5. Fisher, R.L.; Rieser, R.W., and Lasoski, B.A. Anal.
Chem., 49,
5.6. Sen, N.P. "Environmental Carcinogens Selected Methods of
Analysis, Volume
5.7. Instruction Manual - Thermal Energy Analyzer, Model 502/LC,
Thermal Electron Corporation, Waltham, Mass. 02145,
5.8. Druckrey, D.; Preussmann, R.; Ivankovic, S. and Schmahl, D.
Z. Krebsforsch, 69,
5.9. Edelman, A.S.; Kraft, P.L.; Rand, W.M., and Wishnok, J.S.
Chem. Biol. Interactions, 31,
5.10. McCann, J.; Choi, E.; Yamasaki, E., and Ames, B.N. Proc.
Nat. Acad. Sci. USA, 72,
5.11. Yahagi, T.; Nagao, M.; Seino, Y.; Matsushima, T.; Sugimura,
T., and Okada, M. Mutation Res., 48,
5.12. Ember, L.R. Chem. Eng. News, 58,
5.13. Rounbehler, D.P.; Krull, I.S.; Goff, E.U.; Mills, K.M.;
Edwards, G.S.; Fine, D.H.; Rheinhold, V.; Morrison, J.; Fagen, J.M.
and Carson, G.A. Fd. Cosmet. Toxicol. 17,
5.14. Fajen, J.M.; Carson, G.A.; Rounbehler, D.P.; Fan, T.Y.; Vita,
R.; Goff, V.E.; Wolf, M.H.; Edwards, G.S.; Fine, D.H.; Reinhold, V.
and Biemann, K. Science, 205,
5.15. Chem. Eng. News, 57, 6, (1979).
5.16. Chem. Eng. News, 57, 18, (1979).
5.17. Brunnemann, K.D.; Yu, L. and Hoffmann, D. Cancer
Research, 37,
5.18. Day, E.W.; West, S.D.; Koenig, D.K. and Powers, F.L. J.
Agric. Food Chem., 27,
5.19. Fiddler, W.; Pensabene, J.W.; Doerr, R.C. and Dooley, C.J.
Fd. Cosmet. Toxicol., 15,
5.20. Spiegelhalder, B.; Eisenbrand, G. and Preussmann, R.
Angew. Chem. Int. Ed. Engl., 17,
5.21. Archer, M.C. and Wishnok, J.S., J. Environ. Sci.
Health, 10 & 11,
5.22. Goff, E.U.; Coombs, J.R. and Fine, D.H. Anal. Chem.,
52,
5.23. Challis, B.C.; Edwards, A.; Hunna, R.R.; Kyrtopoulos, S.A.
and Outram, J.P. "Environmental Aspects of
5.24. March, J. "Advanced Organic Chemistry: Reactions, Mechanisms
and Structure",
5.25. Fine, D.H. "Monitoring Toxic Substances", Schuetzle, D. Ed.,
American Chemical Society Symposium, Series 94: Washington, D.C.,
5.26. Registry of Toxic Effects of Chemical Substances, 1979 Edition. (Lewis, R.J. and Tatken, R.L., Eds.) U.S. Department of Health, Education and Welfare, Public Health Service, Center for Disease Control, National Institute for Occupational Safety and Health, U.S. Government Printing Office, Washington, D.C. (1980).
5.27. "CRC Handbook of Chemistry and Physics", CRC Press: Boca Raton, FL (1979).
5.28. "IARC Monographs on the Evaluation of the Carcinogenic Risk
of Chemicals to Humans, Some
5.29. Wishnok, J.S. and Tannenbaum, S.R. Anal. Chem., 49,
5.30. Lijinsky, W. and Epstein, 5.5. Nature, 225,
5.31. Sander, J.; Schweinsberg, F.; La Bar, J. and Burkle, G. "GANN
Monograph on Cancer Research 17",
5.32. Iqbal, Z.M.; Dahl, K. and Epstein, 5.5. Science, 207,
5.33. Wang, T.; Kakizoe, T.; Dion, P.; Furrer, R.; Varghese, A.J.
and Bruce, W.R. Nature, 276,
5.34. Kakizoe, T.; Wang, T.; Eng, V.W.S.; Furrer, R.; Dion, P. and
Bruce, W.R. Cancer Research, 39,
5.35. "ThermoSorb/N Air
5.36. Lijinsky, W. and Taylor, W. J. Natl. Cancer Inst., 62,
5.37. Heath, D.F. and Magee, P.N. Brit. J. Indur. Med., 19,
5.38. Druckrey, H.; Landschutz, C. and Preussmann, R. Z.
Krebsforsch, 75,
5.39. Druckrey, H. and Landschutz, C. Z. Krebsforsch, 75,
5.40. Okada, M.; Suzuki, E. and Hashimoto, Y. Gann, 67,
5.41. Pitts, J.N.; Grosjean, D.; Cauwenberghe, K.V.; Schmid, J.P.
and Fitz, D.R. Environ. Science Technol., 12,