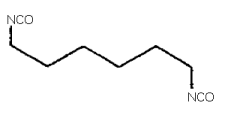
1,6-HEXAMETHYLENE DIISOCYANATE (HDI)
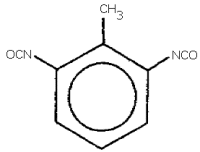
TOLUENE-2,6-DIISOCYANATE
(2,6-TDI)
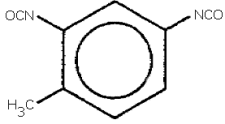
TOLUENE-2,4-DIISOCYANATE (2,4-TDI)
| Method no.: | 42 | ||
| Matrix: | Air | ||
| Procedure: | Samples are collected by drawing a known volume of air through glass fiber filters coated with 0.1 mg of 1-(2-pyridyl)piperazine (1-2PP) which are contained in open-face cassettes. Samples are extracted with 90/10 (v/v) acetonitrile/dimethyl sulfoxide (ACN/DMSO) and analyzed by high performance liquid chromatography (HPLC) using an ultraviolet or fluorescence detector. (The coated filters used in Method 47 for MDI are also acceptable for this procedure. Those filters are coated with 1 mg instead of 0.1 mg of 1-2PP.) | ||
| Recommended air volume and sampling rate: |
15 L at 1 L/min | ||
| Special requirements: | It is recommended that coated glass fiber filters be stored at reduced temperature until used for sampling. | ||
| Status of method: | Evaluated method. This method has been subjected to the established evaluation procedures of the Organic Methods Evaluation Branch. | ||
|
Chemist: Donald Burright | ||
OSHA Analytical Laboratory
Salt Lake City, Utah
|
| |||
| Analyte | HDI | ||
|
| |||
| Target concentration, µg/m3 (ppb): | 140(20) | 140(20) | 1401(20) |
| Detection limit of the overall procedure, µg/m3 (ppb): |
1.6(0.23) |
2.3(0.32) |
1.3(0.17) |
| Reliable quantitation limit, µg/m3 (ppb): |
2.3(0.32) |
2.9(0.43) |
2.5(0.36) |
| Standard error of estimate at target concentration, %: (Section 4.9.) |
7.63 |
7.79 |
6.89 |
|
| |||
| 1 OSHA PEL (Air concentrations are based on 15-L air sample volume.) | |||
1. General Discussion
- 1.1. Background
- 1.1.1. History
Some of the earliest procedures to determine atmospheric
diisocyanate concentrations were developed by Ranta and Marcali
(Ref. 5.1.). Both of these procedures are inconvenient because they
use a bubbler for sampling and their colorimetric analyses are
non-specific. A later sampling procedure uses
p-nitrobenzyl-N-n-propylamine (nitro reagent) in toluene bubblers
(Ref. 5.2.). While this method is specific for diisocyanates, it
still retains the use of the bubbler and nitro reagent which is
unstable when stored for long periods of time, even if it is kept at
reduced temperature. The past couple of years have seen several new
derivatizing reagents being used; they include
1-2PP is a suitable derivatizing reagent, when coated on a glass fiber filter, for several reasons:
- 1) The high boiling liquid is retained on a glass fiber filter
and stability is not a problem.
2) The rapid and exothermic reaction with both aromatic and aliphatic diisocyanates results in derivatization on the filter (Ref. 5.7.).
3) The derivatives have higher molar absorptivities in the UV region than those formed with nitro reagent which allows the extraction volume to be larger without loss of sensitivity (Ref. 5.5.).
This procedure compares favorably when tested side-by-side with
the nitro reagent method by Cummins (Ref. 5.10.) for
Additional work was performed on this procedure to reflect to
change in Title 29 CFR 1910.1000, Table Z-1-A in 1989. The Ceiling
PEL of 0.14 mg/m3 for
1.1.2. Toxic effects (This section is for information only and should not be taken as a basis for OSHA policy.)
Continued inhalation of diisocyanate vapors or mists can cause nausea, headache, coughing, irritation of the nose and throat, shortness of breath and chest discomfort. Massive exposure can cause severe coughing spasms, bronchitis and chemical pneumonitis. Some people can become sensitized to isocyanates and may suffer asthmatic attacks and respiratory distress when subsequently exposed to very low concentrations (Ref. 5.9.). Recent studies have produced conflicting results about the mutagenicity of TDI (Refs. 5.1. and 5.9.). No data has been found to indicate that diisocyanates are carcinogenic or teratogenic (Refs. 5.1. and 5.9.).
1.1.3. Operations where exposure may occur
The manufacture of polyurethane foams, coatings, and elastomers potentially exposes a minimum of 100,000 workers to diisocyanates (Ref. 5.2.). Diisocyanates can be found in paints, insulation, adhesives, automobile bumpers, shoe soles, and hundreds of other applications (Refs. 5.2. and 5.8.). Over 700 million pounds of diisocyanates were produced in 1975 (Ref. 5.2.).
1.1.4. Physical properties
|
| |||
| analyte | HDI | ||
|
| |||
| CAS no.: | 91-08-7 | 822-06-0 | 584-84-9 |
| MW: | 174.16 | 168.20 | 174.16 |
| bp, °C(mm Hg): | 96(1.5) | 213(760) | 251(760) |
| mp, °C: | 8 | -55 | 22 |
| sp gr(75°C): | NA1 | 1.05 | 1.22 |
| vp, mm Hg: | NA1 | 0.05 | 0.025 |
| color: | all colorless to pale yellow | ||
| odor: | all sharp pungent | ||
| flash point(closed cup), °C: | NA1 | 140 | 127 |
| synonyms and structures: | Figure 1.1.4. | ||
|
| |||
| 1 not available | |||
1.2. Limit defining parameters (the analyte air concentrations listed through this method are based on an air volume of 15 L and an extraction volume of 2 mL.)
- 1.2.1. Detection limit of the analytical procedure
The detection limit of the analytical procedure is the mass of analyte per injection which will result in a peak whose height is about 5 times the amplitude of the baseline noise. (Section 4.1.)
|
| |||
| analyte | HDI | ||
|
| |||
| ng/injection | 0.18 | 0.18 | 0.18 |
|
| |||
1.2.2. Detection limit of the overall procedure
The detection limit of the overall procedure is the amount of analyte spiked on the sampling device which allows recovery of an amount of analyte equivalent to the detection limit of the analytical procedure. (Section 4.2.)
of the Overall Procedure
|
| |||
| analyte | HDI | ||
|
| |||
| ng/sample µg/m3 ppb |
24 1.6 0.23 |
33 2.3 0.32 |
19 1.3 0.17 |
|
| |||
1.2.3. Reliable quantitation limits
The reliable quantitation limit is the smallest amount of analyte which can be quantitated within the requirements of at least 75% recovery and a precision (1.96 SD) of ±25% or better. The reliable quantitation limits are higher than the detection limits of the overall procedure to satisfy the precision requirement. (Section 4.3.)
|
| |||
| analyte | HDI | ||
|
| |||
| ng/sample µg/m3 ppb |
34 2.3 0.32 |
44 2.9 0.43 |
39 2.5 0.36 |
|
| |||
The reliable quantitation limit and detection limits reported in the method are based upon optimization of the instrument for the smallest possible amount of analyte. When the target concentration of an analyte is exceptionally higher than these limits, they may not be attainable at the routine operating parameters.
- 1.2.4. Sensitivity
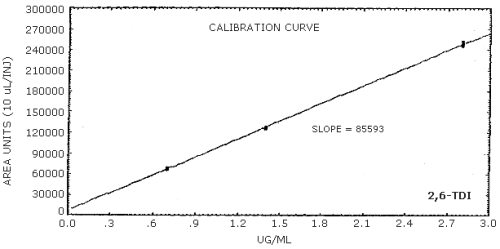
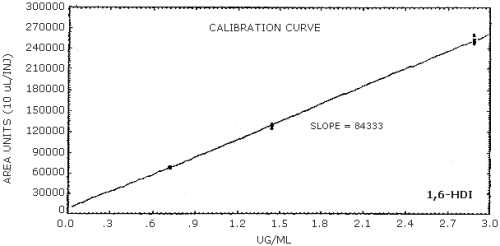
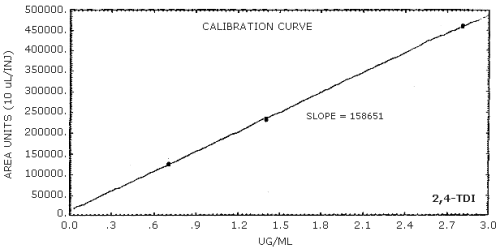
The sensitivity of the analytical procedure is determined by the slope of the calibration curve over a concentration range 0.5 to 2 times the target concentration. The sensitivity will vary somewhat with the particular instrument used in the analysis. (Section 4.5.)
of the Analytical Procedure
|
| |||
| analyte | HDI | ||
|
| |||
| area units per µg/mL |
85600 |
84300 |
159000 |
|
| |||
1.2.5. Recovery
The recoveries of the analytes from samples used in the 18-day storage tests remained above the values presented below. These values are determined from the calculated regression lines of the storage graphs. (Section 4.9.) The recovery of analyte from the collection medium after storage must be 75% or greater.
|
| |||
| temp, °C | HDI | ||
|
| |||
| -25 22 |
86.3 86.4 |
81.1 83.0 |
81.3 80.3 |
|
| |||
1.2.6. Precision (analytical method)
The pooled coefficients of variation obtained from replicate determinations of analytical standards at 0.5, 1 and 2 times the target concentration are presented below. (Section 4.4.)
|
| |||
| HDI | |||
|
| |||
| 0.009 | 0.013 | 0.009 | |
|
| |||
1.2.7. Precision (overall procedure)
The overall procedure must provide results at the target
concentrations that are ±25% or better at the 95% confidence level.
The precisions at the 95% confidence level for the
|
| |||
| HDI | |||
|
| |||
| 14.9 | 15.2 | 13.5 | |
|
| |||
1.2.8. Reproducibility
Five samples, prepared by vapor spiking, and a draft copy of this procedure were given to a chemist unassociated with this evaluation. The samples were analyzed after 6 days of storage at -25°C. The data listed below are corrected for extraction efficiency (Section 4.8.).
|
| |||
| HDI | |||
|
| |||
SD |
101.5 1.6 |
100.4 2.0 |
105.4 2.4 |
|
| |||
1.3. Advantages
- 1.3.1. The sampling and analytical procedures are specific and
sensitive for several diisocyanates employed in industry (Ref.
5.7.).
1.3.2. The collection system is less cumbersome than the use of a bubbler.
1.3.3.
1.4. Disadvantages
The use of peak ratios to confirm low concentrations of diisocyanates is impractical due to the small response at 313 nm.
2. Sampling Procedure
- 2.1. Apparatus
- 2.1.1. Samples are collected by use of a personal sampling pump
that can be calibrated to within ±5% at the recommended flow rate
with the sampling device in line.
2.1.2. A three-piece styrene cassette containing a glass fiber
filter coated with 0.1 mg of
2.1.3. Coated filters are prepared by applying 0.5 mL of a
solution of 0.2 mg/mL
2.1.4. Coated filters should be stored at reduced temperature as a precaution.
2.2. Reagents
None required.
2.3. Sampling technique
- 2.3.1. Remove the inlet cover from the three-piece cassette.
Save the cover for installation after sampling.
2.3.2. Attach the cassette in the breathing zone of the employee to be monitored.
2.3.3. The recommended flow rate is 1 L/min with a recommended total air volume of 15 L. A longer 240-min sampling time is permissible to comply with the 1989 change of the PEL.
2.3.4. After sampling for the appropriate time, remove the sampling device and reinstall the small plug and inlet cover.
2.3.5. Wrap each sample end-to-end with an OSHA Form 21 seal.
2.3.6. With each set of samples, submit at least one blank sample. The blank should be subjected to the same handling as the samples except that no air is drawn through it.
2.3.7. Bulk samples submitted for analysis must be shipped in sealed vials and in a separate container.
2.4. Retention efficiency
- 2.4.1. Experimental design
Due to present laboratory limitations, controlled test atmospheres of diisocyanates cannot effectively be generated. However, the following procedure using a vapor spiking technique was used as an alternative to study analyte retention. This was done to approximate the recommended open-face collection of diisocyanates.
A glass syringe barrel equipped with a Luer taper tip was silanized and silanized glass wool was placed into the syringe. The Luer tip was inserted into the inlet part of a cassette so that the tip was flush with the inside surface of the cassette. The other end of the syringe was attached to a sampling port. The outlet of the cassette was attached to a vacuum pump. A critical orifice between the cassette and the pump maintained a constant 1 L/min flow rate.
Dry air samples were prepared by attaching a dry air source to a manifold inlet. Humid air samples were generated by passing air through water in a controlled temperature water bath. The humidity was monitored in the sampling manifold via a humidity probe. The glass wool was spiked with diisocyanate in methylene chloride. The desired quantity of air was then drawn through the glass wool, at a flow rate of 1 L/min, and onto the coated filter, which was analyzed to determine analyte loss.
2.4.2. Retention results
Humidity affects the ability of a glass fiber filter to retain derivatized diisocyanates. When a sample ten times the target concentration is vapor generated and 200 L of dry air (12% humidity) is drawn through the filter, an average of 95.4% of the diisocyanates is found on the coated filter. Only 1.2% is found on the backup pad.
When higher relative humidity (R.H.) is added to the sampling system, a different result is obtained. After samples were vapor spiked at the target concentration using 20 L of dry air, several known volumes of humid air (78% R.H.) pulled through them. The samples showed increasing losses of diisocyanate derivative with increasing volumes of humid air. (Section 4.6.)
2.5. Extraction efficiency
The average extraction efficiency for each of the analytes spiked at the target concentration on a coated glass fiber filter is presented below. (Section 4.7.)
|
| |||
| HDI | |||
|
| |||
| 91.2 | 93.3 | 90.8 | |
|
| |||
2.6. Recommended air volume and sampling rate
- 2.6.1. The recommended air volume is 15 L for the OSHA Ceiling
PEL.
2.6.2. The recommended air sampling rate is 1 L/min.
2.6.3. To comply with the 1989 PEL changes, the air volume can be increased to 240 L to sample for the OSHA TWA-PEL.
2.7. Interferences (sampling)
Any compound, that could be collected on the glass fiber filter
that could react with the
2.8. Safety precautions (sampling)
The sampling equipment should be attached to the worker in such a manner that it will not interfere with work performance or safety.
3. Analytical Procedure
- 3.1. Apparatus
- 3.1.1. High performance liquid chromatograph equipped with UV
detector, manual or automatic sample injector, and chart recorder.
3.1.2. HPLC stainless steel column capable of separating diisocyanate derivatives. The column employed in this study was a 25-cm × 4.6-mm i.d. Alltech C8 (10 µm) stainless steel column.
3.1.3. An electronic integrator, or some other suitable method of determining peak areas.
3.1.4. Vials, 4-mL with Teflon-lined caps.
3.1.5. Syringes, of convenient sizes for sample and standard preparations and injections.
3.1.6. Volumetric pipettes and flasks for preparation of standards.
3.1.7. Suitable glassware for preparation of diisocyanate urea derivatives.
3.1.8. Micro-analytical balance used to weigh standard preparations.
3.2. Reagents
- 3.2.1. Methylene chloride, hexane, acetonitrile, and dimethyl
sulfoxide, HPLC grade.
3.2.2. Water, HPLC grade. Our laboratory employs a commercially available water filtration system for the preparation of HPLC grade water.
3.2.3. 1-(2-Pyridyl)piperazine, Aldrich, Milwaukee, WI.
3.2.4.
3.2.5. HDI, Aldrich, Milwaukee, WI.
3.2.6.
3.2.7. Ammonium acetate, HPLC grade.
3.2.8. Glacial acetic acid.
3.3. Standard preparation
- 3.3.1. A solution containing 3.5 g of
3.3.2. Preparation of working range standards
A stock standard solution is prepared by dissolving the
diisocyanate derivatives into DMSO. To express the derivative as
free diisocyanate, the amount of
| MW TDI
MW urea |
= | 174.16
500.61 |
= 0.3479 |
Similarly, the conversion factor for HDI urea is 0.3400.
| MW HDI
MW urea |
= | 168.20
494.64 |
= 0.3400 |
All dilutions of the stock solutions are made with acetonitrile to arrive at the working range.
3.4. Sample preparation
- 3.4.1. The styrene cassette is opened and the glass fiber filter
is placed into a 4-mL vial so that the filter is flat against the
inside surface of the vial, not folded or crumpled.
3.4.2. Two milliliters of the extracting solution, 90/10 (v/v) ACN/DMSO, are added.
3.4.3. A cap equipped with a Teflon liner is installed.
3.4.4. The vial is shaken to remove large air bubbles from between the filter and the glass. Let the vial set for 1 h.
- 3.5.1. Reverse phase HPLC conditions
| column: | 25-cm × 4.7-mm i.d. stainless steel column packed with 10-µm Alltech C8 or suitable equivalent. |
| mobile phase: | 0.01 M ammonium acetate in 37.5/ 62.5 ACN/water (v/v) adjusted to pH 6.2 with acetic acid |
| flow rate: | 1 mL/min |
| UV detector: | 254 and 313 nm |
| fluorescence detector: | 240 nm excitation 370 nm emission |
| injection size: | 10-25 µL |
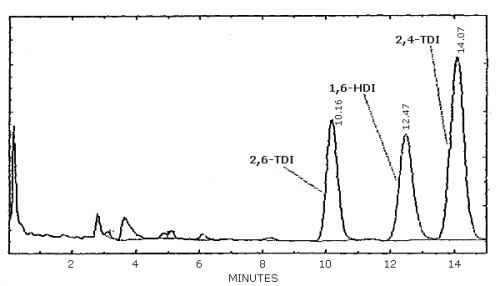
| chromatogram: | Figure 3.5.1. |
3.5.2. An external standard procedure is used to prepare a calibration curve using at least 2 stock solutions from which dilutions are made. The calibration curve is prepared daily. The samples are bracketed with analytical standards.
3.6. Interferences (analytical)
- 3.6.1. Any compound having the same retention time as the
analyte is a possible interference. Benzaldehyde is an interference
for
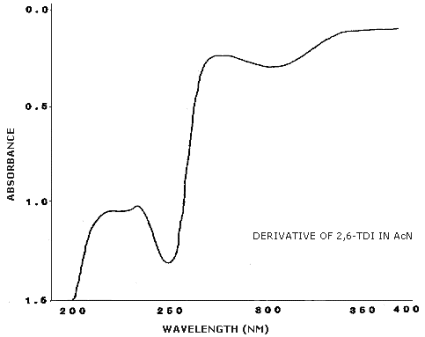
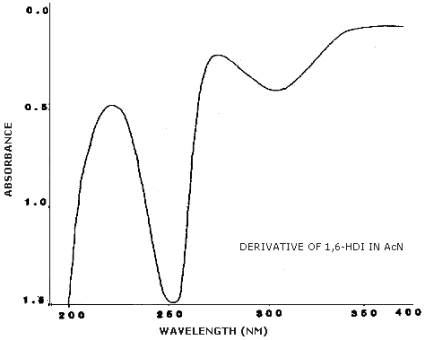
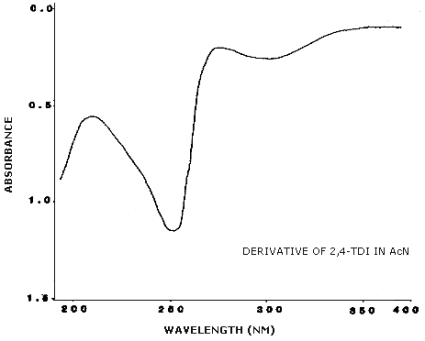
3.6.2. Retention time on a single column is not proof of chemical identity. Analysis by an alternate column system, ratioing of wavelength response, and mass spectrometry are additional means of identity. (UV spectra for diisocyanate derivatives are shown in Figures 4.11.1.-4.11.3.)
3.7. Calculations
The concentration in µg/mL of diisocyanate present in a sample is determined from the area response of the analytes as measured by an electronic integrator or peak heights. Comparison of sample response with a least squares curve fit for standards allows the analyst to determine the concentration of diisocyanate in µg/mL for the sample. Since the sample volume is 2 mL, the results in µg/m3 of air are expressed by the following equation:
- µg/m3 = (µg/mL)(2
mL)/(m3 of air sampled)(Extraction Eff.)
3.8. Safety precautions (analytical)
- 3.8.1. Avoid skin contact with all solvents.
3.8.2. Wear safety glasses at all times.
3.8.3. Avoid exposure to the diisocyanates standards.
4. Backup Data
- 4.1. Detection limit of the analytical procedure
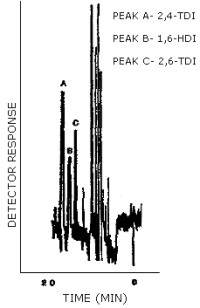
The detection limit of the analytical procedure was 0.18 ng/injection for all three analytes. This amount produced a peak whose height was about 5 times the height of the baseline noise. An injection size of 10 µL was used in the determination of the detection limits for the analytical procedure. (Figure 4.1.)
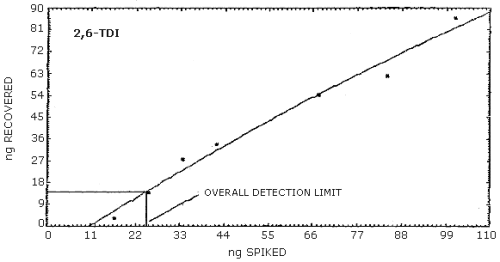
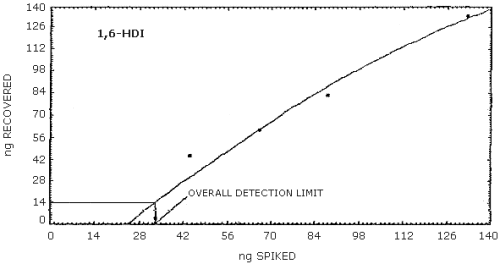
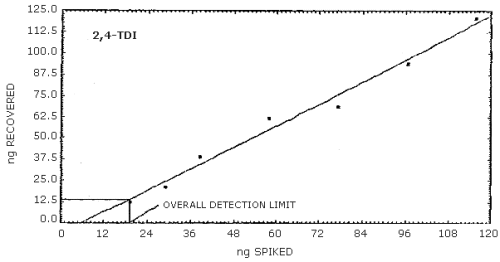
4.2. Detection limit of the overall procedure
- 4.2.1. The following data were obtained by vapor spiking
increasing amounts of the analytes onto sampling devices. An
injection size of 25 µL was used to determine the detection limits
of the overall procedure.
Recoveries Near the Detection Limit
|
| ||||||
| analyte | HDI | |||||
| spiked | found | spiked | found | spiked | found | |
|
| ||||||
| ng/sample |
16.9 25.4 33.8 42.2 67.6 84.5 101.4 |
3.5 14.0 27.8 33.9 54.2 61.9 85.8 |
33.9 44.2 66.2 88.2 132.4 |
3.9 44.9 61.0 82.6 133.7 |
19.3 29.0 38.6 57.9 77.2 96.6 115.8 |
12.6 21.1 39.0 61.8 68.7 93.8 120.8 |
|
| ||||||
4.2.2. Graphical presentation of the above data are shown in
Figures 4.2.1.-4.2.3. The detection limits of the overall procedure
determined from the Figures were 24.4 ng/sample for
4.3. Reliable quantitation limit
The following data were obtained by vapor spiking the analytes onto sampling devices. An injection size of 25 µL was used to determine the reliable quantitation limits.
Extraction Efficiency at the Reliable Quantitation Limit
|
| |||
| analyte ng/sample |
33.8 |
HDI 44.2 |
38.6 |
|
| |||
| %
recovery SD 1.96 SD |
117.4 103.6 103.6 103.6 103.6 103.6 103.6 103.6 105.3 4.9 9.6 |
124.8 114.7 96.8 114.7 114.7 114.7 96.8 96.8 109.3 10.9 21.4 |
82.9 74.6 70.8 82.9 74.6 70.8 82.9 74.6 76.8 5.3 10.4 |
|
| |||
4.4. Sensitivity and precision (analytical method only)
The following data were obtained from multiple injections of analytical standards.
0.5× Target Concentration
|
| |||
| analyte µg/mL |
0.700 |
HDI 0.722 |
0.704 |
|
| |||
| area counts SD CV |
69054 69310 69380 68824 68117 67271 68701 68643 67196 68499.6 811 0.0118 |
70015 70643 70996 70340 68751 68445 69385 69036 68454 69562.8 967 0.0139 |
127935 127591 127408 125457 124953 124032 126054 125588 124185 125911.4 1454 0.0115 |
|
| |||
1× Target Concentration
|
| |||
| analyte µg/mL |
1.400 |
HDI 1.443 |
1.407 |
|
| |||
| area counts SD CV |
127643 126872 126332 127445 126896 126037 127077 126384 127033 126857.7 526 0.0041 |
129539 130474 128313 128379 129521 128186 129882 125878 128370 128726.9 1346 0.0105 |
236004 235664 233651 234337 234274 231355 234258 229449 234524 233723.7 2076 0.0089 |
|
| |||
2× Target Concentration
|
| |||
| analyte µg/mL |
2.800 |
HDI 2.886 |
2.814 |
|
| |||
| area counts SD CV |
249771 244922 248641 246677 246986 245615 252601 248169 248014 247932.9 2309 0.0093 |
252219 249296 259363 252678 252581 250940 247011 249906 251679 251741.4 3396 0.0135 |
459331 457553 458572 461448 461119 457897 463557 460536 459259 459919.1 1925 0.0042 |
|
| |||
Pooled Coefficients of Variation
|
| |||
| HDI | |||
|
| |||
| 0.0090 | 0.0127 | 0.0087 | |
|
| |||
4.5. Sensitivity
The data in Tables 4.4.1.-4.4.3. are presented graphically in Figures 4.4.1.-4.4.3.
4.6. Retention efficiency
- 4.6.1. Two retention studies were conducted, the first at 12%
relative humidity and the second at 78% relative humidity. The
samples were vapor spiked and removed from the sample generator
after a known volume of air had passed through the cassette.
Percent Retention at 10× Target
Concentration with 200-L Air Volume (12% R.H.)
|
| |||
| analyte µg/sample |
27.92 |
HDI 36.44 |
31.84 |
|
| |||
| filter backup filter backup |
96.9 1.0 95.6 0.9 |
97.2 2.0 95.6 1.8 |
94.4 0.8 92.9 0.6 |
|
| |||
Percent Retention
at 1× Target Concentration (78% R.H.)
|
| |||
| air volume, L | HDI | ||
|
| |||
| 5.25 5.25 10.5 15.75 15.75 21.0 21.0 26.25 26.25 31.5 36.75 42.0 42.0 47.25 47.25 52.5 52.5 |
90.8 90.3 91.2 89.7 89.7 89.8 85.1 88.8 84.0 84.5 84.7 86.8 85.9 84.9 84.0 87.4 86.4 |
91.5 88.4 89.8 92.0 86.7 90.0 88.4 93.8 92.4 87.5 89.1 90.3 90.0 84.7 84.4 90.9 87.2 |
85.1 84.0 84.5 82.6 78.9 82.3 77.4 81.7 78.2 77.1 80.0 80.1 79.7 79.2 75.7 80.8 79.4 |
|
| |||
4.6.2. The following data are presented to show that the diisocyanate derivatives, liquid spiked, are retained on the coated glass fiber filter at the recommended air volume.
Percent Retention at 1× Target
Concentration with 20-L Air Volume (80% R.H)
|
| |||
| analyte µg/sample |
2.792 |
HDI 3.644 |
3.184 |
|
| |||
| %
recovery SD |
83.7 93.1 90.1 95.8 89.4 83.6 78.9 88.6 87.9 5.5 |
79.6 81.4 81.1 81.7 80.8 78.9 75.0 82.3 80.1 2.3 |
76.0 88.5 86.3 91.4 86.5 78.9 73.0 82.7 82.4 6.4 |
|
| |||
4.6.3. Ten liters of 80% R.H. air were drawn through a filter to moisten it and then it was vapor spiked with 20 L of dry air to observe the retention of the derivative on the wet filter.
Recoveries From a Wet Filter
|
| |||
| analyte µg/sample |
2.792 |
HDI 3.644 |
3.184 |
|
| |||
| %
recovery SD |
100.5 99.6 97.8 104.2 97.8 100.0 2.6 |
91.6 90.6 88.8 95.9 89.7 91.4 2.8 |
84.4 79.4 77.8 84.4 81.7 81.5 3.0 |
|
| |||
4.6.4. Retention efficiencies at the 1989 TWA-PEL
The following data are presented to show that the diisocyanate derivatives, liquid spiked, are retained on the coated glass fiber filter at the recommended air volume when sampling for the long periods of time needed to determine the TWA exposure. No isocyanate derivative was detected on any of the glass fiber filters placed 0.25 in. behind the coated filters.
Percent Retention at 1× 1989
TWA PEL with 240-L Air Volume (71% R.H)
|
| |||
| analyte µg/sample |
8.412 |
HDI 8.240 |
8.376 |
|
| |||
| %
recovery SD |
103.1 100.3 102.7 98.7 97.1 96.7 99.8 2.7 |
103.5 103.1 102.3 102.6 102.0 102.0 102.6 0.6 |
106.6 106.1 105.9 106.6 105.3 105.4 106.0 0.6 |
|
| |||
4.7. Extraction efficiency
The following data represent the analysis of coated glass fiber filters vapor spiked with the analytes at 0.05 and 1 times the target concentrations.
Extraction Efficiency at 0.05× Target Concentration
|
| |||
| analyte µg/sample |
0.1396 |
HDI 0.1822 |
0.1592 |
|
| |||
| %
recovery |
86.0 92.8 80.2 84.2 69.3 89.4 91.7 95.1 77.4 91.7 103.2 94.6 88.0 |
93.9 90.0 91.7 92.2 91.3 104.9 96.1 91.7 85.6 96.6 107.6 99.6 95.1 |
98.6 102.1 98.5 100.9 100.1 111.3 96.1 95.6 87.7 101.6 108.2 100.0 100.1 |
|
| |||
Extraction Efficiency at 1× Target Concentration
|
| |||
| analyte µg/sample |
2.792 |
HDI 3.644 |
3.184 |
|
| |||
| %
recovery |
92.0 95.6 92.6 92.4 91.8 93.7 88.3 89.6 90.2 90.8 87.7 89.9 91.2 |
92.2 98.9 94.1 92.9 92.9 94.9 94.5 92.8 94.3 91.5 88.6 92.3 93.3 |
93.0 98.1 92.9 94.4 92.0 93.9 85.8 85.5 88.6 90.5 87.5 87.6 90.8 |
|
| |||
4.8. Reproducibility data
Five samples were spiked with the three diisocyanates and had 20 L of humid air drawn through the cassettes. The samples were analyzed by a chemist unassociated with this evaluation after being stored for 6 days at -26°C. The results are corrected for extraction efficiencies.
Reproducibility Results, % Recovery
|
| |||
| analyte µg/sample |
2.792 |
HDI 3.644 |
3.184 |
|
| |||
SD |
102.5 98.8 102.7 102.5 101.2 101.5 1.6 |
101.3 97.0 102.0 101.3 100.6 100.4 2.0 |
106.2 103.4 108.6 106.2 102.6 105.4 2.4 |
|
| |||
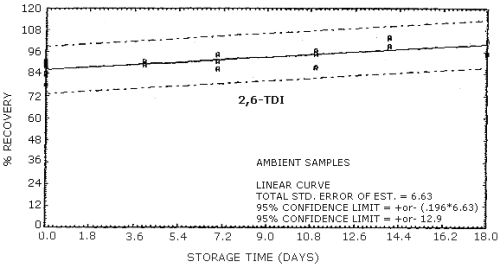
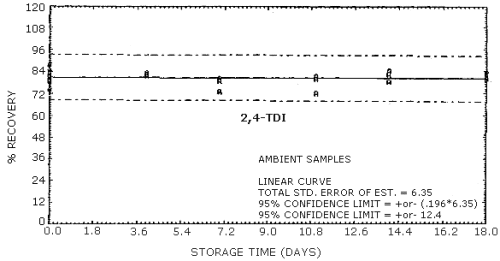
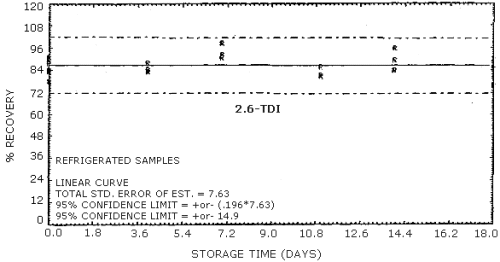
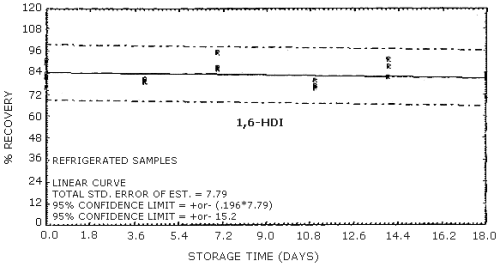
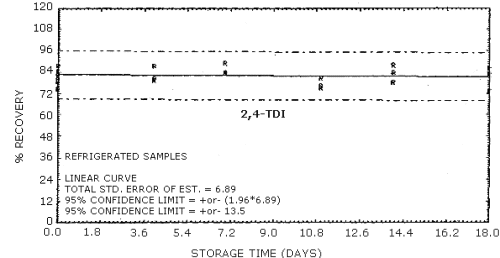
4.9. Storage data
The data in Tables 4.9.2.-4.9.4. show the effects of storage at
ambient (22°C) and reduced
Amount Vapor Spiked, µg/Cassette
|
| |||
| HDI | |||
|
| |||
| 2.792 | 3.644 | 3.184 | |
|
| |||
Storage Tests for
|
| |||||||
| storage time | % recovery | ||||||
| (days) | (refrigerated) | (ambient) | |||||
|
| |||||||
| 0 0 4 7 11 14 18 |
77.8 89.5 84.5 91.0 80.9 89.6 75.7 |
83.5 84.2 88.3 92.4 85.7 83.7 85.2 |
90.9 87.8 83.5 99.0 81.4 94.6 89.7 |
77.8 89.5 89.8 94.6 95.1 103.7 95.3 |
85.5 84.2 89.0 86.5 97.1 99.4 95.5 |
90.9 87.8 91.0 90.5 87.3 103.9 102.0 | |
|
| |||||||
Storage Tests for HDI
|
| |||||||
| storage time | % recovery | ||||||
| (days) | (refrigerated) | (ambient) | |||||
|
| |||||||
| 0 0 4 7 11 14 18 |
75.9 91.2 79.6 86.9 76.4 87.5 71.4 |
82.3 81.9 80.8 86.2 80.0 81.7 81.1 |
89.7 83.8 79.3 95.4 75.4 91.2 83.0 |
75.9 91.2 84.4 82.1 82.2 85.9 81.8 |
82.3 81.9 83.9 75.1 82.5 82.8 84.4 |
89.7 83.8 81.1 81.9 77.7 88.4 85.0 | |
|
| |||||||
Storage Tests for
|
| |||||||
| storage time | % recovery | ||||||
| (days) | (refrigerated) | (ambient) | |||||
|
| |||||||
| 0 0 4 7 11 14 18 |
74.6 87.7 80.5 83.3 75.1 83.9 73.8 |
78.6 81.3 87.8 84.0 80.9 78.4 82.6 |
84.7 82.9 79.5 89.3 76.4 88.4 86.2 |
74.6 87.7 83.6 80.4 81.4 84.2 79.8 |
78.6 81.3 82.7 72.9 79.8 78.4 82.0 |
84.7 82.9 81.7 78.6 72.1 82.3 82.9 | |
|
| |||||||
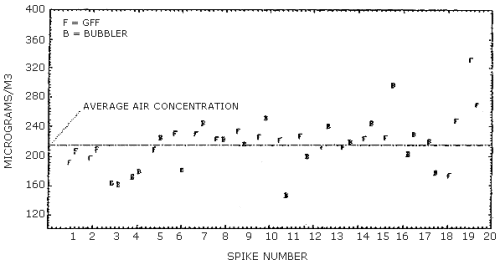
4.10. Side-by-side sampling
A simple experiment was designed which allowed a bubbler containing
nitro reagent and a glass fiber filter coated with
Each sample was analyzed twice and its average was plotted in Figure 4.10. The differences between the bubbler samples and the filter samples appear to be random with no discernible bias between them. The amount of scatter observed in both collection systems was not expected and probably can be attributed to the experimental design. The average line plotted in Figure 4.10. represents the average of all the collected samples and the data is presented below.
Analysis of Side-By-Side Samples, µg/m3
|
| ||||
spike |
average |
collection system |
average |
collection system |
|
| ||||
| 1 2 3 4 5 6 7 8 9 10 11 12 13 14 15 16 17 18 19 20 |
192 197.5 164.5 172.5 208.5 231 230 222.5 233.5 226 221.5 226.5 212 212 223.5 225 202.5 219.5 174 331.5 |
F F B B F F F F F F F F F F F F B B F F |
207 209.5 162.5 179 224.5 181 244.5 223 216 250.5 146.5 199.5 240.5 218.5 245 296.5 230 176.5 248 269 |
F F B B B B B B B B B B B B B B B B F F |
|
| ||||
| F = Glass Fiber Filter with
B = Toluene Bubbler with nitro reagent | ||||
4.11. UV Spectra
Figures 4.11.1.-4.11.3. are the UV spectra of the
| CAS no. | name |
| 2,6-Bis(4-(2-pyridyl)-1-piperazinylcarbamyl) toluene | |
| 72375-27-0 | 1,6-Bis(4-(2-pyridyl)-1-piperazinylcarbamyl) hexane |
| 72375-21-4 | 2,4-Bis(4-(2-pyridyl)-1-piperazinylcarbamyl) toluene |
4.12. Capacity of an 1-mg coated glass fiber filter
A coated glass fiber filter was challenged with a 65/35 mixture of
When the rear filters were analyzed, none of the showed the presence of any TDI. The front filter, which was not changed during the sampling, had collected a total of 66.1 µg of TDI. The other 19.1 µg of TDI was probably lost on the sides of the adapter rings of the cassette. The 66.1-µg collected represents 7.9 times the 1989 TWA-PEL when sampling for 4 h.
A second cassette containing filters was also tested in the same manner and again none of the rear filters contained any isocyanate. In this test the front filter collected 59.4 µg of TDI or 7.1 times the 1989 TWA-PEL.
toluene-2,6-diisocyanate; 2,6-toluene diisocyanate;
2,6-diisocyanato-1-methylbenzene; isocyanic acid, 2-methyl-1,3-phenylene
ester;
1,6-hexamethylene diisocyanate; HDI
toluene-2,4-diisocyanate; 2,4-toluene diisoycanate;
2,4-diisocyanato-1-methylbenzene; isocyanic acid, 4-methyl-1,3-phenylene
ester;
5. References
- 5.1. "Criteria for a Recommended Standard...Occupational Exposure
to Toluene Diisocyanate", Department of Health, Education and Welfare,
National Institute for Occupational Safety and Health: Cincinnati, OH,
1973; HMS 73-11022.
5.2. "Criteria for a Recommended Standard...Occupational Exposure to Diisocyanates"; Department of Health, Education and Welfare, National Institute for Occupational Safety and Health: Cincinnati, OH, 1978; DHEW (NIOSH) Publ. (U.S.), No. 78-215.
5.3. Kormos, L.H.; Sandridge, R.L.; Keller, Anal. Chem. 1981, 53, 1125.
5.4. Sango, C.; Zimerson, E. J. Liq. Chromatogr. 1980, 3, 971.
5.5. Hardy, H.L.; Walker, R.F. Analyst 1979, 104, 890.
5.6. Ellwood, P.A., Hardy, H.L.; Walker, R.F. Analyst 1981, 106, 85.
5.7. Goldberg, P.A.; Walker, R.F.; Ellwood, P.A.; Hardy, H.L. J. Chromatogr. 1981, 212, 93.
5.8. Hosein, H.R.; Farkes, S. Am. Ind. Hyg. Assoc. J. 1981, 42, 663.
5.9. Woolrich, P.F. Am. Ind. Hyg. Assoc. J. 1982, 43, 89.
5.10. Cummins, K., Diisocyanates,