| Method no.: | 50 |
| Matrix: | Air |
| Target concentration: | 1 ppm (1.8 mg/m3) |
| Procedure: | Samples are collected by drawing a known volume of
air through hydrobromic acid-coated charcoal tubes to produce
|
| Recommended air volume and sampling rate: |
24 L at 0.1 L/min |
| Reliable quantitation limit: | 3.0 ppb (5.4 µg/m3) |
| Standard error of estimate: (Figure 4.5.1.) |
6.3% |
| Special requirements: | Sampling tubes currently must be obtained from the laboratory. Collected samples should be stored at reduced temperature to minimize possible storage losses. (Section 4.5.) |
| Status of method: | Evaluated method. This method has been subjected to the established evaluation procedures of the Organic Methods Evaluation Branch. |
| Date: January 1985 | Chemist: Kevin J. Cummins |
OSHA Analytical Laboratory
Salt Lake City, Utah
1. General Discussion
- 1.1. Background
- 1.1.1. History
A number of different methods are currently in use for monitoring
ethylene oxide (EtO) exposures in the workplace. These consist of
several continuous monitoring devices, a number of active sampling
devices, and at least two commercial passive monitoring devices
which are designed specifically for monitoring EtO. The continuous
monitoring devices, despite their ability to instantly measure EtO
exposures, in some cases lack sensitivity (IR monitor), and in other
cases are subject to interferences
Currently the most widely accepted active sampling device for measuring EtO exposures uses a large charcoal tube to trap EtO vapors (Qazi-Ketcham) (Ref. 5.1.). While this sampling method can give reliable results with careful attention to details, the inherent instability of EtO on charcoal can present serious problems. In addition, the method is not as sensitive as may be necessary for measuring sub-ppm exposure levels.
Acid bubblers have also been used to sample EtO in the work environment. Analysis of the resulting ethylene glycol is performed colorimetrically, or more recently, by gas chromatography (Ref. 5.2.). This method is inconvenient to use in the field, and may lack adequate sensitivity to monitor at the new OSHA PEL of 1 ppm (8-h TWA) and at the 0.5 ppm action level (8-h TWA).
Both 3M and DuPont currently manufacture passive monitoring
devices for sampling EtO. These sampling devices do not require a
sampling pump since diffusion principles determine the sampling
rate. Both of these devices require adequate air movement to ensure
that the air around the sampling device is not depleted of EtO. The
3M badge converts EtO to
The current OSHA method uses two standard size charcoal tubes in
series to trap EtO directly on the charcoal surface (Ref. 5.3.).
Because of the low capacity of charcoal for EtO, the recommended air
sample volume is limited to 1 L to avoid breakthrough. Samples are
recommended to be analyzed within 15 days of collection to minimize
sample loss upon storage. This evaluation was undertaken to improve
the sampling capability and to reduce possible storage losses of
EtO. The procedure described in this method uses a hydrobromic
acid-coated sampling tube to collect EtO as its
Efforts to analyze directly for the
The method described in this procedure has been shown in laboratory studies and in field study to provide a reliable, convenient, and accurate means of measuring EtO exposures. This method has been tested under a broad range of conditions in the laboratory. Test atmospheres of 0.1, 0.5, 1.0, and 16 ppm at 70-80% relative humidity and ambient temperature were sampled for 4 h at 0.1 L/min with no breakthrough. Average percent recoveries of 96.8, 94.6, 90.6, and 90.4 respectively were obtained upon same-day analysis, and average percent recoveries of 102, 92.3, 84.6, and 85.6, respectively were obtained upon analysis for the same test atmospheres after storage for a minimum of 2 weeks. (Table 4.9.)
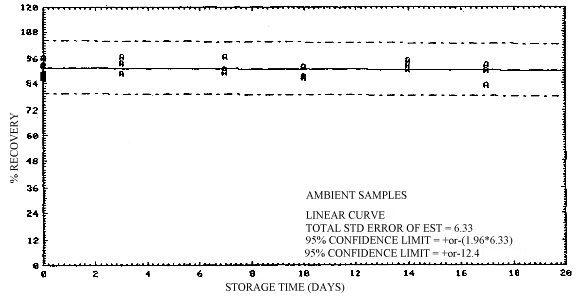
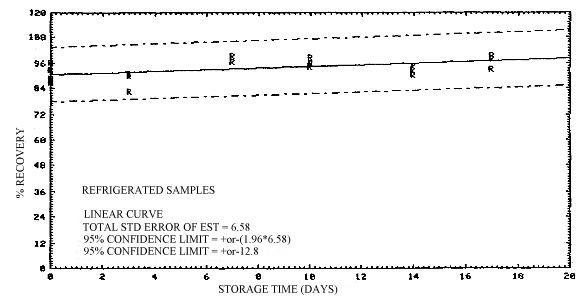
The effects of storage on sample stability appear to be minor for samples collected for 2 h at 0.1 L/min from a 2-ppm test atmosphere at 80% R.H. and ambient temperature. (Figures 4.5.1. and 4.5.2.) The average recovery of 90.2% was obtained upon storage of the samples for 17 days at ambient temperature. (Section 4.5.)
The effects of low humidity on the sampling method were also evaluated. Samples collected at 0.1 L/min from a 2-ppm test atmosphere for 2 h at <5% R.H. and ambient temperature result in high initial recoveries, but demonstrate a statistically valid decrease in recovery with ambient storage. (Table 4.10.) Although this effect is not understood, the recoveries still remain above 75% after storage. This effect was not observed with high humidity as described earlier.
The method can be used to accurately monitor short-term exposures in the workplace. Fifteen-minute and 30-min air samples were collected from a constant 5-ppm test atmosphere (80% R.H. and ambient temperature) at 0.1 L/min. The results were reported in Table 4.11. The high recoveries obtained for these samples indicate that the sampling tube can be used to effectively monitor short-term exposures.
The sampling tube can be used to accurately measure transient, high exposures to EtO which frequently occur in hospital sterilization facilities. Sample tubes which were spiked with 540 µg of pure EtO gas, from a gas-tight syringe over a 30-s time period (equivalent to a 6000 ppm exposure for 30 s) either before or after 24 L of EtO-free air at 80% R.H. and ambient temperature were drawn through them at 0.1 L/min, resulted in average recoveries of 102% and 105% respectively upon analysis the same day.
Field comparison samples were collected at a local hospital using this method and the large charcoal tube method (Qazi-Ketcham). A total of 15 pairs of samples were obtained from four separate inspections by monitoring various areas of the hospital's sterilization facility with side-by-side area samples. No statistical difference in the two methods was observed over a range of exposures of 0.3 to 7 ppm EtO measured at the site. (Section 4.8.)
Based on the results of these laboratory studies, and on the excellent field comparison data, it is anticipated that this sampling and analytical method will offer a reliable, accurate, and convenient means of monitoring EtO exposures in the workplace.
1.1.2. Toxic effects. (This section is for information only and should not be taken as the basis of OSHA policy.)
It has long been recognized that exposure to high levels of EtO can cause a variety of toxic effects including respiratory tract, eye, and skin irritations, nausea, vomiting, central nervous system depression, and even death. Intermittent high exposures are also reported to cause neurological effects such as sensory motor neuropathies and seizures. (Ref. 5.5.)
Recently major concern has focused on the mutagenic and carcinogenic properties exhibited by EtO. Quoting the June 22, 1984 publication of the new EtO standard from the Federal Register:
- The evidence suggests that EtO may cause cancers of the blood
(leukemia) as well as other organs in humans. In addition EtO
exposure causes mutations, increases the rate of chromosomal
aberration and sister chromatid exchange, and causes other
undesirable changes in the DNA of mammalian cells... EtO exposure
has also been associated with an increased risk of spontaneous
abortion among pregnant women and is capable of causing other
adverse reproductive effects in both men and women.
These conclusions are supported by animal experiments involving exposure to EtO by a variety of different routes including: inhalation, sub-cutaneous injection, dermal exposure, and intragastric administration. Additional data are cited in the publication of the new standard to indicate that "virtually every mutagenicity test system applied to EtO has shown the chemical to be mutagenic". Several epidemiological studies are also cited in the Federal Register which indicate that excess cancers may be occurring in the workplace due to EtO exposure. Additional studies involving groups of workers exposed to varying levels of EtO are cited which indicate an EtO dose-dependent increase in sister chromatid exchange rates and increased chromosomal breaks and aberrations. Based on this increasing body of evidence, OSHA has acted to reduce the current permissible exposure limit (PEL) from 50 ppm to 1 ppm for an 8-h time weighted average exposure. (Ref. 5.6.)
1.1.3. Potential workplace exposure
EtO is a major industrial chemical with production volume ranking in the top 25 among all chemicals produced in the United States. Approximately 6.7 billion lbs. of EtO were produced domestically by the most recent estimate. (Ref. 5.6.) Over 99% of the total EtO produced in the United States is used in the manufacture of other products. Approximately 70% of the total is used to produce ethylene glycol. EtO is also used to produce non-ionic surface-active agents (which are used in household detergents), ethanolamines, glycol ethers, di-, tri-, tetra-, polyethylene glycols, and crown ether compounds. (Ref. 5.5)
Although less than 1% of the total EtO produced in the United States is used as a sterilizing agent, this small sector represents the greatest number of potential work exposures. It is estimated that some 62,370 employees in 6,237 hospitals in the U.S. are potentially exposed to EtO. Another 5,000 workers are estimated to be exposed to EtO in its use as a sterilizing agent in the medical products manufacturing industry. (Ref. 5.6.)
A small number of workers in other industries are also potentially exposed to EtO with its use as a fumigant and a sterilizing agent. Spice manufacturing, libraries, museums, dairy packing, and fur treating are some of the industries and work settings in which EtO exposure can occur. (Ref. 5.5.)
1.1.4. Physical properties (Ref. 5.7. unless otherwise noted)
| CAS no.: | 75-21-8 |
| molecular weight: | 44.05 |
| boiling point: | 10.4°C at 760 mm Hg |
| color: | colorless gas |
| density: | 0.8697 g/mL at 20°C |
| molecular formula: | C2H4O |
| vapor pressure: | 1094 mm Hg at 20°C |
| flash point (tag open cup): | <-18°C |
| odor: | ether-like (Ref. 5.3.) |
| explosive limits in air: | upper, 100 % by volume lower, 3 % by volume |
| synonyms (Ref. 5.6.): | dimethylene oxide;
|
1.2 Limit Defining Parameters (The analyte air concentration listed
throughout this method are based on a
- 1.2.1. Detection limit of the analytical procedure
The detection limit of the analytical procedure is 0.29 pg per injection. This is the amount of analyte which will give a measurable response with the amounts of interferences present in a standard. (Section 4.1.)
1.2.2. Detection limit of the overall procedure
The detection limit of the overall procedure is 0.14 µg per sample (3.0 ppb or 5.4 µg/m3). This is the amount of analyte spiked on the sampling device which allows recovery approximately equivalent to the detection limits of the analytical procedure. (Section 4.2.)
1.2.3. Reliable quantitation limit
The reliable quantitation limit is 0.14 µg per sample (3.0 ppb or 5.4 µg/m3). This is the amount of analyte which can be quantitated within the requirements of a recovery of at least 75% and a precision (±1.96 SD) of ±25% or better. (Section 4.2.)
The reliable quantitation limit and detection limits reported in this method are based upon optimization of the instrument for the smallest possible amount of analyte. When the target concentration of an analyte is exceptionally higher than these limits, they may not be attainable at the routine operating parameters.
- 1.2.4. Sensitivity
The sensitivity of the analytical procedure over the
concentration range representing 0.5 to 2 times the target
concentration based on a
1.2.5. Recovery
The recoveries of EtO from samples used in a 17-day storage test when the samples were stored at ambient conditions in the dark was 90.2%. This is the percent recovery at 17 days determined from the linear least squares line from the storage data. (Section 4.5.)
1.2.6. Precision (analytical method only)
The pooled coefficient of variation obtained from replicate determinations of analytical standards at 0.5, 1, and 2 times the target concentration is 0.028. (section 4.3.)
1.2.7. Precision (overall procedure)
The precision at the 95% confidence level for the 17-day storage test is ±13%. (Figure 4.5.2.) This includes an additional ±5% for sampling error. The overall procedure must provide results that are ±25% or better at the 95% confidence level.
1.2.8. Reproducibility
Six samples taken from a controlled test atmosphere and a draft copy of this procedure were given to a chemist unassociated with this evaluation. The samples were analyzed after 14 days of storage at 5°C. The average recovery was 84.8% with a standard deviation of ±2.1%. (Section 4.6.)
1.3 Advantages
- 1.3.1. The acid-coated sampling tube is convenient to use and
requires no special shipping or storage requirements.
1.3.2. This sampling method allows for a much longer sampling period than the current OSHA sampling method. Only one or two acid-coated sample tubes are needed to monitor an 8-h exposure.
1.3.3. The analytical method is more sensitive than direct analysis by flame ionization detection.
1.4. Disadvantages
- 1.4.1. At this time the sampling tubes are not commercially
available and must be obtained from the laboratory.
1.4.2. The analysis involves the formation of a derivative of
2. Sampling Procedure
- 2.1. Apparatus
- 2.1.1. A constant flow personal sampling pump is used which can
be calibrated to within ±5% of the recommended 0.1 L/min flow rate
while the sampling train is in line.
2.1.2. The sampling tube consists of a 6-mm o.d. × 4-mm i.d. × 45-mm glass tube packed with two sections of 24% by weight hydrobromic acid-coated charcoal. These tubes are made from used, clean, sampling tubes, which have had one end of the tube removed. The open end of the tube is fire polished prior to use. The front and back sections contain 100 and 50 mg of the coated charcoal respectively, and are separated and contained within the tube with silanized glass wool plugs.
2.1.3. The coated charcoal is prepared by slowly adding a mixture of 25 mL of hydrobromic acid (48% aqueous, Alfa Products, Thiokol, Inc. Danvers, MA) and 125 mL of acetonitrile (Burdick and Jackson, Inc., Muskegon, MI) to 75 grams of lot 208 petroleum base charcoal (SKC Inc., Eighty-four, Pa) contained in a 500-mL round bottom flask. After allowing the slurry to cool to room temperature, the charcoal is dried by rotary evaporation using gentle heat, and kept overnight under vacuum at ambient temperature. This coated charcoal is stable for at least 4 months when stored in a tightly sealed amber glass jar at room temperature.
2.2. Reagents
None required
2.3. Technique
- 2.3.1. Properly label the sampling tube before sampling.
2.3.2. Attach the sampling tube to the pump using a section of flexible, plastic tubing such that the large, front section of the sample tube is exposed directly to the atmosphere. Do not place any tubing in front of the sampling tube. The sampling tube should be attached in the worker's breathing zone vertically such that it does not impede work performance.
2.3.3. After sampling for the appropriate time, remove the sampling tube from the pump, replace the plastic caps, and seal the tube with an official OSHA seal (Form 21).
2.3.4. Include at least one blank for each sampling set. The blank should be handled in the same manner as the samples with the exception that air is not drawn through it.
2.3.5. List any potential interferences on the sample data sheet.
2.4. Breakthrough
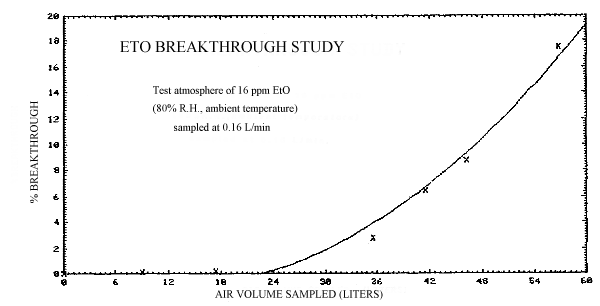
Breakthrough studies were performed by sampling a 16 ppm atmosphere at 70% R.H. and ambient temperature at 0.15 L/min with a sampling tube containing a 100-mg front section of acid-coated charcoal. A second tube, containing a similar section of coated charcoal was attached behind the front section to monitor breakthrough. The backup sections were periodically changed and analyzed while the atmosphere was being sampled until breakthrough was observed. The 5% breakthrough volume, that is, the volume of air sampled that results in a concentration of EtO downstream from the sampling tube that is 5% of the upstream concentration, is approximately 39 L. (Figure 2.4.)
2.5. Desorption efficiency
The average percent recovery of EtO form the acid-coated charcoal
was determined both with pure EtO gas spikes and with liquid spikes of
an equivalent weight of
2.6. Recommended air volume and sampling rate
A
2.7. Interferences
There are no known interferences to the sampling procedure.
2.8. Safety precautions
- 2.8.1. Attach the sampling equipment to the worker in such a
manner that it will not interfere with work performance or safety.
2.8.2. Follow all safety practices that apply to the work area being sampled.
3. Analytical Procedure
- 3.1. Apparatus
- 3.1.1. Gas chromatograph equipped with an electron capture
detector is needed for the analysis of the 2-bromoethyl
heptafluorobutyrate ester. Both a Hewlett-Packard model HP5730A
(Palo Alto, CA) gas chromatograph equipped with an autosampler, and
a Tracor model 222 gas chromatograph (Austin, TX) were used in this
study.
3.1.2. An electronic integrator or other suitable means of measuring detector response is needed. A Hewlett-Packard 3357 data system was used in this study.
3.1.3. Small screw-cap vials fitted with Teflon-coated septa are needed for the preparation of samples and standards. Waters Inc. WISP-type vials (Sun Brokers Inc., Wilmington, NC) were used in this study.
3.1.4. Two repetitive, 1-mL solvent dispensers are used for dispensing DMF and isooctane directly from the solvent bottle. L/I Repipet dispensers (Lab Industries, Berkeley, CA) were used in this study.
3.1.5. Precision 1-, 2-, and 10-µL syringes are needed for preparation of standards, sample and standard transfers, and GC analysis.
3.2. Reagents
- 3.2.1. Dimethylformamide, Burdick and Jackson (Muskegon, MI).
3.2.2. Isooctane, Fisher HPLC Grade (Fairlawn, NJ).
3.2.3. n-Heptafluorobutyrylimidazole (HFBI), Pierce Chemical Co. (Rockford, IL).
3.2.4. High purity water, Milli-Q filtered water Millipore Inc. (Bedford, MA).
3.2.5. 2-Bromoethanol, 98% pure, Eastman-Kodak (Rochester, NY).
3.2.6. Anhydrous magnesium sulfate, Baker reagent-grade (Phillipsburg, NJ).
3.3. Standard preparation
A stock solution of
| 1.7308 grams
10 mL |
× 0.98 × | 44.05
124.97 |
= 59.79 mg/mL as EtO |
(44.05 and 124.97 are the molecular weights of EtO and
3/25 dilution = 7174.5 µg/mL as EtO
1/10 dilution = 717.45 µg/mL
as EtO
Injections of 2.5 and 10 µL of 717.45 µg/mL standard, and injections of 2.5, 5.0, 10, and 15 µL of 7174.5 µg/mL standard into separate vials containing 1 mL of DMF produce the following working standards: 1.79, 7.10, 17.9, 35.7, 71.0, and 106 µg as EtO. These standards, along with the desorbed samples are derivatized as described in Section 3.5.
3.4. Sample preparation
The front acid-coated charcoal section with the glass wool plug, and the back section with the remaining two glass wool plugs are transferred to separate 4-mL screw-cap vials. One milliliter of DMF is then added to each vial and the vials are capped and vigorously shaken for 5-10 s to ensure adequate desorption. The vials are then allowed to sit for a minimum of 5 min prior to derivatization.
3.5. Derivatization of samples and standards
Ten-microliter aliquots of each working standard and of each sample solution in DMF are spiked into separate screw-capped vials containing 1 mL of isooctane and 20 µL of HFBI derivatizing agent. The septum-capped vials are then briefly shaken to ensure mixing, and allowed to sit at room temperature for a minimum of 5 min. One milliliter of filtered water is then pipetted into each vial, and the vials are capped and shaken vigorously for several seconds to ensure complete hydrolysis of the excess derivatizing agent.
3.6. Analysis
- 3.6.1. Analysis of the heptafluorobutyrate ester of
3.6.2. Gas chromatographic conditions are listed below:
| Manual GC (Tracor 222) | |
| column: | 6-ft × 2-mm i.d., glass column packed with 10% SP 1000 on 80/100 Supelcoport (Supelco, Inc., Bellefonte, PA) |
| carrier gas: | argon/methane (95/5) |
| flow rate: | 15 mL/min |
| purge rate: | 25 mL/min |
| inlet/oven/ | |
| detector temp: | 260/85/305 (°C) |
| injection volume: | 2 µL |
| retention time: | 6.0 min |
| Automated GC (HP 5730A) | |
| column: | 10-ft × 1/8-in o.d. stainless steel column packed with 10% SP 1000 on 80/100 Supelcoport |
| carrier gas: | argon/methane (95/5) |
| flow rate: | 20 mL/min |
| inlet/oven/ | |
| detector temp: | 200/100/300 (°C) |
| injection volume: | 0.4 µL |
| retention time: | 7.2. min |
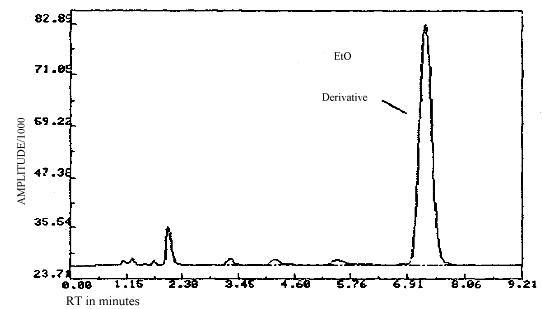
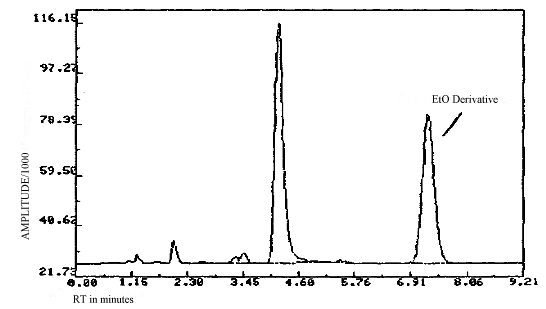
3.6.3. Chromatograms of standard and of an actual field sample are shown in figures 3.6.1. and 3.6.2.
3.6.4. Both the front and back sections of all samples are
analyzed to ensure that no sample breakthrough has occurred. In the
event that a number of samples exceed the range of the working
standards prepared for the analysis, it is advisable to prepare
additional standards in order to ensure that all sample responses
fall within the range of the standard curve. For an occasional high
sample result, dilution of the original sample with DMF and
rederivatization is an appropriate means of analyzing the sample.
3.7. Interferences
No significant interferences to this analysis have bee observed during the course of this study. Methanol, ethanol, n-propanol, 2-chloroethanol, ethylene glycol, and n-butanol, all of which form esters with HFBI, and are chromatographed under the existing conditions, are not interferences. In the event that an interference is observed, selection of alternative GC conditions will be necessary. Confirmation of the derivative by GC/MS is a highly use full means of compound identification.
3.8. Calculations
- 3.8.1. A calibration curve is prepared by plotting µg of EtO per
sample versus area response. A least squares fit of a parabolic
curve through zero was used to obtain the best fit of the data since
the ECD response was not entirely linear.
3.8.2. The amount of EtO found on both the front and back sections of the sample tube are added together and the resulting air concentration is reported in ppm (at 760 mm Hg, 25°C) using the following formula:
| ppm = | µg EtO/sample
L of air sampled |
× | 24.46
44.05 |
| where | 24.46 is the molar volume at 760 mm and
25°C. 44.05 is the molecular weight of EtO. |
3.9. Safety precautions
- 3.9.1. Minimize exposure to all reagents and solvents by
performing all sample and standard preparations in a well-ventilated
hood.
3.9.2. Avoid skin contact with all solvents and reagents.
3.9.3. Wear safety glasses in the laboratory at all times.
4. Backup Data (All data reported in this section were determined using the HP 5730A gas chromatograph equipped with an autosampler.)
- 4.1. Detection limit of the analytical procedure
The detection limit for the analytical procedure is 0.29 pg per
injection. This is based on a
4.2. Reliable quatitation limit and detection limit of the overall procedure
The reliable quantitation limit for this method is 0.14 µg per
sampler or 3.0 ppb based on a
Reliable Quantitation Limit
|
| |||
| % recovery | statistics | ||
|
| |||
| 94.8 98.6 98.6 104.0 104.0 100.0 |
SD 1.96 SD |
= = = |
100.0 3.7 7.25 |
|
| |||
4.3. Precision of the analytical method
The pooled coefficient of variation for EtO is 0.028 over a range of 0.5 to 2.0 times the target concentration of 1 ppm. This value was determined from six injections each of three standards which correspond to 17.89, 35.69, and 71.03 µg or EtO per sample respectively.
Precision of the Analytical Method
|
| |||
| × target conc. µg/sample |
0.5× 17.89 |
1× 35.69 |
2× 71.03 |
|
| |||
| area counts SD CV |
171863 177031 176889 176924 163554 163743 171667 6516 0.0380 |
384974 377399 371456 369710 394991 393891 382070 10976 0.0287 |
734904 732039 730219 744751 748800 752568 740547 9393 0.0127 |
|
| |||
4.4. Sensitivity
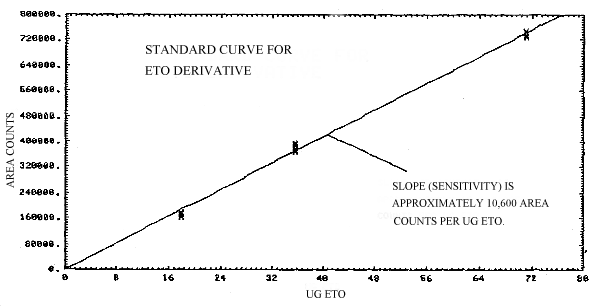
The slope of the calibration curve over the range of 0.5 to 2.0 times the target concentration for the analysis represents the sensitivity for the method. The ECD response is approximately linear in this region and the slope of the line is approximately 10,600 area counts per µg EtO per standard (Figure 4.4.).
4.5. Storage
Storage of sample sets over a 17-day period was performed at both ambient and refrigerated temperatures. The samples were collected by sampling a 2-ppm test atmosphere at 80% R.H. and ambient temperature for 2 h at 0.1 L/min. This sample load is equivalent to a 1 ppm, 4-h exposure. A total of 36 samples were generated in this study. Eighteen of the samples were collected on one day, and the remaining 18 samples were collected three days later.
All of the samples generated in this study, with the exception of six samples generated on the second generation day which were analyzed without storage, were randomly split into equal sized groups and stored either at ambient conditions in the dark, or at 5°C in a refrigerator. Twelve of the samples were analyzed on the second generation day and these include three samples each from ambient and refrigerated storage along with six of the samples generated that same day. The remaining 24 samples were analyzed in groups of 12 at one week intervals over the next two weeks. Each group of samples consisted of three samples each from ambient and refrigerted storage prepated on the two different generation days.
The results of this study are presented in Table 4.5. and in Figures 4.5.1. and 4.5.2. A slight decrease in recovery is observed upon storage, although recoveries remain above 90% through the 17 days stored. It is recommended that samples be stored at reduced temperature following sampling to minimize any possible losses. Shipment of samples on dry ice, or other precautionary measures, is not considered necessary for the samples.
Storage Tests
|
| |||||||
| storage time | % recovery | ||||||
| (days) | (ambient) | (refrigerated) | |||||
|
| |||||||
| 0 0 3 7 10 14 17 |
92.8 87.3 96.9 89.5 86.5 90.7 90.2 |
89.2 86.9 89.1 97.0 87.5 95.1 82.9 |
96.6 ---- 93.9 91.1 92.0 92.9 92.9 |
92.8 87.3 91.3 99.6 94.5 90.7 93.2 |
89.2 86.9 82.6 97.1 98.7 95.1 99.7 |
96.6 ---- 90.0 99.5 96.2 92.9 98.1 | |
|
| |||||||
4.6. Reproducibility
Six sample tubes were each spiked with a stock solution of
Reproducibility
|
| |||
| % recovery | statistics | ||
|
| |||
| 57.51 84.8 84.8 87.8 81.7 84.8 |
SD |
= = |
84.8 2.1 |
|
| |||
| 1 not used in average | |||
4.7. Desorption efficiency
- 4.7.1. The percent recovery of
Desorption Efficiency
of 2-Bromoethanol on Acid-Coated Charcoal1
|
| ||
| Equivalent weight
of EtO spiked (µg) |
% Recovery ± 1 SD |
Relative SD |
|
| ||
| 18.0 35.9 71.8 |
101.3 ±6.2 100.6 ±3.1 97.4 ±2.5 |
6.1 2.5 2.6 |
|
| ||
| 1 six samples per data point | ||
4.7.2. The desorption efficiency of coated charcoal was also
determined by spiking three groups of six samples with either 12.5,
25.0, or 50 µL of pure EtO gas (Union Carbide, Corp., Linde
Division, N.Y., NY). The samples were spiked while laboratory air
was being drawn through the tubes at 0.1 L/min. Controls were
prepared by spiking identical volumes of EtO gas into sample vials
containing 1 mL of a 1.5% HBr solution in DMF. Under the prevailing
atmospheric conditions, these volumes of EtO corresponded to 19.44,
38.74, and 77.31 µg of EtO respectively. Theses amounts correspond
approximately to 0.5 to 2 times the PEL concentration for a
Desorption Efficiency
of EtO from Gas-Spiked Charcoal Tubes
|
| |||
| no. of samples |
amount
spiked (µg) |
% recovery ± 1 SD |
% recovery (rel. to controls) |
|
| |||
| 5 3 (controls) 6 2 (controls) 6 3 (controls) |
19.44 " " 38.74 " " 77.31 " " |
92.9 ±3.6 102.7 ±4.4 92.4 ±1.1 99.9 ---- 100.1 ±3.7 104.0 ±1.7 |
90.5 ---- 92.5 ---- 96.9 ---- |
|
| |||
4.8. Field comparison data
Side-by-side area samples were collected by Ed Zimowski of the OSHA Health Response Team at a local hospital sterilization facility using this method and the large charcoal sampling tube method (Qazi-Kethcham). A total of 15 pairs of samples were obtained from four separate inspections by monitoring different areas of the hospital's sterilization facility. The sampling times varied from 4 to 7.5 h for each comparison sample. The sampling rate for both sampling tubes was about 0.05 L/min. Two large charcoal tubes were used during each sampling period and the time-weighted average for the two compared with the acid-coated tube result. The large charcoal tubes were kept on dry ice after sampling and stored in a freezer prior to analysis at the laboratory. The acid-coated tubes were kept at ambient conditions overnight and then stored in a freezer upon receipt at the laboratory the next day. Analysis of the large charcoal sampling tubes was performed by Carl Elskamp of the Methods Evaluation Group. All of the samples were analyzed within three days of sample collection. The results for each pair of samples are reported in Table 4.8. The excellent correlation (R=0.994) with a slope of 0.996 (SD=0.030) and an intercept of -0.063 (SD = 0.079) indicates no statistical difference in the two methods with no bias over the 0.3 to 7 ppm range measured at the site.
Field Comparison Sampling (ppm EtO determined)
|
| ||||
| sampling method | ACT1 | QKT2 | ACT | QKT |
|
| ||||
| ppm EtO | 0.330 0.370 0.774 0.892 0.982 1.00 1.17 1.29 |
0.278 0.359 0.731 0.938 1.06 1.04 1.09 1.10 |
1.40 2.11 2.26 2.67 2.71 4.56 6.87 |
1.42 1.88 2.35 2.44 2.43 4.04 7.15 |
|
| ||||
| 1 acid-coated tube 2 Quazi-Ketchem tube | ||||
Additional Storage Data1
|
| |||
| test
atmos. concentration (ppm) |
% recovery ± SD (0 days stored) |
% recovery ± SD (after storage2) |
test
of significance3 |
|
| |||
| 0.10 0.50 1.0 16.0 |
96.8 ±4.9 94.6 ±2.0 90.6 ±1.4 90.4 ±5.4 (4 samples) |
102 ±6.4 (18 days) 92.3 ±3.5 (21 days) 84.6 ±2.1 (28 days) 85.6 ±3.4 (14 days) (4 samples) |
not significant at 0.05 level not significant at 0.05 level significant at 0.01 level not significant at 0.05 level |
|
| |||
| 1
six samples per data point unless otherwise
indicated 2 days of storage in parenthesis 3 two-tailed Student t-test of means | |||
Low Humidity Sampling
(2-h sampling of 2 ppm EtO at <5% R.H.)
|
| ||
| % recovery ±1 SD (0 days stored) |
% recovery ±1 SD (with storage) |
test
of significance1 |
|
| ||
| 99.4 ±2.8 (5 samples) 98.9 ±2.5 (4 samples) |
80.4
±3.12 (6 samples) 88.8 ±4.733 (4 samples) |
significant at 0.01 level significant at 0.05 level |
|
| ||
| 1
two-tailed Student t-test of
means 2 twenty-four days of ambient storage 3 fourteen days of ambient storage | ||
Short-Term Sampling at 5 ppm EtO1
|
| |||
| sampling time (min) |
% recovery ±1 SD (0 days stored) |
% recovery ±1 SD (21 days stored) |
test
of significance2 |
|
| |||
| 15 30 |
95.6 ±2.2 93.8 ±4.3 |
90.6 ±5.3 88.0 ±4.3 |
not significant at 0.05 level not significant at 0.05 level |
|
| |||
| 1
three samples per data point 2 two-tailed Student t-test of means | |||
5. References
- 5.1. Qazi, A.H.; Ketcham, N.H. Am. Ind. Hyg. Assoc. J.
1977, (38), 635-647.
5.2. Roman, S.J.; Renner, J.A. Am. Ind. Hyg. Assoc. J., 1979, (40), 742-745.
5.3. Potter, Wayne "OSHA Method No. 30, Ethylene Oxide", August 1981, OSHA Analytical Laboratory, Salt Lake City, Utah 84115.
5.4. Mori, K.; Nishida, S.; Harda, H. Eisei Kagaku, 1980, (26), 107-111.
5.5. "Current Intelligence Bulletin No. 25, Ethylene Oxide", May 22, 1981, U.S. Dept. of Health and Human Services, Public Health Service, Center for Disease and Control, NIOSH.
5.6. "Occupational Exposure to Ethylene Oxide", Federal
Register, June 2, 1984, (49),
5.7. J.N. Cawse, in "Kirk-Othmer Encyclopedia of Chemical
Technology", Vol. 9, pp.