| Methyl 2-Cyanoacrylate (MCA) Ethyl 2-Cyanoacrylate (ECA) |
| Method no.: | 55 |
| Matrix: | Air |
| Target concentration: | 2 ppm (9.1 mg/m3 for MCA, 10.2 mg/m3 for ECA) |
| Procedure: | Samples are collected by drawing a known volume of
air through phosphoric |
| Recommended air volume and sampling rate: |
12 L at 0.1 L/min |
| Reliable quantitation limit: | 10 ppb (0.05 mg/m3) for
MCA 14 ppb (0.07 mg/m3) for ECA |
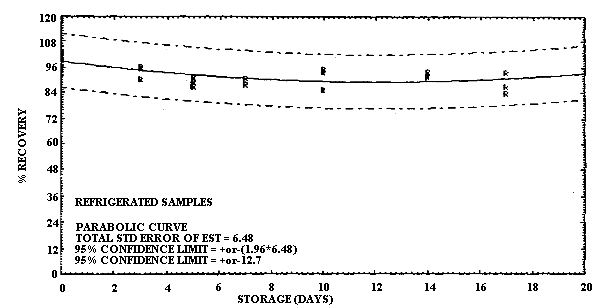
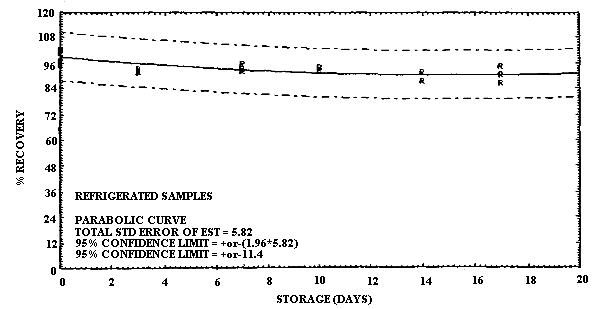
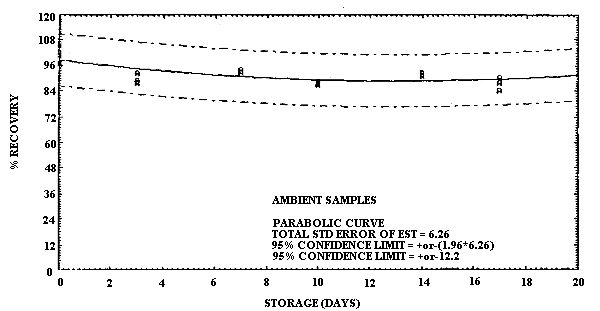
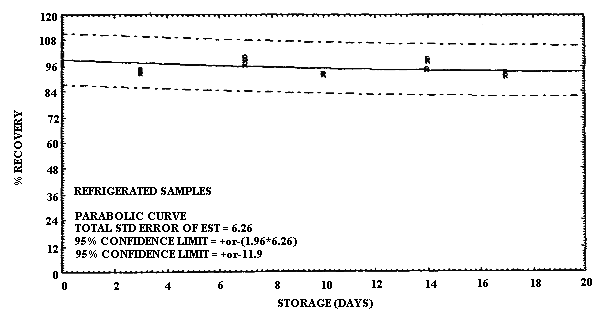
| Standard error of estimate: (Figures 4.6.2. & 4.6.4.) |
6.5% for MCA 5.8% for ECA |
| Special requirements: | After sampling, the sampling tubes must be kept at reduced temperature. (Section 2.1.3.) |
| Status of method: | Evaluated method. This method has been subjected to the established evaluation procedures of the Organic Methods Evaluation Branch. |
| Date: October 1985 | Chemist: Kevin J. Cummins |
OSHA Analytical Laboratory
Salt Lake City, Utah
1. General Discussion
- 1.1. Background
- 1.1.1. History
Methyl and ethyl
The previous method for measuring occupational exposures in air
to alkyl
The sampler evaluated in this method contains the porous polymer
resin XAD-7 coated with phosphoric acid. Phosphoric acid is commonly
used as an anionic inhibitor for stabilizing alkyl
1.1.2. Toxic effects (This section is for information only and should not be taken as the basis of OSHA policy.)
The alkyl
1.1.3. Potential workplace exposure
The alkyl
1.1.4. Physical properties (Ref. 5.1. unless otherwise indicated.)
| Methyl
| |
| CAS no.: | 37-05-3 |
| molecular weight: | 111.11 |
| boiling point: | 48-49°C (2.5-2.7 mm Hg) |
| vapor pressure: | less than 2 mm Hg at 25°C |
| appearance: | clear, colorless liquid |
| odor: | acrid, ester-like* |
| specific gravity: | 1.1044 at 20°C |
| solubility: | Reacts with water or protic solvents. Soluble in methylene chloride, acetonitrile, dimethylformamide, acetone, and toluene.* |
| synonyms: | 2-cyanoacrylic acid, methyl ester;
methylcyanoacrylate; methyl alphacyanoacrylate; mecrylate;
2-propenoic acid, |
| molecular formula: | CH2CCNCO2CH3 |
| Ethyl
| |
| CAS no.: | 7085-85-0 |
| molecular weight: | 125.14 |
| boiling point: | 54-56°C (2.6-3.0 mm Hg) |
| vapor pressure: | less than 2 mm Hg at 25°C |
| appearance: | clear, colorless liquid |
| odor: | irritating, sweet, ester-like* |
| specific gravity: | 1.0501 at 20°C |
| solubility: | same as methyl
|
| synonyms: | ethyl alpha-cyanoacrylate; 2-propenoic acid, 2-cyano, ethyl ester; 2-cyano-acrylic acid, ethyl ester; N135; Permabond 101. |
| molecular formula: | CH2CCNCO2CH2CH3 |
| * personal observation | |
1.2. Limit defining parameters (The analyte air concentrations listed throughout this method are based on a 12-L air sample and a solvent desorption volume of 2 mL for both MCA and ECA)
- 1.2.1. Detection limit of the analytical procedure
The detection limits of the analytical procedure for MCA and ECA are 5.6 and 8.7 ng per injection respectively. These are the amounts of analyte which will give a measurable response with the amounts of interferences present in a standard. (Section 4.1.)
1.2.2. Detection limit of the overall procedure
The detection limits of the overall procedure for MCA and ECA are 0.56 and 0.87 µg respectively per sample [0.05 mg/m3 (0.01 ppm) for MCA and 0.07 mg/m3 (0.01 ppm) for ECA]. These are the amounts of analyte spiked on the sampling device which allow recovery approximately equivalent to the detection limit of the analytical procedure. (Section 4.2).
1.2.3. Reliable quantitation limit
The reliable quantitation limits for MCA and for ECA are 0.56 and 0.87 µg per sample respectively [0.05 mg/m3 (0.01 ppm) for MCA and 0.07 mg/m3 (0.01 ppm) for ECA]. These are the amounts of analyte which can be quantitated within the requirements of a recovery of at least 75% and a precision (±1.96 SD) of ±25% or better. (Section 4.2.)
The reliable quantitation limit and detection limits reported in the method are based upon optimization of the instrument for the smallest possible amount of analyte. When the target concentration of an analyte is exceptionally higher than these limits, they may not be attainable at the routine operating parameters.
- 1.2.4. Sensitivity
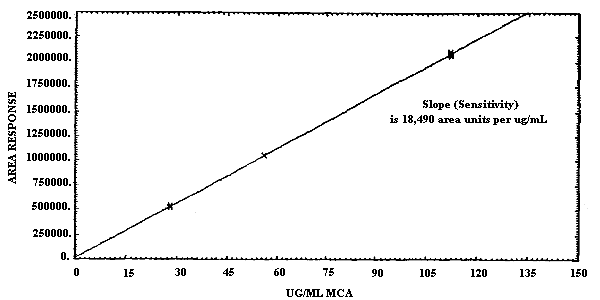
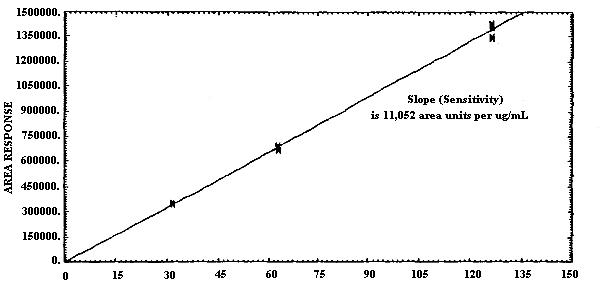
The sensitivities of the analytical procedures for MCA and for ECA over the concentration range representing 0.5 to 2 times the target concentration are 18490 area units per µg/mL for MCA and 11052 area units/µg/mL for ECA. Sensitivity is determined from the slope of the calibration curve. These values may vary with the particular instrument used in the analysis. (Section 4.4.)
1.2.5. Recovery
The recoveries of MCA and of ECA from samples collected from
separate test atmospheres of the two alkyl
1.2.6. Precision (analytical method only)
The pooled coefficients of variation obtained from replicate determinations of analytical standards at 0.5, 1, and 2 times the target concentration for MCA and for ECA are 0.008 and 0.020 respectively. (Section 4.3.)
1.2.7. Precision (overall procedure)
The precision at the 95% confidence level for the 17-day refrigerated storage tests are ±12.7% for MCA and ±11.4% for ECA. This includes an additional ±5% for sampling error. The overall procedure must provide results that are ±25% or better at the 95% confidence level. (Section 4.6.)
1.2.8. Reproducibility
Six samples spiked with a stock solution of MCA in 0.2% (v/v)
H3PO4 in
acetonitrile and a draft copy of the analytical procedure were given
to a chemist unassociated with this evaluation. The samples were
analyzed after 9 days of refrigerated storage and the average result
was 88.5 % (SD=1.1%). For the evaluation of ECA, six samples
collected from a test atmosphere of ECA and a draft copy of the
analytical procedure were given to another chemist who was also
unassociated with this evaluation. The samples were analyzed after
11 days of refrigerated storage and the average result was 90.1%
1.3. Advantages
- 1.3.1. The
1.3.2. The analytical procedure is sensitive, specific, and reliable.
1.4. Disadvantages
The samples must be kept refrigerated at all times prior to analysis.
2. Sampling Procedure
- 2.1. Apparatus
- 2.1.1. A constant flow personal sampling pump is used which can
be calibrated to within ±5% of the recommended 0.1 L/min flow rate
while the sampling tube is in line.
2.1.2. Sampling tubes containing H3PO4-treated XAD-7 adsorbent which are made at the laboratory were used in this study. (See Section 4.9. for the method of preparation of adsorbent and sampling tubes).
2.1.3. An ice chest or Styrofoam cooler packed with ice is used for maintaining samples at reduced temperature following the completion of sampling. Dry ice is necessary for shipment of the samples to the laboratory. However, caution should be exercised in using dry ice in an enclosed space such as an automobile in order to avoid possible suffocation.
2.2. Reagents
None required
2.3. Technique
- 2.3.1. Properly label the sampling tube before sampling.
2.3.2. Attach the sampling tube to the pump using a section of flexible tubing such that the large, front section of the sample tube is exposed directly to the atmosphere. Do not place any tubing ahead of the sampling tube. The sampling tube should be attached vertically in the worker's breathing zone in such a manner that it does not impede work performance.
2.3.3. After sampling for the appropriate time, remove the sampling tube from the pump and then cap the tube. Wrap the tube end to end with an official OSHA seal (Form 21). Samples should be kept at reduced temperature immediately following sampling. This can be easily accomplished at the sampling site by using an inexpensive Styrofoam cooler packed with ice to store the samples.
2.3.4. Include at least one blank for each sampling set. The blank should be handled in the same manner as the samples with the exception that air is not drawn through it.
2.3.5. List any potential interferences on the sample data sheet.
2.3.6. Samples must be shipped on dry ice. A Styrofoam cooler well-packed with dry ice and tightly sealed is a convenient means of shipping the samples. The sealed cooler should be packed inside a cardboard box and cushioned with packing material prior to shipment.
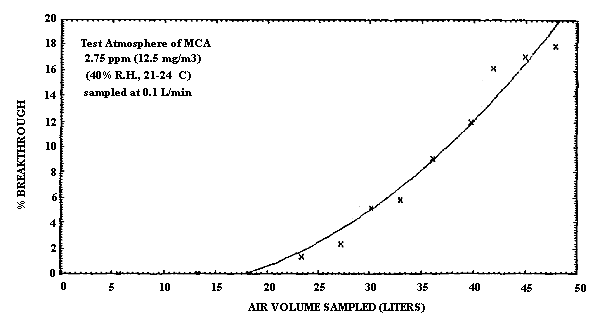
2.4. Breakthrough
Breakthrough studies for MCA and for ECA were performed in separate
experiments using the vapor generation system described in Section
4.5. The breakthrough air volume for MCA was determined by sampling at
0.10 L/min, a 12.5 mg/m3 (2.75 ppm)
atmosphere of MCA (40% R.H. and ambient temperature) with the front
section of a sampling tube. A second sampling tube containing
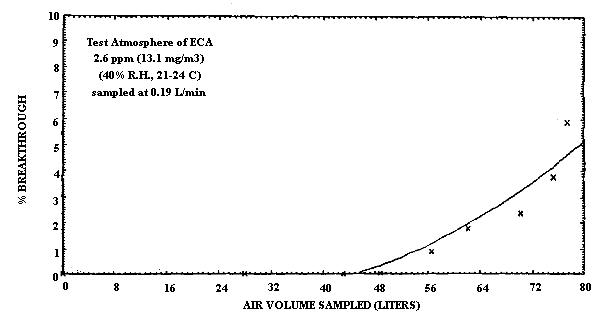
The breakthrough air volume for ECA was determined by sampling at 0.19 L/min, a 13.1 mg/m3 (2.6 ppm) atmosphere of ECA (40% R.H. and ambient temperature) in the same manner as MCA. The 5% breakthrough volume for ECA is approximately 79 L at this concentration. A higher sampling rate was used to determine breakthrough for ECA because of the much higher capacity of the sampling tube for ECA (Figure 2.4.2.).
2.5. Desorption efficiency
The desorption efficiencies of MCA and of ECA were determined in
separate experiments by spiking sampling tubes with an amount of alkyl
2.6. Recommended air volume and sampling rate
The recommended air volume is 12 L for both MCA and ECA. The recommended sampling rate for both analytes is 0.1 L/min. The sensitivity of the method will permit a sampling period as short as 15 min for both MCA and ECA at the recommended sampling rate of 0.1 L/min.
2.7. Interferences
Any substance collected with MCA or ECA that is capable of reacting
with it is a potential interference. Basic compounds, alcohols, and
free radical initiators are all capable of reacting with the alkyl
2.8. Safety precautions
- 2.8.1. Attach the sampling equipment to the worker in such a
manner that it will not interfere with work performance or safety.
2.8.2. Follow all safety practices that apply to the work area being sampled.
2.8.3. Caution should be exercised in using dry ice to avoid possible suffocation from CO2 vapors. Dry ice containers should not be transported in the passenger section of an automobile, or other confined areas.
3. Analytical Procedure
- 3.1. Apparatus
- 3.1.1. A liquid chromatograph equipped with a variable
wavelength UV detector and a reverse phase
C18 column is needed for the analysis. A
Model M-6000A (Waters Associates, Milford, MA) pump equipped with a
Waters Model 710 WISP autosampler and a Spectroflow 773 UV detector
(Kratos Anal. Instruments, Ramsey, NJ) was used along with an IBM
C18 (25 cm × 4.6 mm) stainless steel
column in this analysis.
3.1.2. An electronic integrator or other suitable means of measuring detector response is needed. The Hewlett-Packard 3357 data system was used in this evaluation.
3.1.3. Small sample vials fitted with septa were used in this analysis. Four-milliliter, screw-cap vials (WISP-type vials) obtained from Sun Brokers Inc. (Wilmington, NC) were used for this purpose.
3.1.4. An inexpensive Styrofoam cooler was used to maintain an ice bath around the analytical column.
3.2. Reagents
- 3.2.1. Commercial alkyl
For the MCA evaluation, Permabond 910 FS adhesive was used as
received for an analytical standard of methyl
For the ECA evaluation, Permabond 101 was used as received for an
analytical standard of ethyl
3.2.2. Acetonitrile (Burdick and Jackson, Muskegon, MI).
3.2.3. Phosphoric acid, reagent grade
3.2.4. HPLC quality water. Water obtained from a Milli-Q reagent grade water system (Millipore, Inc., Bedford, MA) was used in this evaluation.
3.2.5. Ice for use in maintaining the column ice bath.
3.3. Standard preparation
A stock solution of the alkyl
3.4. Sample preparation
The front adsorbent section including the front glass wool plug, and the back adsorbent section including the remaining two glass wool plugs are each placed in separate vials and 2 mL of the desorbing solution are added to each vial. The vials are then capped, shaken vigorously for several seconds and analyzed as described in Section 3.5.
3.5. Analysis
- 3.5.1. HPLC chromatographic conditions (For a discussion of
these analytical conditions see Section 4.10.)
| column: | IBM, C18 (25 cm × 4.6 mm), stainless steel maintained at 0°C with an ice bath. |
| mobile phase: | 44/56/0.2
(v/v/v) acetonitrile/water/phosphoric acid |
| flow rate: | 1 mL/min |
| UV detector wavelength: | 220 nm |
| injection volume: | 20 µL |
| retention time: | 6.1 min for MCA; 8.0 min for ECA |
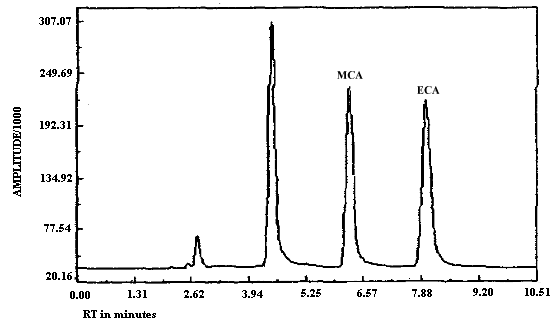
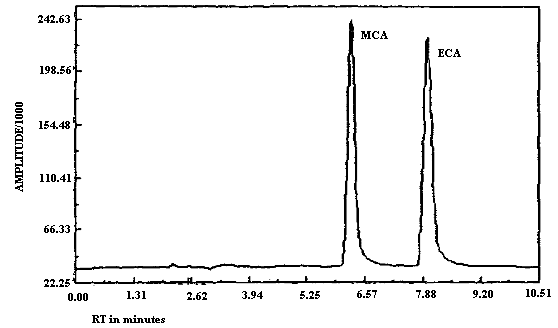
3.5.2. Chromatograms of standards of MCA and ECA in the presence
and absence of
3.6. Interferences
No interferences to the analytical method were observed during this evaluation. Nevertheless, any substance that has a similar retention time as either MCA or ECA under the existing analytical conditions is a potential interference. It may be necessary to modify the analytical conditions in order to circumvent an interference.
3.7. Calculations
- 3.7.1. A calibration curve is prepared by plotting µg/mL of the
alkyl
3.7.2. To determine results in mass per unit volume use the
following formula. No desorption efficiency correction is applied to
these results if the standards are prepared in the presence of the
| mg/m3 = µg/L = | (total µg/mL cyanoacrylate) ×
2 mL
(liters of air sampled) × (DE) |
| where | total µg/mL cyanoacrylate = the sum of the
amounts found in the front and back sections. D.E. = desorption efficiency |
3.7.3. To express the results in ppm (760 mm and 25°C) use the following formula:
| ppm = | (total µg/mL cyanoacrylate) ×
2 mL × 24.46
(liters of air sampled) × (DE) × MW |
| where | 24.46 | = | the molar volume of an ideal gas at 760 mm Hg and 25°C. |
| MW | = | molecular weight (MCA = 111.04, ECA = 125.14) |
3.8. Safety precautions
- 3.8.1. Wear safety glasses in the laboratory at all times.
3.8.2. Avoid skin contact with all solvents and reagents.
3.8.3. Minimize exposure to all reagents and solvents by performing all sample and standard preparations in a well-ventilated hood.
4. Backup Data
- 4.1. Detection limit of the analytical procedure
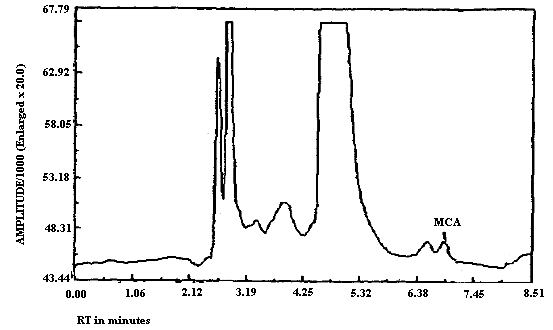
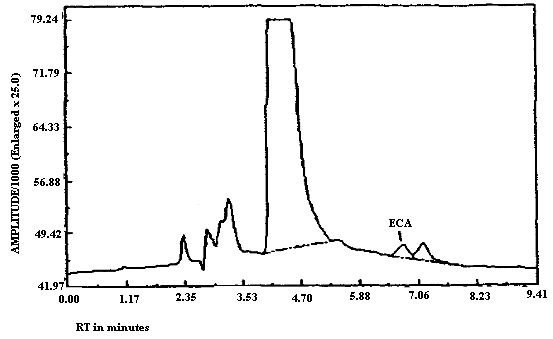
The detection limits of the analytical procedure for MCA and for ECA respectively are 5.6 and 8.7 ng per injection. These are based on a 20-µL injection of a 0.28 ng/µL MCA standard and on a 20-µL injection of a 0.43 ng/µL ECA standard. These are the amounts of analyte which will give a measurable response with the amounts of interferences present in a standard. Chromatograms of both MCA and of ECA at the detection limit are shown in Figures 4.1.1. and 4.1.2. respectively. MCA is retained longer than ECA as can be seen upon comparison of Figures 4.1.1. and 4.1.2. because the MCA analysis was performed at reduced temperature while the ECA analysis was performed at ambient temperature. Under identical analytical conditions MCA will elute before ECA (Figures 3.5.1. and 3.5.2.).
4.2. Detection limit of overall procedure and reliable quantitation limit
The reliable quantitation limits and the detection limits of the
overall procedure for this method are 0.56 µg per sample (0.05
mg/m3 or 10 ppb based on a 12-L air sample)
for MCA, and 0.87 µg per sample (0.07 mg/m3
or 14 ppb based on a 12-L air sample) for ECA. The reliable
quantitation limits were determined by spiking six front sections of
Data for Reliable Quantitation Limits
|
| ||||||||
| MCA | ECA | |||||||
|
|
| |||||||
| % recovery | statistics | % recovery | statistics | |||||
|
| ||||||||
| 102 105 107 110 103 105 |
SD 1.96 SD |
= = = |
105 2.9 5.7 |
95.2 101 95.5 97.1 92.1 96.0 |
SD 1.96 |
= = = |
96.1 2.9 5.7 | |
|
| ||||||||
4.3. Precision of the analytical method
The pooled coefficients of variation for MCA and for ECA over a range of 0.5 to 2 times the target concentration are 0.0073 and 0.020 respectively. These values were determined from six injections each of three working standards which correspond to 56.14, 112.3, and 224.5 µg of MCA per sample, and 63.26, 126.5, and 253.0 µg ECA per sample.
Precision of the Analytical Method for MCA
|
| |||
| × target conc. µg/sample |
0.5× 56.14 |
1× 112.3 |
2× 224.5 |
|
| |||
| area counts SD CV |
543834 536156 530234 531995 528030 532342 533765 5614 0.011 |
1060630 1059220 1054600 1053600 1053710 1053330 1055848 3217 0.0030 |
2103890 2108980 2102670 2092790 2073110 2069360 2091800 16813 0.008 |
|
| |||
Precision of the Analytical Method for ECA
|
| |||
| × target conc. µg/sample |
0.5× 63.26 |
1× 126.5 |
2× 253 |
|
| |||
| area counts SD CV |
352080 357494 347056 344913 350780 354606 351155 4666 0.013 |
377938 673315 698116 677321 687284 670451 680738 10250 0.015 |
1417140 1337510 1423280 1435380 1404810 1352690 1395135 40279 0.029 |
|
| |||
4.4. Sensitivity
The slope of the calibration curve over the range of 0.5 to 2.0
times the target concentration for the analytes represents the
sensitivity for the method. The sensitivities for MCA and for ECA are
18490 and 11052 area units per µg/mL respectively. The difference in
sensitivity observed between MCA and ECA is due to the enhanced
response obtained upon analysis of MCA at
4.5. Generation and determination of test atmosphere concentrations
Test atmospheres for both MCA and ECA were generated using the
laboratory vapor generation system and a Metronics 450 Dynacalibrator
permeation device. Four small glass diffusion bulbs (12- to 15-mm
diameter) which had a 2 cm long glass neck attached and a
Although the rate of mass loss of alkyl
A Hewlett-Packard Model 5730A gas chromatograph equipped with a
nitrogen-phosphorus detector and an automated gas sampling valve was
used to independently determine the concentration of the alkyl
Midget fritted-glass bubblers containing 0.2% (v/v)
H3PO4 in
acetonitrile were also used to sample both the MCA and ECA test
atmospheres alongside the recommended sampling tube. The results are
presented in Table 4.5.2. The good correlation obtained in this study
is further evidence that the recommended sampling tube is a reliable
means of measuring exposures. Although this bubbler method has not
been previously evaluated, it was observed that both MCA and ECA
standards are very stable in the acidified acetonitrile solution. No
loss of alkyl
Determination of Test Atmosphere Concentration
(Comparison of
|
| |||||
| average mg/m3 ± SD | |||||
| compound | sampling tube (ST) | GC | ST/GC | ||
|
| |||||
| MCA MCA ECA |
10.61 ± 0.33 10.68 ± 0.02 11.00 ± 0.12 |
(5)1 (2) (5) |
9.43 ±
0.071 10.02 ± 0.45 11.25 ± 0.44 |
(2) (2) (3) |
1.13 1.07 0.98 |
|
| |||||
| 1 number of determinations in parenthesis | |||||
Determination of Test Atmosphere Concentration
(Comparison of
|
| |||
| average mg/m3 ± SD1 | |||
| compound | sampling tube (ST) | bubbler | ST/bubbler |
|
| |||
| MCA MCA ECA |
11.27 ± 0.12 13.24 ± 0.27 11.10 ± 0.22 |
12.07 ± 0.12 14.28 ± 0.11 11.87 ± 0.43 |
0.93 0.93 0.94 |
|
| |||
| 1 average for three samples | |||
4.6. Storage
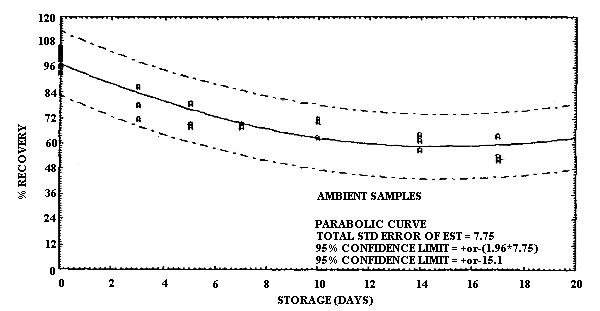
Storage of MCA and of ECA samples was performed at both ambient and refrigerated temperatures. For MCA storage the samples were prepared by sampling at 0.20 L/min a test atmosphere at 40% R.H. and ambient temperature for 60 min. The concentration of this test atmosphere was determined to be 9.9 mg/m3 based on the analysis of six samples collected during the generation of the storage samples. (The GC method was not used to determine the concentration of the test atmosphere for the storage results because it was not developed until after the storage data had been collected. Nevertheless the good correlation obtained with the GC method and the sample tube method under sampling conditions which were similar to the conditions used in this storage study supports the validity of using the test method to determine the test atmosphere concentration.) This sample load is approximately equivalent to a 2-h exposure at the 2-ppm target concentration for a 0.10 L/min sampling rate. A total of 36 samples were generated for the MCA evaluation in one day from the vapor generation system. Six of these samples were selected at random and analyzed the same day to determine the test atmosphere concentration as indicated above. The remaining 30 samples were randomly split into two groups of 15 samples each for storage either at ambient temperature in the dark or at reduced temperature in a refrigerator. Three samples from each group were selected at random and analyzed at 3- to 4-day intervals over the next 17 days. The percent recoveries for each sample are listed in Table 4.6.1. and are shown graphically in Figures 4.6.1. and 4.6.2.
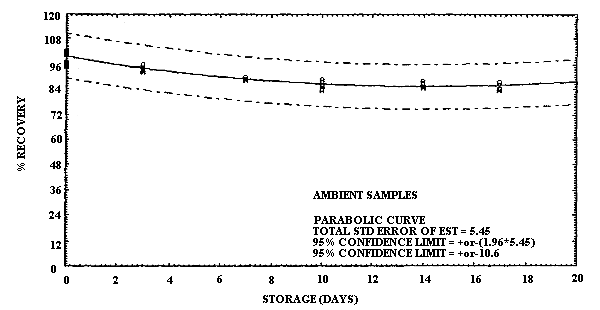
Storage samples for ECA were prepared in a manner similar to MCA. In this case, however, the samples were collected on two different days. On the first day, 24 samples were collected by sampling a test atmosphere of ECA at 40% R.H. and ambient temperature at a 0.2 L/min for 2 h. Six of these samples were selected at random and analyzed on the same day. Based on the analysis of these samples the concentration of this test atmosphere was determined to be 4.3 mg/m3. Of the remaining eighteen samples, nine samples were stored in a refrigerator, and nine were stored at ambient temperature for later analysis. Three days later another 24 samples were collected under the same test atmosphere conditions. Six of these samples were selected at random and analyzed on this same day to obtain the zero-storage day results. In addition, three samples each from ambient and refrigerated storage were analyzed on this same day to obtain the 3-day storage results. The remaining 12 samples were split into two equal-sized groups and stored with the other storage samples. The stored samples were analyzed at 7-day intervals over the next two weeks in two groups of 12 by selecting 3 ambient and 3 refrigerated samples for analysis from both storage groups. The percent recovery is reported for each sample in Table 4.6.2. The results are presented graphically in Figures 4.6.3. and 4.6.4.
Storage samples were also collected from a test atmosphere of ECA at low relative humidity (<5% R.H.) and ambient temperature that was determined to be 5.3 mg/m3 based on sample tube analysis. This study was done in the same manner as the high humidity ECA storage study except that the dry dilution air was not passed through the water bubbler before sampling an atmosphere of ECA. The results of this storage study are presented in Table 4.6.3. and in Figures 4.6.5. and 4.6.6. No low humidity studies of MCA were undertaken in this study because of time and instrumentation constraints at the laboratory, although it is not anticipated that low humidity would adversely affect recoveries for MCA.
It is apparent that serious losses in recovery are observed upon
storage of MCA samples at ambient temperature. Losses in recovery of
MCA at reduced temperature are much less severe. Storage losses for
ECA are also less at reduced temperature than at ambient, but the loss
in recovery at ambient temperature is not as great as for MCA. There
is no apparent difference in storage results for ECA samples generated
from either low or high humidity. No low humidity storage data were
collected for MCA in this study. Because of the instability of the
alkyl
Storage Tests for MCA
|
| |||||||
| storage time | % recovery | ||||||
| (days) | (ambient) | (refrigerated) | |||||
|
| |||||||
| 0 0 3 5 7 10 14 17 |
96.7 103 78.1 69.2 67.5 70.4 61.8 63.6 |
93.4 102 71.8 68.2 69.4 62.8 64.6 52.2 |
99.8 105 86.8 78.7 70.4 71.8 56.9 53.8 |
96.7 103 96.4 91.4 90.9 85.6 91.8 93.8 |
93.4 102 90.7 88.9 87.7 94.3 94.3 83.8 |
99.8 105 95.7 87.0 91.1 95.3 92.6 87.2 | |
|
| |||||||
Storage Tests for ECA
|
| |||||||
| storage time | % recovery | ||||||
| (days) | (ambient) | (refrigerated) | |||||
|
| |||||||
| 0 0 3 7 10 14 17 |
102 95.2 95.8 88.7 88.6 88.0 83.8 |
101 102 93.5 88.5 83.3 84.9 84.4 |
97.1 102 92.6 89.9 85.8 86.6 87.5 |
102 95.2 92.1 92.3 92.8 87.5 94.7 |
101 102 93.5 93.3 94.2 87.3 90.7 |
97.1 102 91.6 95.7 92.8 91.6 86.8 | |
|
| |||||||
Storage Tests for ECA, Low Humidity Sampling
|
| |||||||
| storage time | % recovery | ||||||
| (days) | (ambient) | (refrigerated) | |||||
|
| |||||||
| 0 0 3 7 10 14 17 |
101 102 92.4 92.8 88.7 92.8 84.3 |
106 96.8 88 84.3 86.9 92.6 88.0 |
97.8 96.8 88.9 93.0 87.8 91.3 90.6 |
101 102 94.6 97.0 92.6 94.7 91.3 |
106 96.8 93.0 100 92.2 98.5 93.3 |
97.8 96.8 94.3 99.0 92.4 99.4 91.3 | |
|
| |||||||
4.7 Reproducibility
Six sample tubes were each spiked with 5.8 µL of a 23.4 mg/mL stock standard of MCA (117 µg) and then capped and stored in a refrigerator until analysis. The samples, after being stored for 9 days, were analyzed by a chemist unassociated with this method.
Six samples were collected from a test atmosphere of ECA and then capped and stored in a refrigerator until analysis. These samples, after being stored for 11 days, were also analyzed by a chemist unassociated with this method.
Reproducibility for MCA and ECA
|
| ||||||||
| MCA | ECA | |||||||
|
|
| |||||||
| % recovery | statistics | % recovery | statistics | |||||
|
| ||||||||
| 90.1 87.9 88.6 87.1 89.4 87.9 |
SD |
= = |
88.5 1.1 |
90.1 89.9 88.2 91.0 90.0 91.3 |
SD |
= = |
90.1 1.1 | |
|
| ||||||||
4.8. Desorption efficiency
The percent recovery of MCA and of ECA spiked onto 80-mg portions
of the acid treated XAD-7 resin was determined at levels corresponding
to 0.5, 1, and 2 times the target concentration by spiking the front
section of the sampling tubes contained in autosampler vials with a
stock standard of the alkyl
Desorption Efficiencies for MCA ECA
|
| |||||||
| MCA | ECA | ||||||
| × target conc. µg/sample |
0.5× 58.5 |
1× 117 |
2× 234 |
0.5× 53.9 |
1× 107.7 |
2× 215.3 | |
|
| |||||||
| desorption efficiency, % |
91.6 97.8 94.6 93.3 96.0 94.0 94.6 |
90.8 94.1 93.3 96.8 94.1 98.7 94.6 94.4% |
94.5 92.7 94.2 94.9 92.2 94.9 93.9 |
96.1 95.5 95.4 95.7 94.6 95.0 95.4 |
98.1 97.2 98.1 98.2 97.6 97.7 97.8 97.0 |
96.0 97.5 98.9 98.0 97.9 97.9 97.7 | |
|
| |||||||
4.9. Preparation of
Approximately 100 g of Amberlite XAD-7 20-60 mesh, a porous
polyacrylate adsorbent manufactured by Rohm and Haas and obtained from
Aldrich Chemical, Milwaukee, WI (lot # 3311PJ) was washed with
numerous volumes of deionized water in an Erlenmeyer flask until all
suspended particles were removed. The adsorbent was then rinsed with
several volumes of HPLC grade methanol (total volume 300-400 mL) and
then with several volumes of HPLC grade acetonitrile (total volume
approximately 300-400 mL) and the excess solvent removed by vacuum
filtration. The adsorbent was treated with phosphoric acid by adding a
solution of 14 mL of reagent grade phosphoric acid and approximately
200 mL of acetonitrile to a 500-mL round bottom flask containing the
adsorbent. After allowing to stand for a few minutes, the mixture was
dried on a rotary evaporator using a hot water bath and vacuum. This
The sampling tubes consist of 6-mm o.d. × 4-mm i.d. × 45-mm glass
tubes packed with two sections of the phosphoric
4.10. Discussion of analytical conditions
Although the cyanoacrylates react rapidly in water, a standard
reverse phase HPLC technique employing a C18
analytical column and an aqueous phosphoric acid/acetonitrile mobile
phase was successfully used to analyze for both methyl and ethyl
The purpose for adding adsorbent to the standards prior to analysis is to obtain consistent integration of samples and standards. These inconsistencies arise because the data system is unable to reliably reset a proper baseline for integration due to the rise in the baseline preceding the standard peak. No integration problems were observed for the samples because a peak from the adsorbent which eluted before the analyte peak eliminated this baseline reset problem. If the analysis is performed at 0°C as described for the MCA analysis below, the baseline rise due to on-column decomposition is virtually eliminated. Under these conditions addition of adsorbent to the standard vials is unnecessary.
Fluctuations in room temperature during the analysis of MCA produced poor reproducibility due to the variation in the on-column decomposition of the cyanoacrylate. Initially this problem was solved by using a column temperature heater to maintain a constant temperature slightly above ambient conditions. Analytical conditions were later optimized by placing the analytical column in an ice bath. Although retention times were increased significantly at these reduced temperatures, decomposition was minimized, reproducibility was improved, and sensitivity was enhanced. Analysis of ECA is also best performed under these conditions. One to two trays of ice from a commercial style refrigerator/freezer were adequate to maintain a constant reduced temperature for approximately 8 to 10 h under these conditions.
5. References
- 5.1. Coover, H.W.,Jr.; McIntire, J.M. In "Kirk-Othmer's
Encyclopedia of Chemical Technology", 3rd ed.; Grayson, Martin Ed.;
John Wiley & Sons: New York, 1978; Vol. 1,
5.2. Walker, R.F.; Guiver, R. Am. Ind. Hyg. Assoc. J., 1981, (42), 559-565.
5.3. Method # ID-125-SG, OSHA Analytical Laboratory, Inorganic Methods Evaluation Group, Salt Lake City, Utah, 84115.
5.4. McGee, W.A.; Oglesby, F.L.; Raleigh, R.L.; Fassett, D.W. Am Ind. Hyg. Assoc. J., 1968, (29), 558-561.
5.5. Stecher, Paul, G., Ed. "Merck Index", 8th ed., Merck and Co., Rahway, N.J., 1968.
5.6. Symth, H.F.; Carpenter, C.P.; Weil, C.S.; Pozzani, U.C.; Striegel, J.A. Am. Ind. Hyg. Assoc. J., 1962, (23), 95-107.