| Method no.: | 57 |
| Matrix: | Air |
| Target concentration: | 1 ppb (8.1 µg/m3) |
| Procedure: | Samples are collected by drawing known volumes of air
through sulfuric |
| Recommended air volume and sampling rate: |
100 L at 1 L/min |
| Reliable quantitation limit: | 10 ppt (81 ng/m3) |
| Standard error of estimate at the target concentration: (Figure 4.4.2.) |
9.7% |
| Status of method: | Evaluated method. This method has been subjected to the established evaluation procedures of the Organic Methods Evaluation Branch. |
| Date: January 1986 Updated: July 1989 |
Chemist: Carl J. Elskamp |
OSHA Analytical Laboratory
Salt Lake City, Utah
1. General Discussion
- 1.1. Background
- 1.1.1. History
There are several procedures in the literature for the
determination of MDA in air. These include collection on silica gel
coated with diethylamine and analysis by
Since impinger solutions are inconvenient to use in the field and silica gel tubes may not efficiently collect aerosols or dusts, the NIOSH filter method was evaluated. The analytical portion of this method was considered to have inadequate sensitivity for a target concentration of 1 ppb. Thus, the analysis scheme was modified to GC analysis of the HFAA derivative of MDA using an electron capture detector. To enhance stability of collected samples, the method was further modified by requiring that the filters be transferred to vials containing deionized water before shipment to the laboratory for analysis.
Note: As a consequence of later evaluation tests done for
toluidine, this method has been updated. The sampling device now
consists of two
1.1.2. Toxic effects (This section is for information only and should not be taken as the basis of OSHA policy.)
A bioassay study conducted by the National Toxicology Program indicated that the dihydrochloride salt of MDA is carcinogenic in both sexes of rats and mice. MDA significantly increased the incidence of cancer of the liver, thyroid gland, and hematopoietic system. There were also several other very rare tumors found. (Ref. 5.5.)
Currently there is no OSHA PEL for MDA. Since there is strong evidence that MDA causes cancer (Ref. 5.5.), a target concentration of 1 ppb was chosen for this evaluation.
1.1.3. Potential workplace exposure (Ref. 5.6.)
MDA is produced commercially by the acid catalyzed condensation reaction between aniline and formaldehyde. It is mainly used as an intermediate for production of isocyanates, which in turn are used to make polyurethane foams, elastomers, coatings, spandex, etc. Only a small amount of MDA is actually isolated for production of isocyanates.
MDA is produced only by one company in the United States for sale purposes. The major application of isolated MDA is as an epoxy curative. It is also used in the preparation of high performance wire coatings (formed by reacting with trimellitic anhydride). Other uses include an antioxidant in rubber; a corrosion preventative for iron under highly acidic conditions; an antioxidant in lubricating oils; and an intermediate for dyes.
1.1.4. Physical properties (Ref. 5.6.)
| molecular weight: | 198.3 |
| boiling range at 35 mm Hg: | 262-268°C |
| freezing point: | 89.0°C |
| color: | light brown crystals (oxidizes slowly in air resulting in darker color) |
| specific gravity at 100°C/4°C: | 1.056 |
| flash point: | 221.1°C |
| odor: | faint amine-like |
| synonyms: | |
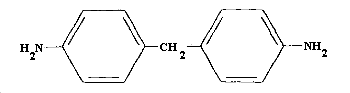
| structural formula: | Figure 1.1.4. |
1.2. Limit defining parameters (The analyte air concentrations listed throughout this method are based on an air volume of 100 L and a toluene extraction volume of 2.0 mL. Air concentrations listed in ppb and ppt are referenced to 25°C and 760 mm Hg. Although the derivative of MDA is analyzed, the equivalent mass of MDA is listed throughout the method.)
- 1.2.1. Detection limit of the analytical procedure
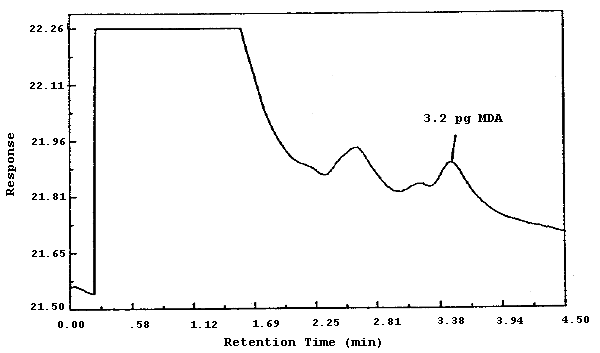
The detection limit of the analytical procedure is 3.2 pg per injection. This is the amount of analyte which gives a measurable response with the amounts of interferences present in analytical standards. (Section 4.1.)
1.2.2. Detection limit of the overall procedure
The detection limit of the overall procedure is 8.1 ng per sample (10 ppt or 81 ng/m3). This is the amount of MDA that can be spiked on a sample filter that when extracted, after 100 L of humid air were drawn through it, gives a measurable response in the presence of trace interferences. (Section 4.2.)
1.2.3. Reliable quantitation limit
The reliable quantitation limit is 8.1 ng per sample (10 ppt or 81 ng/m3). This is the smallest amount of MDA which can be quantitated within the requirements of a recovery of at least 75% and a precision (±1.96 SD) of ±25% or better. (Section 4.2.)
The reliable quantitation limit and detection limits reported in the method are based upon optimization of the instrument for the smallest possible amount of analyte. When the target concentration of an analyte is exceptionally higher than these limits, they may not be attainable at the routine operating parameters.
- 1.2.4. Sensitivity
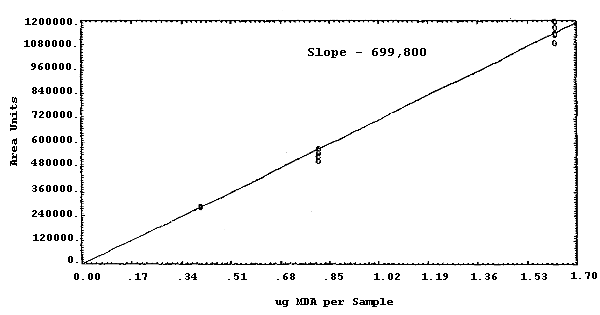
The sensitivity of the analytical procedure over a concentration range representing 0.5 to 2 times the target concentration based on the recommended air volume is 699,800 area units per µg/sample. This is determined by the slope of the calibration curve. (Section 4.3.) The sensitivity will vary with the particular instrument used in the analysis.
1.2.5. Recovery
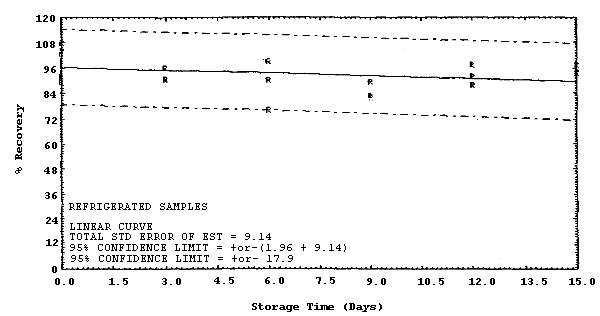
The recovery of MDA from samples used in a 15-day storage test remained above 79% when the samples were stored in a closed drawer at ambient temperatures of 20 to 25°C. (Section 4.4.) The recovery of MDA from the collection medium during storage must be 75% or greater.
1.2.6. Precision (analytical method only)
The pooled coefficient of variation obtained from replicate determinations of analytical standards at 0.5, 1, and 2 times the target concentration is 0.030. (Section 4.3.)
1.2.7. Precision (overall procedure)
The precision at the 95% confidence level for the 15-day storage test is ±18.9%. (Section 4.4.) This includes an additional ±5% for sampling error. The overall procedure must provide results at the target concentration that are ±25% or better at the 95% confidence level.
1.2.8. Reproducibility
Six samples, spiked by liquid injection, and a draft copy of this procedure were given to a chemist unassociated with this evaluation. The samples were analyzed after 0.5 days of storage at 2°C. The average recovery was 88.5% with a standard deviation of 7.3%. (Section 4.5.)
1.3. Advantages
- 1.3.1. The
1.3.2. The analysis is rapid, sensitive, and precise.
1.3.3. Samples are stable, even at ambient temperatures.
1.4. Disadvantages
- 1.4.1. Sample filters must be transferred to vials containing
water before being submitted to the laboratory for analysis.
1.4.2. Methylene bisphenyl isocyanate (MDI) appears to be a positive interference.
2. Sampling Procedure
- 2.1. Apparatus
- 2.1.1. Samples are collected by use of a personal sampling pump
that can be calibrated within ±5% of the recommended flow rate with
the sampling filter in line.
2.1.2. Samples are collected closed-face using a sampling device
consisting of two sulfuric-acid treated 37-mm Gelman type A/E glass
fiber filters contained in a
2.1.3. After sampling, the filters are carefully removed from the cassettes and individually transferred to small vials containing approximately 2 mL of deionized water. The vials must be tightly sealed. The water can be added before or after the filters are transferred. The vials must be sealable and capable of holding at least 7 mL of liquid. Small glass scintillation vials with caps containing Teflon liners are recommended.
2.2. Reagents
Deionized water is needed for addition to the vials in 2.1.3.
2.3. Sampling technique
- 2.3.1. Immediately before sampling, remove the plastic plugs
from the filter cassettes. (closed-face sampling)
2.3.2. Attach the cassette to the sampling pump with flexible tubing and place the cassette in the employee's breathing zone.
2.3.3. After sampling, seal the cassettes with plastic plugs until the filters are transferred to the vials containing deionized water.
2.3.4. At some convenient time within 10 h of sampling, transfer the sample filters to vials as in Section 2.1.3.
2.3.5. Seal the small vials lengthwise with OSHA Form 21.
2.3.6. Submit at least one blank filter with each sample set. Blanks should be handled in the same manner as samples, but no air is drawn through them.
2.3.7. Record sample volumes (in liters of air) for each sample, along with any potential interferences.
2.4. Retention efficiency
A retention efficiency study was performed by drawing 100 L of air
(80% relative humidity) at 1 L/min through sample filters that had
been spiked with 0.814 µg of MDA. Blank
2.5. Extraction efficiency
- 2.5.1. The average extraction efficiency for six filters spiked
at the target concentration is 99.6%. (Section 4.7.)
2.5.2. The stability of extracted and derivatized samples was verified by reanalyzing the above six samples the next day using fresh standards. The average extraction efficiency for the reanalyzed samples is 98.7%. (Section 4.7.)
2.6. Recommended air volume and sampling rate
- 2.6.1. The recommended air volume is 100 L.
2.6.2. The recommended sampling rate is 1 L/min.
2.7. Interferences (sampling)
- 2.7.1. MDI appears to be a positive interference. It was found
that when MDI was spiked onto an
2.7.2. Suspected interferences should be reported to the laboratory with submitted samples.
2.8. Safety precautions (sampling)
- 2.8.1. Attach the sampling equipment to the employees so that it
will not interfere with work performance or safety.
2.8.2. Follow all safety procedures that apply to the work area being sampled.
3. Analytical Procedure
- 3.1. Apparatus
- 3.1.1. A GC equipped with an electron capture detector. For this
evaluation a Tracor 222 Gas Chromatograph equipped with a Nickel 63
High Temperature Electron Capture Detector and a Linearizer was
used.
3.1.2. A GC column capable of separating the MDA derivative from the solvent and interferences. A 6-ft × 2-mm i.d. glass column packed with 3% OV-101 coated on 100/120 Gas Chrom Q was used in this evaluation.
3.1.3. An electronic integrator or some other suitable means of measuring peak areas or heights.
3.1.4. Small resealable vials with Teflon-lined caps capable of holding 4 mL.
3.1.5. A dispenser or pipet for toluene capable of delivering 2.0 mL.
3.1.6. Pipets (or repipets with plastic or Teflon tips) capable of delivering 1 mL for the sodium hydroxide and buffer solutions.
3.1.7. A repipet capable of delivering 25 µL of HFAA.
3.1.8. Syringes for preparation of standards and injection of standards and samples into a GC.
3.1.9. Volumetric flasks and pipets to dilute the pure MDA in preparation of standards.
3.1.10. Disposable pipets to transfer the toluene layers after the samples are extracted.
3.2. Reagents
- 3.2.1. 0.5 N NaOH prepared from reagent grade NaOH.
3.2.2. Toluene, pesticide grade. Burdick and Jackson distilled in glass toluene was used.
3.2.3. Heptafluorobutyric acid anhydride (HFAA). HFAA from Pierce Chemical Company was used.
3.2.4. Phosphate buffer (pH 7.0), prepared from 136 g of potassium dihydrogen phosphate and 1 L of deionized water. The pH is adjusted to 7.0 with saturated sodium hydroxide solution.
3.2.5. 4,4'-Methylenedianiline (MDA), reagent grade.
3.3. Standard preparation
- 3.3.1. Concentrated stock standards are prepared by diluting
pure MDA with toluene. Analytical standards are prepared by
injecting microliter amounts of diluted stock standards into vials
that contain 2.0 mL of toluene.
3.3.2. Twenty-five microliters of HFAA are added to each vial and the vials are capped and shaken for 10 s.
3.3.3. After 10 min, 1 mL of buffer is added to each vial.
3.3.4. The vials are recapped and shaken for 10 s.
3.3.5. After allowing the layers to separate, aliquots of the toluene (upper) layers are removed with a syringe and analyzed by GC.
3.3.6. Analytical standard concentrations should bracket sample concentrations. Thus, if samples fall out of the range of prepared standards, additional standards must be prepared to ascertain detector response.
3.4. Sample preparation
- 3.4.1. The sample filters are received in vials containing
deionized water.
3.4.2. One milliliter of 0.5 N NaOH and 2.0 mL of toluene are added to each vial.
3.4.3. The vials are recapped and shaken for 10 min.
3.4.4. After allowing the layers to separate, approximately 1-mL aliquots of the toluene (upper) layers are transferred to separate vials with clean disposable pipets.
3.4.5. The toluene layers are treated and analyzed as in sections 3.3.2. through 3.3.5.
3.5. Analysis
- 3.5.1. GC conditions
| zone temperatures: | 220°C (column) 235°C (injector) 335°C (detector) |
| gas flows, Ar/CH4(95/5): | 28 mL/min (column) 40 mL/min (purge) |
| injection volume: | 5.0 µL |
| column: | 6 ft × 2-mm i.d. glass, 3% OV-101 on 100/120 Gas Chrom Q |
| retention time: | 3.5 min (MDA derivative) |
| chromatogram: | Section 4.8. |
3.5.2. Peak areas or heights are measured by an integrator or other suitable means.
3.5.3. A calibration curve is constructed by plotting response (peak areas or heights) of standard injections versus µg of MDA per sample. Sample concentrations must be bracketed by standards.
3.6. Interferences (analytical)
- 3.6.1. Any compound that gives an electron capture detector
response and has the same general retention time as the HFAA
derivative of MDA is a potential interference. Suspected
interferences reported to the laboratory with submitted samples by
the industrial hygienist must be considered before samples are
derivatized.
3.6.2. GC parameters may be changed to possibly circumvent interferences.
3.6.3. Retention time on a single column is not considered proof of chemical identity. Analyte identity should be con firmed by GC/MS if possible.
3.7. Calculations
The analyte concentration for samples is obtained from the calibration curve in terms of micrograms of MDA per sample. The extraction efficiency is 100%. If any MDA is found on the blank, that amount is subtracted from the sample amounts. The air concentrations are calculated using the following formulae:
| µg/m3 = | (micrograms of MDA per sample)
(1000)
(liters of air sampled) |
| where | 24.46 | = | molar volume (liters) at 25°C and 760 mm Hg |
| 198.3 | = | molecular weight of MDA |
3.8. Safety precautions (analytical)
- 3.8.1. Avoid skin contact and inhalation of all chemicals.
3.8.2. Restrict the use of all chemicals to a fume hood if possible.
3.8.3. Wear safety glasses and a lab coat at all times while in the lab area.
4. Backup Data
- 4.1. Detection limit of the analytical procedure
The injection volume listed in the analytical procedure (5.0 µL) was used in the determination of the detection limit of the analytical procedure. The detection limit of 3.2 pg was determined by analyzing a dilute standard equivalent to 1.3 ng of MDA per sample. This amount was judged to give a measurable response since the conventional means of determining the detection limit based on 5 times the baseline noise was not possible because of interfering peaks. Shown in Figure 4.1. is a chromatogram of this analysis.
4.2. Detection limit of the overall procedure and reliable quantitation limit data
The detection limit of the overall procedure is normally determined by analyzing filters spiked with a loading equivalent to the detection limit of the analytical procedure plus the amount expected to be lost due to incomplete recovery. Since there are more analytical interferences found in samples than standards, a larger amount of MDA had to be spiked onto the filters in order to obtain a measurable amount of derivative. Samples were prepared by injecting 8.1 ng of MDA onto six filters. This is equivalent to 10 ppt or 81 ng/m3 for 100-L air samples. The samples were analyzed after 100 L of air at 80% relative humidity had been drawn through them. Since the recovery was near 100% at this level, the reliable quantitation limit was taken to be the same as the detection limit of the overall procedure.
Detection Limit of the Overall
Procedure and Reliable Quantitation Limit Data
|
| ||
| sample no. | % recovery | statistics |
|
| ||
| 1 2 3 4 5 6 |
90.1 93.4 87.9 91.1 90.4 88.8 |
SD = 1.9 1.96 SD = 3.7 |
|
| ||
4.3. Sensitivity and Precision (analytical method only)
The sensitivity and precision of the analytical procedure were determined from multiple injections of analytical standards. These data are given in Table 4.3. and Figure 4.3.
Sensitivity and Precision Data
|
| |||
| × target conc. µg/sample ppb |
0.5× 0.407 0.50 |
1× 0.814 1.00 |
2× 1.627 2.01 |
|
| |||
| area counts SD CV |
286134 286479 290451 282307 281069 285986 285404 3343 0.012 |
549995 549924 530925 511480 568540 560580 545241 20820 0.038 |
1162300 1134140 1126760 1198810 1192670 1089170 1150640 42057 0.037 |
| Response = 699800 area units per µg/sample | |||
|
| |||
4.4. Storage test
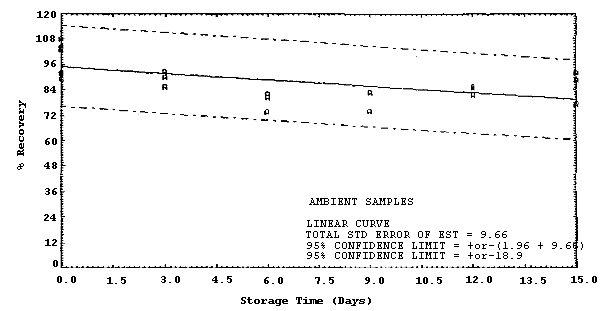
Storage samples were generated by spiking 36 filters with 3.6 µL of 0.226 µg/µL MDA (0.814 µg). Thirty liters of 80% relative humidity air were then drawn through each filter. Within 1 h, the filters were transferred to scintillation vials, each containing 2 mL of deionized water. Six samples were analyzed immediately, fifteen were stored in a refrigerator at 2°C, and fifteen were stored in a closed drawer at ambient temperature. Six samples, three from refrigerated and three from ambient storage, were analyzed in 3-day intervals over a period of 15 days. The results are given in Table 4.4. and Figures 4.4.1. and 4.4.2.
Storage Tests
|
| |||||||
| storage time | % recovery | ||||||
| (days) | (refrigerated) | (ambient) | |||||
|
| |||||||
| 0 0 3 6 9 12 15 |
89.6 103.6 96.1 76.1 82.7 87.9 94.4 |
92.3 107.8 90.5 90.2 81.9 92.2 93.9 |
104.4 103.3 90.8 99.1 89.4 97.5 97.5 |
89.6 103.6 90.0 80.2 82.7 84.5 88.6 |
92.3 107.8 85.6 82.0 --- 85.3 77.0 |
104.4 103.3 92.9 73.7 74.1 81.4 92.2 | |
|
| |||||||
4.5. Reproducibility data
Six samples were prepared by injecting microliter quantities of an
MDA standard onto
Reproducibility
|
| ||||||
| sample no. | µg found | µg expected | % found | |||
|
| ||||||
| 1 2 3 4 5 6 |
1.20 0.44 0.55 1.09 0.60 0.43 |
1.36 0.45 0.68 1.36 0.68 0.45 |
88.2 97.8 80.9 80.1 88.2 95.6 | |||
| ||||||
|
| ||||||
4.6 Retention efficiency data
Six filters were liquid spiked with 0.814 :g of MDA. The filters
were assembled into cassettes using
Retention Efficiency Data
|
| ||
| sample no. | µg found | % found |
|
| ||
| 1 2 3 4 5 6 |
0.744 0.774 0.721 0.746 0.747 0.750 |
91.4 95.1 88.6 91.6 91.8 92.1 |
|
| ||
4.7. Extraction efficiency data
Six sample filters were each spiked with 0.814 µg of MDA and analyzed to determine the extraction efficiency. To determine the stability of extracted and derivatized samples, these same six samples were reanalyzed with fresh standards after 24 h.
Extraction Efficiency Data
|
| ||
| sample no. | % extracted | reanalyzed after 24 h |
|
| ||
| 1 2 3 4 5 6 |
102.8 100.5 94.4 99.2 103.2 97.2 99.6 |
102.3 99.6 96.3 101.9 98.3 93.6 98.7 |
|
| ||
4.8. Chromatogram
A chromatogram is shown in Figure 4.8. The chromatogram is from a 5.0-µL injection of a standard equivalent to 0.814 µg per sample. This concentration is equal to 1.0 ppb for a 100-L air sample.

5. References
5.2. Nieminen, E.H.; Saarinen, J.T.; Laakso, J.T. J. Liq. Chromatogr. 1983, 6(3), 453-469.
5.3. Skarping, G.; Renman, L.; Smith, B.E.F. J. Chromatogr. 1983, 267, 315-327.
5.4. Boeniger, M.F.; Slick, E.; Geraci, C. National Institute for Occupational Safety and Health, unpublished results.
5.5. Fed. Regist. 1983, 48 (Sept. 20), 42898.
5.6. Moore, W. M. in "Kirk-Othmer Encyclopedia of Chemical Technology",
Vol. 2, pp.