| Method no.: | 59 |
| Matrix: | Air |
| Target concentration: | 1 and 500 ppm (500 ppm is the PEL) |
| Procedure: | Samples are collected by drawing a known volume of air through specially prepared sampling tubes that contain three 350-mg sections of coconut shell charcoal. Analysis of the samples is by GC/FID following desorption of the individual charcoal sections with carbon disulfide. |
| Recommended air volume and sampling rate: |
10 L at 0.05 L/min |
| Reliable quantitation limit: | 29 ppb |
| Standard errors of estimate at 1 ppm and 500 ppm (Section 4.7.): |
6.2 (1 ppm, 80% RH, ambient storage) 5.6 (500 ppm, 80% RH, ambient storage) |
| Status of method: | A sampling and analytical method which has been subjected to the established evaluation procedures of the Organic Methods Evaluation Branch. |
| Date: April 1986 | Chemist: Kevin J. Cummins |
OSHA Analytical Laboratory
Salt Lake City, Utah
1. General Discussion
- 1.1. Background
- 1.1.1. History
The current OSHA PEL for methylene chloride is based on its toxic effects at high dose levels (Ref. 5.1.). OSHA is now reviewing this standard because of new evidence obtained from an animal inhalation study indicating that methylene chloride is carcinogenic to rodents (Ref. 5.2.). The goal of this study was to develop a sampling method that could be used to monitor either low or high levels of methylene chloride in the workplace for a longer period of time. This new method is designed to accommodate sampling needs for methylene chloride both at the current 500-ppm PEL level and at a much lower level in the event that a new standard is promulgated.
The sampling device recommended in this method consists of a single sample tube which contains three 350-mg sections of charcoal. A two-section sampling tube containing a large front section and a smaller back section was not evaluated because the autosampler vials used for routine analysis at the OSHA Laboratory are too small to contain 700 mg of charcoal.
The sampling capacity of this new sampling tube for methylene chloride is greater than the current NIOSH sampling method which uses two standard size (100-mg front and 50-mg back sections) coconut shell charcoal tubes in series. The recommended air volume that can be sampled with the new method is 10 L, while the maximum recommended air volume for the NIOSH method is only 2.5 L (Ref. 5.3.).
The sampling capacity of the NIOSH method is inadequate at high humidity. An immediate breakthrough of both methylene chloride and methyl chloroform from the first sample tube occurred when a test atmosphere containing PEL levels of methylene chloride and methyl chloroform was sampled at 80% relative humidity (Section 2.4.). Reduced sampling capacity for methylene chloride with high humidity has also been reported in another study investigating the collection of solvent mixtures on charcoal (Ref. 5.5.).
Since the recommended sampling tube contains a comparatively large amount of charcoal, migration of methylene chloride to the backup charcoal section upon storage is minimized (Section 4.7.). Sample migration is a more severe problem with the NIOSH method, and is prevented by separating the two sample tubes following sampling. Air samples collected with the NIOSH method under conditions of high humidity and high exposure will result in sample breakthrough to the second tube. Under these circumstances, migration of methylene chloride to the back section of the second sample tube will occur during storage. Consequently, the amount of methylene chloride measured in this section after storage could be due to either sample breakthrough, or sample migration.
The desorption of the large charcoal sections used in the recommended sampling method produces a significant amount of heat which results in the volatilization of carbon disulfide and methylene chloride. Low sample recoveries and poor reproducibility are observed if samples are analyzed with standards prepared in carbon disulfide alone. Analytical standards for this method are prepared over charcoal in order to eliminate the need to correct for methylene chloride losses in the samples.
1.1.2. Toxic effects (This section is for information only and should not be taken as the basis of OSHA policy.)
The current permissible exposure limit (PEL) for methylene chloride is 500 ppm for an 8-h time weighted average (TWA) exposure. The standard also includes a 1000 ppm ceiling, and a maximum peak of up to 2000 ppm for 5 min in a 2-h period. In 1976, NIOSH recommended that the PEL be reduced to 75 ppm for a work shift of up to 10 h per day, 40 h per week, with a 500-ppm short-term exposure limit (STEL) over a 15-min period. These recommendations were based on evidence which indicates that methylene chloride can cause central nervous system effects and elevated carbon monoxide levels in the blood (Ref. 5.1.).
Methylene chloride is a volatile liquid which is readily absorbed into the body by the lung. The odor threshold in humans varies, but above 300 ppm it is easily detectable by most individuals (Ref. 5.5.). Methylene chloride is absorbed through the skin and can produce dermatitis (Ref. 5.6.). It is also an irritant, and can produce burns if splashed on the skin or in the eyes and not promptly removed. In high doses methylene chloride is a mild narcotic. Its use in painting has been reported to cause "headaches, giddiness, stupor, irritability, numbness, and tingling in the limbs" (Ref. 5.5.). High exposures to methylene chloride have been reported to cause death in industrial situations. However, if the exposure is terminated before anesthetic death occurs, a complete recovery is observed. Prolonged exposure to high concentrations of methylene chloride has resulted in liver and kidney changes in some species of animals. Cats exposed to 7200 ppm of methylene chloride for 4 to 8 days over a 4 week period had kidney and liver changes. Dogs and guinea pigs exposed to 10,000 ppm methylene chloride for 4 h a day for 7-1/2 weeks suffered liver injuries, although monkeys, rats and rabbits were not similarly affected.
Liver changes in rats have been reported upon exposure to 500-3500 ppm methylene chloride for 6 h per day, five days per week for up to two years. Workers exposed to both methylene chloride and methanol have been reported to suffer liver disease which was attributed to the methylene chloride. (Ref. 5.5)
Methylene chloride is metabolized in the liver to carbon monoxide via a P-450-mediated microsomal oxidation pathway (Ref. 5.7.). Some metabolic activity also occurs in the lung and kidney. The resultant CO produced from the metabolism of methylene chloride binds with hemoglobin in the blood to produce carboxyhemoglobin. The elevated carboxyhemoglobin levels produced from methylene chloride exposure can place an added burden on persons who have an inadequate cardiovascular system. NIOSH recognized the additional hazard of a methylene chloride exposure in the presence of CO by incorporating in their recommendation for a standard a formula for methylene chloride exposure which was dependent on the level of CO present in the air (Ref. 5.1.).
Methylene chloride may also be metabolized in humans to CO2 via a glutathione-dependent enzyme system which is present in the cytosol fraction of the cell (Ref. 5.7.). The extent of metabolism of methylene chloride in humans via the cytosolic mechanism is unclear.
EPA recently reported that methylene chloride cannot be classified as a human carcinogen using the International Agency for Research on Cancer (IARC) criteria. They concluded that additional testing is needed to "clarify more adequately the carcinogenic potential of DCM for humans." (Ref. 5.7.) Since the release of this EPA report, an inhalation study of methylene chloride with mice and rats at levels ranging from 0 to 4,000 ppm methylene chloride for 6 h per day, five days per week for 102 weeks has been completed. It was concluded from this study that "there was some evidence of carcinogenicity of dichloromethane for male F344/N rats as shown by increased incidence of benign neoplasms of the mammary gland. There was clear evidence of carcinogenicity of dichloromethane for female F344/N rats as shown by increased incidence of benign neoplasms of the mammary gland. There was clear evidence of carcinogenicity of dichloromethane for male and female B6C3F1 mice, as shown by increased incidences of alveolar/bronchiolar neoplasms and of hepatocellular neoplasms." (Ref. 5.2.) EPA is currently re-evaluating the carcinogenic status of methylene chloride based on this new information.
1.1.3. Potential workplace exposure
Methylene chloride is produced either by the chlorination of methane, or by the hydrochlorination of methanol to methyl chloride with the subsequent chlorination of methyl chloride. In 1984 a total of 607 million lbs of methylene chloride were produced in the United States (Ref. 5.8.). Methylene chloride is used mainly as a solvent in paint removers, as a propellant in aerosol preparations, as a solvent degreasing agent, and as a foam blowing agent. Industries which use methylene chloride include the pharmaceutical, electronics, synthetic fiber, photographic film, plastics, adhesives, and ink industries. Recently an EPA study estimated that 1.02 million workers in the United States are exposed to methylene chloride (Ref. 5.10.). This number differs greatly from an earlier NIOSH estimate of 70,000 (Ref. 5.1.).
1.1.4. Physical properties (Ref. 5.10. unless indicated otherwise)
| CAS no.: | 75-09-2 |
| molecular weight: | 84.92 |
| boiling point (760 mm Hg): | 40.4°C |
| specific gravity (20°C): | 1.320 |
| flash point: | none |
| explosive limits
(25°C, volume in air): |
14-25% |
| solubility (H2O, 20°C): | 13.2 g/kg |
| vapor pressure (0°C): | 147 mm Hg |
| (20°C): | 349 mm Hg |
| (30°C): | 511 mm Hg |
| odor: | penetrating, ether-like |
| synonyms (Ref. 5.1.): | dichloromethane, methylene dichloride, methylene bichloride |
| molecular formula: | CH2Cl2 |
1.2. Limit defining parameters (The analyte air concentrations listed throughout this method are based on an air volume of 10 L and a 1-mL desorption volume. Air concentrations listed in ppm are referenced to 25°C and 760 mm Hg.)
- 1.2.1. Detection Limit of the analytical procedure
The detection limit of the analytical procedure is 0.99 ng per injection. This is the amount of analyte which gives a peak height which is approximately 5 times the height of a nearby peak. (Section 4.1.)
1.2.2. Detection limit of the overall procedure
The detection limit of the overall procedure is 0.99 µg per sample (29 ppb or 94 µg/m3). This is the amount of analyte spiked on the sampling device which allows recovery of an amount of analyte equivalent to the detection limit of the analytical procedure. (Section 4.2.)
1.2.3. Reliable quantitation limit
The reliable quantitation limit is 0.99 µg per sample (29 ppb or 94 µg/m3). This is the smallest amount of analyte which can be quantitated within the requirements of a recovery of at least 75% and a precision (±1.96 SD) of ±25% or better. (Section 4.2.)
The reliable quantitation limit and detection limits reported in the method are based upon optimization of the instrument for the smallest possible amount of analyte. When the target concentration of an analyte is exceptionally higher than these limits, they may not be attainable at the routine operating parameters.
- 1.2.4. Sensitivity
The sensitivity of the analytical procedure over a concentration range representing 0.5 to 2 times both target concentrations based on the recommended air volume is 200 area units per µg/mL. (Section 4.4.) The sensitivity will vary with the particular instrument used in the analysis.
1.2.5. Recovery
The recovery of methylene chloride from samples collected at the 1 and 500 ppm level at 80% RH and used in a 17-day storage test remained above 90.5% and 101% respectively. (Section 4.7.) The recovery of analyte from the collection medium during storage must be 75% or greater.
1.2.6. Precision (analytical method only)
The pooled coefficients of variation obtained from replicate determinations of analytical standards at 0.5, 1, and 2 times the target concentration are 0.017 and 0.008 at the 1- and 500-ppm levels respectively. (Section 4.3.)
1.2.7. Precision (overall procedure)
The precision at the 95% confidence level obtained from the ambient storage tests of samples collected at 80% RH are ±12.1% and ±11.0% at the 1- and 500-ppm levels respectively (Section 4.7.). This includes an additional 5% for sampling error. The overall procedure must provide results at the target concentration that are ±25% or better at the 95% confidence level.
1.2.8. Reproducibility
Six samples, spiked by liquid injection, and a draft copy of this procedure were given to a chemist unassociated with this evaluation. The average recovery was 99.0% with a standard deviation of 3.8%. (Section 4.8.)
1.3. Advantages
- 1.3.1. A 10-L air volume can be sampled with this method.
1.3.2. The analysis is sensitive and precise over a broad range of exposures.
1.4. Disadvantages
The sample tubes are not commercially available at the present time.
2. Sampling Procedure
- 2.1. Apparatus
- 2.1.1. Samples are collected with a personal sampling pump that
can be calibrated within ±5% of the recommended flow rate with the
sampling tube in line.
2.1.2. Samples are collected on 6-mm i.d. × 8-mm o.d. × 13 cm long glass tubes packed with three sections of 350 mg lot 120 coconut shell charcoal (SKC Inc., Eighty-Four, PA). Small silanized glass wool plugs are used to separate and contain the charcoal within the sample tube.
2.2. Reagents
None required
2.3. Sampling technique
- 2.3.1. Attach the sampling tube to the sampling pump with
flexible tubing and place the sample tube in the employee's
breathing zone. Record the time at which sampling was initiated.
2.3.2. After sampling, remove the sample tube and firmly place plastic caps on both ends of the sample tube. Record the time at which sampling was completed.
2.3.3. Seal the sample tube with OSHA Form 21 seals in such a manner that the caps cannot be removed without breaking the seal.
2.3.4. Submit a least one blank sample tube with each sample set.
2.3.5. Record the sample air volumes (in liters of air) for each sample, and list any potential interferences.
2.4. Breakthrough
The sampling capacity of the front and middle 350-mg sections of the recommended sample tube was determined by sampling a test atmosphere of 1000 ppm methylene chloride at ambient temperature (22°C) and 80% RH. The 5% breakthrough air volume was determined to be 22.4 L. This is the air volume sampled that results in an downstream concentration which is 5% of the upstream concentration. These results are presented in Section 4.5., and a representative breakthrough curve is shown in Figure 4.5.
2.5. Desorption efficiency
The average desorption efficiencies of a 350-mg section of coconut shell charcoal at the 1- and 500-ppm level were 87.2% and 91.4% respectively. These values were determined relative to standards prepared in the absence of charcoal. Because the desorption of the large charcoal sections produces a large amount of heat, some carbon disulfide, methylene chloride, and internal standard are lost due to evaporation. The results reported here reflect losses due both to evaporation and to adsorption. These desorption efficiency results are not used in the determination of sample results since standards are prepared over charcoal in order to obtain consistency between both samples and standards. (Section 4.9.)
2.6. Stability of desorbed samples
The stability of desorbed samples was determined by reanalyzing storage samples which were first analyzed the previous day. The original analysis resulted in an average recovery of 105% (Section 4.5.). Reanalysis of these samples resulted in an average recovery of 108% (Section 4.6.).
2.7. Recommended air volume and sampling rate
- 2.7.1. The recommended air volume is 10 L.
2.7.2. The recommended sampling rate is 0.05 L/min.
2.8. Safety precautions (sampling)
- 2.8.1. Attach the sampling equipment to the employees in a
manner that will not interfere with work performance or safety.
2.8.2. Follow all safety procedures that apply to the work area being sampled.
3. Analytical Procedure
- 3.1. Apparatus:
- 3.1.1. A GC equipped with an FID detector. A Hewlett-Packard
Model 5840A GC was used in this evaluation.
3.1.2. A GC column capable of separating methylene chloride from the solvent and any interferences. A 20-ft × 1/8 in. stainless steel column packed with 10% SP-1000 on 80/100 mesh Supelcoport was used in this evaluation.
3.1.3. An electronic integrator or some other suitable means of measuring peak areas or peak heights. The HP Model 5840A GC equipped with an integration system was used in this evaluation.
3.1.4. Auto sampler vials with a minimum internal volume of 1.8 mL. Glass crimp-top vials for use with Hewlett-Packard autosamplers were used in this evaluation.
3.1.5. Various pipets, syringes and volumetric flasks were used for standard preparation.
3.1.6. A 1-mL dispenser for adding carbon disulfide to the sample vials was used in this evaluation.
3.1.7. A 1-mL syringe was used to transfer standard solutions to the autosampler vials.
3.1.8. A 3/4-in. × 5-in. × 12-in. aluminum block containing an 11-mm diameter × 20-mm deep holes was used as a sample tray holder for the desorption of samples and the preparation of standards. The aluminum tray was used to help maintain the samples at reduced temperature during the desorption process.
3.2. Reagents
- 3.2.1. Methylene chloride was used for standard preparation and
for vapor generation. Methylene chloride, Mallincrodt Inc. Chromar
Grade (Paris, Ky) was used in this evaluation.
3.2.2. Carbon disulfide containing 1 µL of cymene per mL of carbon disulfide was used for sample desorption. Glass-distilled carbon disulfide obtained from EM Science (Cherry Hill, NJ) and p-cymene from Eastman Kodak (Rochester, NY) were used in this evaluation.
3.3. Standard preparation
- 3.3.1. Prepare concentrated stock solutions of methylene
chloride in carbon disulfide using pipets or microliter syringes to
add the methylene chloride to volumetric flasks. Dilute the stock
solution in volumetric flasks with the carbon disulfide desorbing
solution to obtain at least three standard solutions in a
concentration range of approximately 0.5 to 2 times the PEL.
3.3.2. Transfer 350-mg portions of coconut shell charcoal of the same lot used to collect the air samples to autosampler vials. Place a crimp cap over each vial (do not seal the vials), and then place the vials in an aluminum sample tray in a freezer for cooling.
3.3.3. Remove the aluminum sample tray from the freezer after allowing the vials to thoroughly cool (minimum of 30 min). Use a 1-mL syringe to slowly add 1.0 mL of standard solution to each standard vial at a maximum flow rate of 0.1 mL/s to avoid sample loss from overheating.
3.3.4. Seal the vials with crimp caps and shake the vials vigorously for 3 to 5 s. Wait 30 min, reshake them and place them in the GC autosampler tray for analysis.
3.3.5. Ensure that the amount of methylene chloride found in the sample is within the range of the standards. Prepare additional standards if necessary.
3.4. Sample preparation
- 3.4.1. Carefully transfer each section of the sample tube to
separate vials. Remove the plastic cap from the sample tube
carefully to avoid loss of charcoal since the sample tube may be
under pressure. Discard the glass wool plugs used to separate the
sample sections.
3.4.2. Place a crimp cap over each sample vial (do not seal the vials) and place the sample vials in an aluminum sample tray holder in the freezer along with the standard vials containing charcoal.
3.4.3. Remove the aluminum sample tray from the freezer after allowing the vials to thoroughly cool (minimum of 30 min). Use a 1-mL dispenser to slowly add 1.0 mL of the desorbing solution to each sample vial at a maximum flow rate of 0.1 mL/s to avoid sample loss from overheating.
3.4.4. Seal the vials with crimp caps and shake the vials vigorously for 3 to 5 s. After allowing the vials to sit for 30 min, reshake them and place them in the GC autosampler tray for analysis.
3.5. Analysis
GC conditions
| zone temperatures | |
| oven: | 100°C for 5 min, program to 180°C at 20°C/min, hold for 5 min |
| injector: | 175°C |
| detector: | 200°C |
| carrier gas flow rates: | 25 mL/min (nitrogen) |
| detector gas flow rates: | 22 mL/min (hydrogen) 250 mL/min (air) |
| injection volume: | 1 µL |
| column: | 20-ft × 1/8-in o.d. stainless steel, 10% SP-1000 on 80/100 mesh Supelcoport |
| retention times: | |
| methylene chloride: | 6.0 min |
| cymene: | 12.0 min |
| chromatograms: | Figures 3.5.1. and 3.5.2. |
3.6. Interferences (analytical)
- 3.6.1. Ensure that potential interferences reported by the
industrial hygienist do not interfere with the analysis.
3.6.2. If possible, modify GC parameters to eliminate interferences.
3.7. Calculations
- 3.7.1. Prepare a calibration curve by plotting µg/mL of
methylene chloride observed versus µg/mL of methylene chloride
expected. A linear least squares fit is used to determine the
concentration of methylene chloride in each sample.
3.7.2. Determine the total mass of methylene chloride per sample by summing the amounts of methylene chloride found in the front, middle, and back sections. Subtract the amount found in the blank, if any, from this total.
3.7.3. Calculate the air concentration for each sample using the following formulae. No desorption efficiency correction is applied to these results since standards are prepared over charcoal.
mg/m3 = (µg methylene chloride)/(liters of air sampled)
ppm = (mg/m3)(24.46)/(84.92)
| where | 24.46 is the molar volume at 25°C and 760 mm
Hg 84.92 is the molecular weight of methylene chloride |
3.8. Safety precautions (analytical)
- 3.8.1. Avoid skin contact and inhalation of all chemicals.
3.8.2. Restrict the use of chemicals to a fume hood if possible.
3.8.3. Wear safety glasses and a lab coat at all times while in the lab area.
4. Backup Data
- 4.1. Detection limit of the analytical procedure
The detection limit of the analytical procedure is 0.99 ng per injection. This is the amount of analyte which gives a peak whose height is approximately 5 times the height of a nearby peak. This result is based on a 1-µL injection of a standard solution as recommended in the analytical procedure. A chromatogram of the detection limit is shown in Figure 4.1.
4.2. Detection limit of the overall procedure and reliable quantitation limit data
The detection limit of the overall procedure and the reliable quantitation limit are 0.99 µg per sample (29 ppb or 94 µg/m3). An injection size of 1 µL, as recommended in the analytical procedure, was used in this determination. Six vials, each containing 350 mg of lot 120 coconut shell charcoal, were spiked with 7.5 µL of a 132.5 µg/mL methylene chloride standard (0.99 µg), and then analyzed several hours later.
Detection limit of the Overall Procedure
and Reliable Quantitation Limit Data
|
| ||||
| µg recovered | % recovery | statistics | ||
|
| ||||
| 0.95 | 95.6 | |||
| 1.04 | 105 | |||
| 0.95 | 95.6 | = | 97.8 | |
| 0.95 | 95.6 | SD | = | 3.9 |
| 0.95 | 95.6 | 1.96 SD | = | 7.6 |
| 0.99 | 95.6 | |||
|
| ||||
4.3. Precision
The precision of the analytical method was determined at both 1 and 500 ppm for methylene chloride. Standards prepared at 0.5, 1, and 2 times the target concentration were each injected six times. The precision for this method was improved with the use of an internal standard. Therefore, the results reported in Tables 4.3.1. and 4.3.2. are expressed in concentration units and have been corrected by the internal standard.
Precision Data (0.5 to 2 ppm)
|
| |||
| × target conc. | 0.5× | 1× | 2× |
| µg/mL | 18.56 | 37.11 | 74.23 |
|
| |||
| amount found, | 18.56 | 36.77 | 71.47 |
| µg/mL | 18.68 | 37.07 | 71.54 |
| 18.46 | 36.95 | 71.91 | |
| 19.33 | 37.27 | 72.46 | |
| 19.42 | 37.05 | 72.30 | |
| 19.35 | 36.88 | 72.04 | |
| 18.97 | 37.00 | 71.95 | |
| SD | 0.44 | 0.17 | 0.40 |
| CV | 0.023 | 0.0047 | 0.0055 |
|
| |||
Precision Data (250 to 1000 ppm)
|
| |||
| × target conc. | 0.5× | 1× | 2× |
| µg\mL | 8615 | 17230 | 33140 |
|
| |||
| amount found, | 8884 | 17230 | 35360 |
| µg/mL | 8797 | 17240 | 35270 |
| 8814 | 17220 | 35050 | |
| 8741 | 17190 | 36100 | |
| 8752 | 17220 | 36000 | |
| 8615 | 17120 | 35970 | |
| 8803 | 17200 | 35630 | |
| SD | 53 | 44 | 450 |
| CV | 0.0060 | 0.0026 | 0.013 |
|
| |||
4.4. Sensitivity data
The sensitivity over the range of 0.5 to 1000 ppm is about 200 area counts per µg/mL of methylene chloride. This is the slope obtained from a linear plot of concentration of methylene chloride versus response in area units. (Figures 4.4.1. and 4.4.2.)
4.5. Breakthrough
Sample capacity was determined by placing an adsorbent tube or section of adsorbent in the sample stream, and then measuring the concentration of methylene chloride in the effluent with a gas chromatograph equipped with a gas sampling valve. The GC was equipped with a 10-ft × 1/8-in. o.d. stainless steel column packed with 10% SP-1000 on 80/100 mesh Supelcoport. The injector, oven, and detector temperatures were 150°C, 110°C, and 200°C respectively. Nitrogen was used as the carrier gas at a flow rate of about 20 mL/min. Hydrogen and air flow rates were 30 and 250 mL/min respectively for the FID detector.
The sample capacity of coconut shell charcoal for methylene chloride at low levels is not greatly affected by the presence of other solvents in the atmosphere. Reported in Table 4.5.1. are the 5% breakthrough air volumes determined with 100-mg front sections of SKC lot 120 coconut shell charcoal sample tubes obtained by sampling test atmosphere mixtures of methylene chloride in the presence of either toluene, isopropanol, or methyl chloroform. The 5% breakthrough air volume at 80% RH and ambient temperature (23.5°C) for the front section of a lot 120 SKC coconut shell charcoal sample tube was 7.2 L with a 2.6 ppm methylene chloride atmosphere, and 6.6 L with a test atmosphere of 2.4 ppm methylene chloride containing 150 ppm toluene. Breakthrough air volumes obtained from sampling a test atmosphere of 90 ppm methylene chloride in the presence of either 150 ppm toluene, 150 ppm isopropanol, or 120 ppm methyl chloroform ranged from 4.7 to 5.0 L.
Capacity of the Front Section of Lot 120 SKC Sample Tube (100 mg)
(80% RH and Ambient Temperature)
|
| |||
| methylene chloride | additional solvent | 5% breakthrough | |
| (ppm) | (ppm) | volume (L) | |
|
| |||
| 2.4 | 0 | 7.2 | |
| 2.4 | 150 | (toluene) | 6.6 |
| 13 | 0 | 7.6 | |
| 13 | 150 | (toluene) | 5.9 |
| 90 | 0 | 5.0 | |
| 90 | 150 | (toluene) | 5.0 |
| 90 | 150 | (isopropanol) | 4.8 |
| 90 | 150 | (methyl chloroform) | 4.7 |
|
| |||
Breakthrough studies were performed with a number of adsorbents in an effort to find an adsorbent which would have a higher capacity than coconut shell charcoal for methylene chloride. Petroleum base charcoal was found to have a lower capacity for methylene chloride than coconut shell charcoal. Ambersorb XE-347, a synthetic carbonaceous adsorbent, had a sample capacity considerably less than coconut shell charcoal at low relative humidity. At high relative humidity the sample capacities of both coconut shell charcoal and the Ambersorb material were similar, since the sample capacity of Ambersorb XE-347 was not affected by the presence of water. Carbotrap, a graphitized carbon black, had no measurable capacity for methylene chloride.
The effects of increased relative humidity on the sampling capacity of coconut shell charcoal are reported in Table 4.5.2. The 5% breakthrough air volume for a standard size SKC sample tube (both front and back sections) was 7.7 L when used to sample an atmosphere containing 610 ppm methylene chloride and 310 ppm methyl chloroform at low relative humidity (7%). At high relative humidity (80%), approximately 30% of the concentration of both methylene chloride and methyl chloroform passed through the sampler within a period of 3 min or less. Consequently the use of two standard size sample tubes in series will result in immediate breakthrough to the second sample tube under these conditions.
Capacity of Lot 120 SKC Sample Tube (100-mg Front/50-mg Back
Section) at Different Levels of Relative Humidity
(720 ppm Methylene Chloride/310 ppm Methyl Chloroform)
|
| |
| relative humidity | 5% breakthrough |
| (%) | volume (L) |
|
| |
| 7 | 7.7 |
| 37 | 7.8 |
| 80 | immediate breakthrough |
|
| |
The capacity of both the front and middle 350-mg sections of the recommended sampling tube for this method was determined with a test atmosphere of 1000 ppm methylene chloride at ambient temperature (22°C) and 80% RH at a sampling rate of 0.11 L/min. The average 5% breakthrough air volume was determined to be 22.4 L based on two determinations. A representative breakthrough curve is shown in Figure 4.5.
The concentration of methylene chloride can vary dramatically in
the work environment during a work shift. Under these conditions a
large dose of methylene chloride can be collected on the sample tube
at the beginning of a sample period, with little or no exposure
occurring for the remainder of the sampling period. Because methylene
chloride migrates on charcoal, the ability of the recommended sampling
method to retain a large dose of methylene chloride obtained at the
beginning of the sample period was evaluated. Sample tubes which were
spiked with a mass of methylene chloride approximately equivalent to a
500-ppm, 10-L air sample were analyzed after 10 L of moist air were
drawn through them. Eighteen sample tubes were each spiked with 13.2
µL of methylene chloride and then approximately 10 L of 80% RH air at
Retention Efficiency of Sample Tube Spiked with 17.6 mg of
Methylene Chloride (10 L of 80% RH Air Sample, No Storage)
|
| |||||||||
| % recovery by section* | |||||||||
| sample no. | front | middle | total | ||||||
|
| |||||||||
| 1 | 97.0 | 0.9 | 97.9 | ||||||
| 2 | 102 | 2.3 | 104 | ||||||
| 3 | 102 | 4.2 | 106 | ||||||
| 4 | 101 | 2.6 | 104 | ||||||
| 5 | 106 | 0.1 | 106 | ||||||
| 6 | 104 | 1.0 | 105 | ||||||
| |||||||||
|
| |||||||||
| * No methylene chloride detected on back section. | |||||||||
Retention Efficiency of Sample Tube Spiked with 17.6 mg of
Methylene Chloride (10 L of 80% RH Air Sample, One-Week Storage)
|
| |||||||||
| % recovery by section* | |||||||||
| sample no. | front | middle | total | ||||||
|
| |||||||||
| 1 | 79.7 | 17.0 | 96.7 | ||||||
| 2 | 89.0 | 12.9 | 102 | ||||||
| 3 | 87.3 | 15.6 | 103 | ||||||
| 4 | 84.9 | 19.8 | 105 | ||||||
| 5 | 88.8 | 22.3 | 111 | ||||||
| 6 | 84.2 | 20.6 | 105 | ||||||
| |||||||||
|
| |||||||||
| * No methylene chloride detected on back section. | |||||||||
Retention Efficiency of Sample Tube Spiked with 17.6 mg of
Methylene Chloride (10 L of 80% RH Air Sample, Two-Week Storage)
|
| |||||||||
| % recovery by section* | |||||||||
| sample no. | front | middle | total | ||||||
|
| |||||||||
| 1 | 76.7 | 21.9 | 98.6 | ||||||
| 2 | 81.1 | 24.5 | 106 | ||||||
| 3 | 84.6 | 24.6 | 109 | ||||||
| 4 | 83.5 | 23.9 | 107 | ||||||
| 5 | 77.1 | 26.2 | 103 | ||||||
| 6 | 80.5 | 25.6 | 106 | ||||||
| |||||||||
|
| |||||||||
| * No methylene chloride detected on back section. | |||||||||
4.6. Stability of desorbed samples
The stability of desorbed samples was determined by reanalyzing samples which had been analyzed the previous day. Prior to reanalysis the samples had sat in the GC autosampler tray for about 18-24 h. For reanalysis fresh standards were prepared although the sample vials were not recapped. The average percentage recovery upon reanalysis was 108%. The average percentage recovery of the original analysis was 105% (Table 4.5.5.).
Stability of Desorbed Samples (Two-week storage samples of
Table 4.5.5. reanalyzed 18 to 24 h after initial analysis)
|
| |||||||||
| % recovery by section* | |||||||||
| sample no. | front | middle | total | ||||||
|
| |||||||||
| 1 | 88.3 | 24.4 | 113 | ||||||
| 2 | 87.1 | 25.0 | 112 | ||||||
| 3 | 85.6 | 25.3 | 111 | ||||||
| 4 | 85.1 | 24.8 | 110 | ||||||
| 5 | 67.9 | 27.2 | 95.1 | ||||||
| 6 | 83.1 | 25.4 | 108 | ||||||
| |||||||||
|
| |||||||||
| * No methylene chloride detected on back section. | |||||||||
4.7. Storage
Sample stability was determined by collecting samples from 1- and 500-ppm test atmospheres at both low (5-6%) and high (80-90%) relative humidity. The test atmospheres were generated with a vapor generation system which consisted of a source of clean, dry dilution air, a controlled-temperature water bath containing a water bubbler, a mixing chamber, and a six-port sampling manifold. Methylene chloride was metered into the system with a Sage Instruments Inc. Model 355 syringe pump (Orion Research Inc., Cambridge, MA) which was gravimetrically calibrated with isopropanol. The interior surfaces of the system consisted entirely of glass and Teflon with the exception of rubber O-rings in the valves.
High humidity conditions were prepared by passing the dilution air through the water bubbler before combining it with methylene chloride. For low humidity sampling, the water bubbler was by-passed and the dry dilution air mixed directly with the methylene chloride vapor. The 500-ppm test atmosphere was prepared by adding methylene chloride directly to the air stream. The 1 ppm test atmosphere was generated by diluting a portion of the concentrated air stream with a second volume of air, and directing the excess concentrated air stream to waste. Calibrated rotameters and mass flow meters were used to determine the air volumes used in the system. The relative humidity was monitored with an Model 911 Dew-All Digital Analyzer (EG&G, Waltham, MA).
A total of 36 samples were collected under each set of conditions
by collecting 10-L air samples at a flow rate of approximately 0.2
L/min. Six of these samples were analyzed that same day. The remaining
30 samples were split into two groups of fifteen samples for storage.
One group was stored in a laboratory drawer at ambient temperature
(21-
Storage Tests (1 ppm at 6% RH)
|
| |||||||
| storage time | % recovery | ||||||
| (days) | (refrigerated) | (ambient) | |||||
|
| |||||||
| 0 | 92.6 | 93.9 | 92.7 | 91.3 | 94.0 | 94.7 | |
| 3 | 94.7 | 97.8 | 101 | 96.2 | 98.1 | 99.1 | |
| 7 | 92.7 | 94.4 | 91.3 | 93.6 | 92.1 | 93.9 | |
| 11 | 94.4 | 94.7 | 83.0 | 92.1 | 93.9 | 94.2 | |
| 14 | 93.4 | 94.1 | 92.6 | 92.8 | 97.8 | 98.8 | |
| 18 | 90.5 | 91.0 | 86.3 | 91.8 | 84.0 | 89.7 | |
|
| |||||||
Storage Tests (1 ppm at 80% RH)
|
| |||||||
| storage time | % recovery | ||||||
| (days) | (refrigerated) | (ambient) | |||||
|
| |||||||
| 0 | 97.1 | 93.1 | 99.2 | 95.7 | 96.8 | 93.1 | |
| 3 | 93.1 | 96.3 | 96.5 | 93.6 | 96.8 | 101 | |
| 6 | 96.3 | 98.7 | 106 | 97.3 | 100 | 97.6 | |
| 10 | 94.7 | 94.7 | 86.9 | 95.5 | 86.9 | 84.8 | |
| 14 | 89.3 | 94.4 | 94.7 | 91.5 | 93.6 | 88.8 | |
| 17 | 91.2 | 92.5 | 88.5 | 93.9 | 94.9 | 85.6 | |
|
| |||||||
Storage Tests (500 ppm at 5% RH)
|
| |||||||
| storage time | % recovery | ||||||
| (days) | (refrigerated) | (ambient) | |||||
|
| |||||||
| 0 | 102 | 103 | 102 | 102 | 101 | 104 | |
| 3 | 104 | 104 | 102 | 100 | 94.7 | 94.0 | |
| 7 | 101 | 101 | 100 | 101 | 101 | 98.9 | |
| 10 | 102 | 103 | 103 | 103 | 101 | 104 | |
| 14 | 102 | 96.2 | 101 | 98.3 | 102 | 99.6 | |
| 17 | 103 | 101 | 99.0 | 99.6 | 98.9 | 98.6 | |
|
| |||||||
Storage Tests (500 ppm at 90% RH)
|
| |||||||
| storage time | % recovery | ||||||
| (days) | (refrigerated) | (ambient) | |||||
|
| |||||||
| 0 | 103 | 103 | 101 | 102 | 97.3 | 97.3 | |
| 3 | 97.3 | 97.3 | 104 | 96.4 | 100 | 102 | |
| 6 | 104 | 104 | 102 | 101 | 100 | 99.3 | |
| 10 | 99.1 | 96.8 | 100 | 102 | 97.1 | 98.1 | |
| 13 | 106 | 103 | 99.8 | 101 | 100 | 99.6 | |
| 17 | 102 | 98.8 | 99.5 | --- | 99.1 | 97.3 | |
|
| |||||||
4.8. Reproducibility data
Six samples were prepared by injecting microliter quantities of methylene chloride into the front section of the sample tube. The samples were stored at 5°C prior to the analysis. This analysis was performed by a chemist unassociated with the evaluation. The results are given in Table 4.8.
Reproducibility
|
| |||||||||
| sample no. | µg expected | µg found | % found | ||||||
|
| |||||||||
| 1 | 5302 | 5485 | 103 | ||||||
| 2 | 10604 | 11020 | 104 | ||||||
| 3 | 13255 | 13423 | 101 | ||||||
| 4 | 13255 | 12656 | 95.5 | ||||||
| 5 | 15906 | 16150 | 102 | ||||||
| 6 | 18557 | 17641 | 95.1 | ||||||
| |||||||||
|
| |||||||||
4.9. Desorption efficiency
Desorption efficiencies were determined at both the 1 and 500 ppm level based on a 10-L air sample. At the 1-ppm level, each of six sections of 350 mg coconut-shell charcoal contained in glass vials, were spiked with 5 µL of a 7069 µg/mL solution of methylene chloride (35.3 µg) in carbon disulfide. Similarly at the 500-ppm level, each of six charcoal sections was spiked with 13.2 µL of methylene chloride (17.6 mg). After allowing the sections to sit for several hours, each sample was desorbed with carbon disulfide containing cymene as an internal standard and analyzed along with standards which were prepared in the same manner as the samples except that no charcoal was added to the standard vials. The results are reported in Table 4.9.1. These results reflect a loss due to evaporation of methylene chloride because of the heat generated in the desorption process, and not simply an adsorption effect.
Desorption Efficiency
|
| ||
| µg/sample | 35.3 | 17600 |
| ppm | 1 | 500 |
|
| ||
| desorption | 83.5 | 86.8 |
| efficiency, % | 80.1 | 84.9 |
| 99.1 | 93.0 | |
| 88.2 | 93.6 | |
| 84.6 | 94.8 | |
| 88.0 | 95.6 | |
| 87.2 | 91.4 | |
| SD | 6.5 | 4.5 |
|
| ||
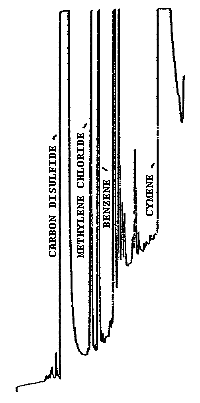
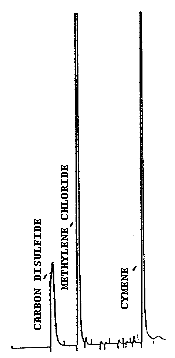

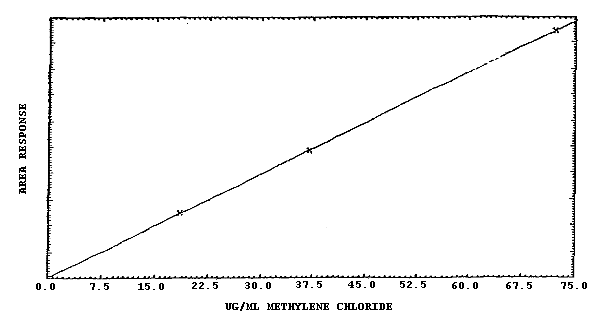
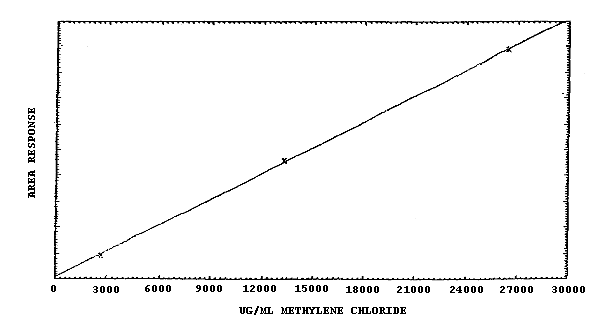
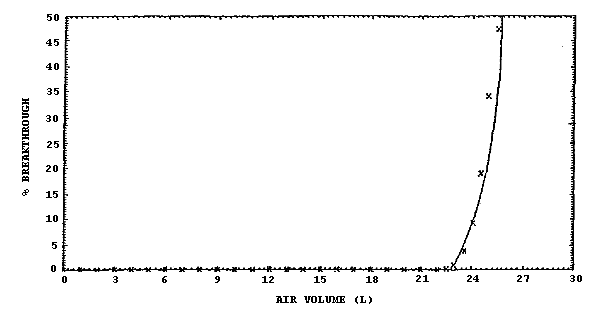
Figure 4.5. Breakthrough curve obtained using the front and middle
sections of the sampling tube to sample a 1000-ppm atmosphere of
methylene chloride at 22°C and 80% RH at a sampling rate of 0.11 L/min.
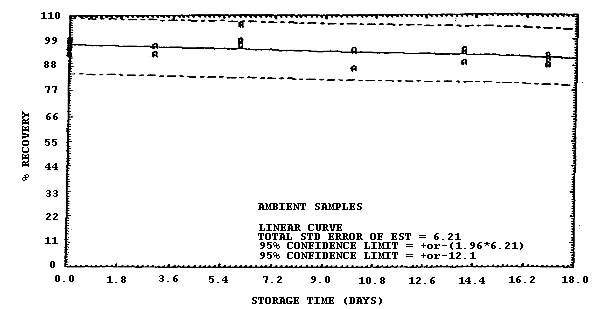
Figure 4.7.1. Ambient storage test for samples collected from a 1 ppm
atmosphere at
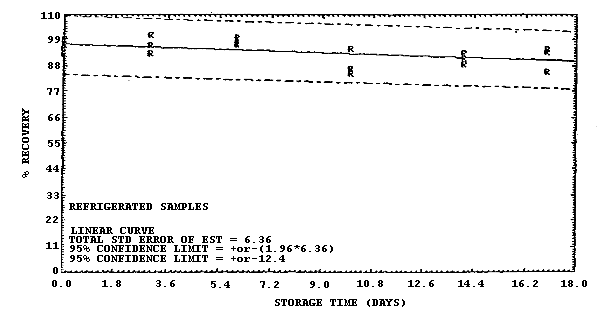
Figure 4.7.2. Refrigerated storage test for samples collected from a
1 ppm atmosphere at
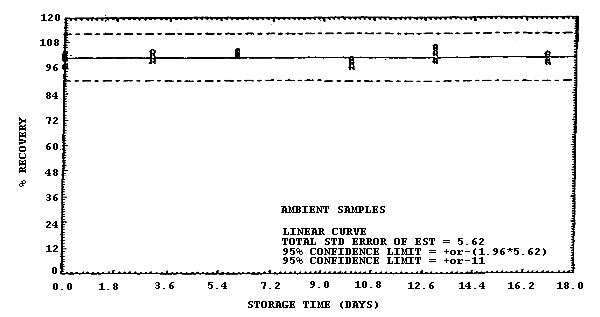
Figure 4.7.3. Ambient storage test for samples collected from a 500
ppm atmosphere at 22°C and high humidity (90% RH).
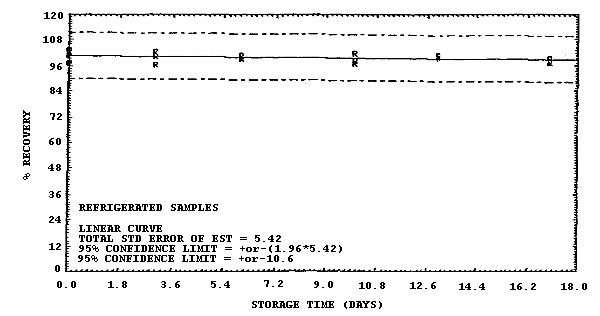
Figure 4.7.4. Refrigerated storage test for samples collected from a
500 ppm atmosphere at 22°C and high humidity (90% RH).
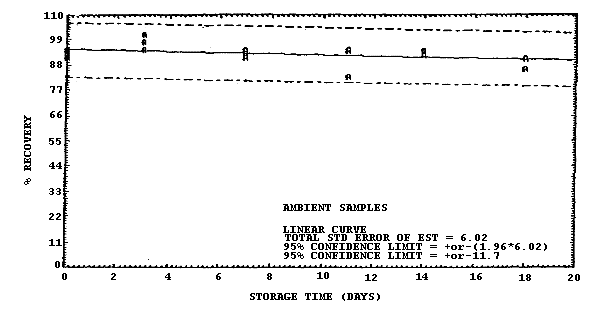
Figure 4.7.5. Ambient storage test for samples collected from a 1 ppm
atmosphere at 22°C and low humidity (6% RH).
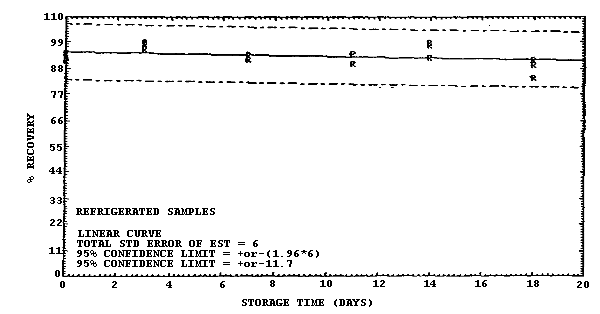
Figure 4.7.6. Refrigerated storage test for samples collected from a
1 ppm atmosphere at 22°C and low humidity (6% RH).
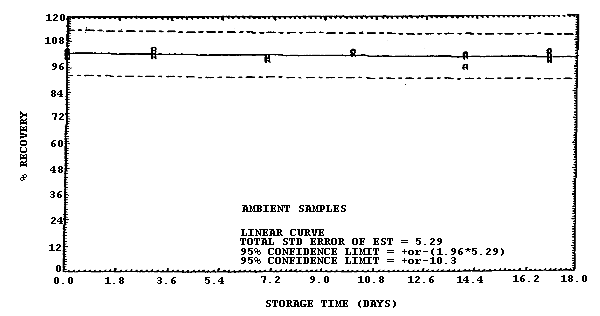
Figure 4.7.7. Ambient storage test for samples collected from a 500
ppm atmosphere at 22°C and low humidity (5% RH).
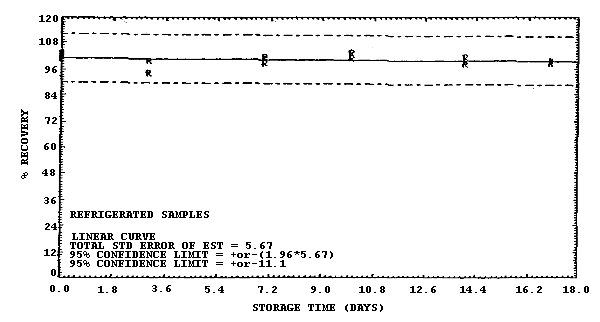
Figure 4.7.8. Refrigerated storage test for samples collected from a 500 ppm atmosphere at 22°C and low humidity (5% RH).
5. References
- 5.1. "Criteria for a Recommended Standard...Occupational Exposure
to Methylene Chloride", U.S. Department of Health, Education, and
Welfare, National Institute for Occupational Safety and Health:
Cincinnati, OH, 1976.
5.2. "National Toxicology Program. 1985 NTP Technical Report on the Toxicology and Carcinogenesis Studies of Dichloromethane in F344/N Rats and B6C3F1 Mice.", U.S. Department of Health and Human Services, Public Health Service, National Institutes of Health.
5.3. "NIOSH Manual of Analytical Methods", 3rd ed.; U.S. Department of Health and Human Services, Public Health Service, Centers for Disease Control, NIOSH: Cincinnati, OH, Feb. 1984; Vol. 2, Method 1005.
5.4. Otson, R.; Williams, D. T.; Bothwell, P. D. Am. Ind. Hyg. Assoc. J., 1983, (44), 489-494.
5.5. "Documentation of the TLV, Supplemental Document 1981", 4th ed.; American Conference of Governmental Industrial Hygienists: Cincinnati, OH, 276-277.
5.6. "Occupational Health Guideline for Methylene Chloride", National Institute for Occupational Safety and Health, Department of Health and Human Services, Public Health Service, Centers for Disease Control, Sept. 1978.
5.7. "Health Assessment Document for Dichloromethane (Methylene Chloride)", U.S. Environmental Protection Agency, Office of Health and Environmental Assessment: Washington, D.C., Dec. 1984.
5.8. Chem. Eng. News, Dec. 6, 1985, p. 12.
5.9. "Occupational Exposure and Environmental Release Assessment of Methylene Chloride", U.S. Environmental Protection Agency, Office of Pesticides and Toxic Substances: Washington D.C., PEI Associates Inc.: Cincinnati, OH, Contract No. 68-02-3935.
5.10. Anthony, T. In "Kirk-Othmer Encyclopedia of Chemical Technology"; Grayson, Martin, Ed.; John Wiley & Sons: New York, NY, Vol. 5, pp. 686-693.