GLUTARALDEHYDE
| Method number: | 64 |
| Matrix: | Air |
| Target concentration: | 200 ppb (820 µg/m3) |
| ACGIH TLV-Ceiling: | 200 ppb (820 µg/m3) |
| OSHA PEL: | None |
| (Additional data, 1997) | |
| Target concentrations: | 10 ppb (41µg/m3)
(for short-term samples, (STS)) 2 ppb (8.2 µg/m3) (for long-term samples, (LTS)) |
| Procedure: | An air sample is collected by drawing a known volume
of air through an |
| Recommended air volume and sampling rates: 200-ppb ACGIH Ceiling: |
15 L at 1 L/min |
| (Additional data, 1997) | |
| 10-ppb STS: | 30 L at 2 L/min |
| 2-ppb LTS: | 480 L at 2 L/min |
| Reliable quantitation limits: 200-ppb ACGIH TLV-Ceiling: |
4.4 ppb (18 µg/m3) |
| (Additional data, 1997) | |
| 10-ppb STS: | 0.44 ppb (1.8 µg/m3) |
| 2-ppb LTS: | 0.027 ppb (0.11 µg/m3) |
| Standard errors of estimate at the target concentration: 200-ppb ACGIH TLV-Ceiling: |
6.2% |
| (Additional data, 1997) | |
| 10-ppb STS: | 6.6% |
| 2-ppb LTS: | 6.7% |
| Special requirements: (Additional data, 1997) |
Ship samples suspected of containing low levels of
glutaraldehyde (such as |
| Status of method: | Evaluated method. This method has been subjected to the established evaluation procedures of the Organic Methods Evaluation Branch. Additional evaluation data were collected in 1997 because of increased interest in monitoring lower levels. |
| Date: June 1987 Additional data: January 1998 |
Chemist: Warren Hendricks |
Organic Methods Evaluation Branch
OSHA Salt Lake
Technical Center
Salt Lake City, Utah 84115-1802
1. General Discussion
- Clean glass distillation equipment is preferred.
- Use Teflon fittings or other air tight fittings.
- DO NOT USE ground glass joints.
- DO NOT USE joint greases, especially silicone greases.
- The distillation column needs only 2 or 3 theoretical plates.
- Need the capability to change out receiving vessels quickly to separate the forecut from the mid cut.
- Pour the sample of Santoflex 6PPD into the distillation flask.
- Connect and secure the distillation column and receiving flasks.
- Flush the system with dry nitrogen to purge any oxygen in the system.
- Close the system, begin heating the sample using a heating mantle. Do not use a flame, as this can create hot spots and degrade the sample.
- Apply a vacuum. Santoflex 6PPD has the following vapor pressures at the temperatures given:
- Once Santoflex 6PPD begins to boil, allow a small portion of material to collect in the receiving flask as a forecut. This will contain some Santoflex 6PPD as well unreacted 4ADPA and ketones among other light materials.
- You should collect no more than 5-l0% of the starting material in the forecut.
- Change out the receiving flask after the forecut. If the vacuum seal must be broken continue heating, but purge the system with nitrogen while the flask is being replaced. Be sure the new flask is purged with nitrogen before resealing and reapply the vacuum.
- Continue to collect distilled material in the new flask. Collect about 50-75% of the starting material volume in the receiving flask.
- Discontinue heating. Allow nitrogen to fill the distillation equipment.
- While still warm, Santoflex 6PPD can be transferred to a sample bottle. Keep under nitrogen at all times.
- Distilled Santoflex 6PPD may appear water white or may have
a slight
pink-purple cast to it. It should be lighter in color than the starting material. Once oxygen comes in contact with distilled material, Santoflex 6PPD quickly discolors to a dark purple to brown/purple. Oxidized 6PPD has an intense color. Even small concentrations (ppb) greatly affect the visual appearance, but does not affect the performance. Oxidizationby-products of 6PPD are also antioxidants to some degree.
1.1 Background
1.1.1 History
This work was performed because there was no fully evaluated OSHA
method for the sampling and analysis of glutaraldehyde. This method
requires the collection of glutaraldehyde on
HOC(CH2)3COH
+ 2 (O2N)2
C6H3NHNH2
+ acid ![]()
glutaraldehyde
DNPH
(O2N)2C6H3NHN=CH(CH2)3HC=NHNC6H3(NO2)2
+ 2
H2O
glutaraldehyde-bis-DNPH
derivative
water
The analysis is performed by HPLC using UV detection.
Prior to the development of the coated-filter procedure, it was
found that glutaraldehyde could be collected directly on
An effort was also made to extend the sampling method used by
OSHA for the collection of acrolein and formaldehyde (Ref. 5.3) to
include glutaraldehyde. The basis of the method is the reaction of
Additional data, 1997
Additional evaluation data were collected in 1997 in support of
research performed by OSHA's Directorate of Policy. The research was
prompted because glutaraldehyde was identified as one of a number of
chemicals for which OSHA intends to publish a proposal to update
PELs (Ref. 7.1). The target levels,
ACGIH has published a "Notice of Intended Changes (for 1996)" to
change the
The overall appearance of this method was revised so that it would be more consistent with OME methods written according to 1993 Method Evaluation Guidelines (Ref. 7.3). The original data are intact, and new data are identified by the phrase: "(Additional data, 1997)" and use of "Modern" font. The different font is used to delineate the 1997 data from the original data. New data were collected in accordance with 1993 OME Guidelines. The original backup data and literature references sections are intact, and new backup data and literature references sections for the additional data are included. Some OME definitions and test criteria for the limit defining parameters were revised in 1993 and it may not be possible to directly compare original and new data because of the revisions. The 1987 detection and reliable quantitation limits have been superseded by the new limits.
Preliminary testing showed that, with modification, Method 64 for
glutaraldehyde was capable of monitoring the selected lower target
levels. Some instability was observed for STS stored at ambient
temperature. The recovery was 105% of theoretical at the beginning
of a
Ozone has been reported to be a significant sampling interference
in some methods which use
The design of the sampler was not altered to routinely incorporate an OSF because it is anticipated that its required inclusion will be more the exception than the rule. Most glutaraldehyde exposures are likely short term, and STS do not require an OSF. Most LTS will be collected in hospitals, and ozone levels at such facilities should be low. The industrial hygienist has the option of reducing the sample air volume size for LTS, or using an OSF, if ozone levels are sufficiently high.
This sampling and analytical method provides adequate sensitivity to work at very low levels. Working at these levels is demanding for both the industrial hygienist and the analyst because of the potential for positive, as well as negative, sampling interferences. The industrial hygienist must determine if sampling interferences are present, and then take corrective action. This action may consist simply of reporting the presence of interferences to the analytical laboratory. The analyst can better qualify sampling results with this knowledge, and perhaps suggest alternative sampling procedures.
1.1.2 Toxic effects (This section is for information only and should not be taken as the basis of OSHA policy.)
Glutaraldehyde is a strong respiratory irritant and a less severe skin and eye irritant. It can also cause allergic contact dermatitis from occasional exposure (skin sensitization). The oral LD500 for rats has been reported to be as low as 250 mg/kg. The 4-h LC50 for rats is 5000 ppm. (Ref. 5.4)
Activated glutaraldehyde, which is an aqueous solution buffered
to an alkaline pH of
The odor threshold for glutaraldehyde is about 0.04 ppm and the irritation response level is about 0.3 ppm. The ACGIH TLV-Ceiling for glutaraldehyde is 0.2 ppm because of its irritation properties, whether from activated or unactivated solutions. (Ref. 5.4)
1.1.3 Workplace exposure
Glutaraldehyde is used in water solutions of varying
concentrations as a chemical intermediate in the drug and polymer
industries, a fixative for tissues, a cross linking agent for
polyhydroxy materials and proteins, a tanning agent in the leather
industry, and a cold sterilizer in
1.1.4 Physical properties (Ref. 5.4)
| CAS no.: | 111-30-8 |
| molecular weight: | 100.12 |
| appearance: | colorless liquid often encountered in 2% and 50% aqueous solutions which have no flash points and are not flammable |
| vapor pressure | |
| 2% solution: | 0.16 Pa (0.0012 mm Hg) at 20°C |
| 50% solution: | 2.03 Pa (0.0152 mm Hg) at 20°C |
| structural formula: | HOC(CH2)3COH |
| synonym: | 1,5-pentanedial |
The analyte air concentrations listed throughout this method are based on the recommended sampling and analytical procedures. Air concentrations listed in ppb are referenced to 25°C and 101.3 kPa (760 mm Hg). The analyte concentrations are listed as glutaraldehyde even though the derivative is the actual species analyzed.
1.2 Limit defining parameters
1.2.1 Detection limit of the analytical procedure
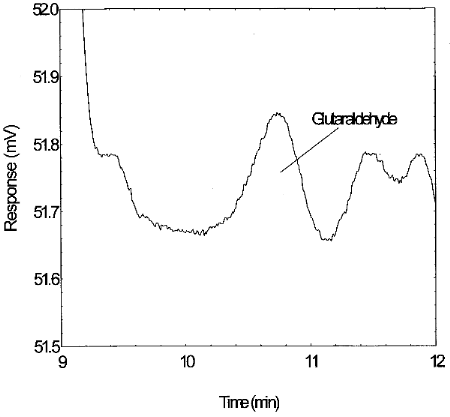
The detection limit of the analytical procedure is 1.31 ng per injection. This is the amount of analyte which will give a peak sufficiently large to permit its visual detection in the presence of interfering peaks in a sample chromatogram. (Section 4.1)
(Additional data, 1997). The detection limit of the analytical procedure is 19.1 pg. This is the amount of analyte that will give a response that is significantly different from the background response of a reagent blank. This amount supersedes the previous detection limit of the analytical procedure. (Sections 6.1 and 6.2)
1.2.2 Detection limit of the overall procedure
The detection limit of the overall procedure is 0.268 µg per sample (4.4 ppb or 18 µg/m3). This is the amount of glutaraldehyde spiked on the sampling device which allows recovery of an amount of analyte equivalent to the detection limit of the analytical procedure. (Section 4.2)
(Additional data, 1997). The detection limit of the overall procedure is 16.5 ng per sample (STS: 0.13 ppb or 0.55 µg/m3; LTS: 0.0083 ppb or 0.034 µg/m3). This is the amount of analyte spiked on a sampler that will give a response that is significantly different from the background response of a sampler blank. This amount supersedes the previous detection limit of the overall procedure. (Sections 6.1 and 6.3)
1.2.3 Reliable quantitation limit
The reliable quantitation limit is 0.268 µg per sample (4.4 ppb or 18 µg/m3). This is the smallest amount of analyte which can be quantitated within the requirements of a recovery of at least 75% and a precision (±1.96 SD) of ±25% or better. (Section 4.2)
(Additional data, 1997). The reliable quantitation limit is 55.0 ng per sample (STS: 0.44 ppb or 1.8 µg/m3; LTS: 0.027 ppb or 0.11 µg/m3). This is the amount of analyte spiked on a sampler that will give a signal that is considered the lower limit for precise quantitative measurements. This amount supersedes the previous reliable quantitation limit. (Section 6.4)
1.2.4 Instrument response to the analyte
The instrument response over the concentration range of 0.5 to 2 times the target concentration is linear. (Section 4.4)
1.2.5 Recovery
The recovery of glutaraldehyde from samples used in a 17-day storage test was essentially 100% when the samples were stored at about 23°C. (Section 4.7) The recovery of the analyte from the collection medium during storage must be 75% or greater.
(Additional data, 1997). The recoveries of glutaraldehyde from samples used in 19-day ambient storage tests remained above 84% for 10-ppb STS, and above 98% for 2-ppb LTS. The ambient storage test for STS revealed a greater than 10% decrease in recovery. An unsuccessful attempt was made to develop a convenient alternative sampler which alleviated the storage loss. Samples suspected of containing low levels of glutaraldehyde (such as 10-ppb STS) should be shipped in an insulated container using Blue IceTM (or equivalent) by overnight delivery service (FedExTM, or equivalent). LTS exhibited adequate storage stability. (Section 6.7)
1.2.6 Precision (analytical procedure)
The pooled coefficient of variation obtained from replicate determinations of analytical standards at 0.5, 1, and 2 times the target concentration is 0.024. (Section 4.3)
(Additional data, 1997). The precision of the analytical procedure, measured as the pooled relative standard deviation, over a concentration range equivalent to 0.5 to 2 times the target concentration is 0.69% for 10-ppb STS. The precision of the analytical procedure, measured as the pooled relative standard deviation, over a concentration range equivalent to 0.5 to 2 times the target concentration is 0.83% for 2-ppb LTS. (Section 6.5)
1.2.7 Precision (overall procedure)
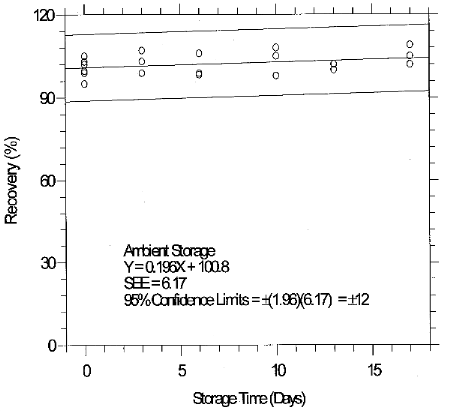
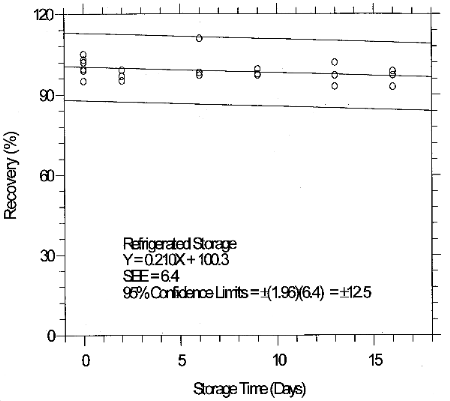
The precision at the 95% confidence level for the 17-day ambient temperature storage test is ±12%. (Section 4.7) This includes an additional ±5% for sampling error. The overall procedure must provide results at the target concentration that are ±25% or better at the 95% confidence level.
(Additional data, 1997). The precessions of the overall procedure at the 95% confidence level for the 19-day refrigerated storage tests were ±12.9% for 10-ppb STS and ±13.4% for 2-ppb LTS. These each include an additional 5% for sampling error. (Section 6.7)
1.2.8 Reproducibility (sampling)
Six samples, collected from a controlled test atmosphere, and a draft copy of this procedure were given to a chemist unassociated with this evaluation. The samples were analyzed immediately after generation. No individual sample deviated from its theoretical value by more than the ±12% precision reported in Section 1.2.7 (Section 4.8.)
(Additional data, 1997). Twelve samples (6-STS and 6-LTS) were collected from test atmospheres and were submitted for analysis by SLTC. The samples were analyzed according to instructions in a draft copy of this procedure following 10 and 3 days (respective) of storage at about 4°C. No individual sample result differed from its theoretical value by more than the respective precessions reported in Section 1.2.7. (Section 6.8)
1.3 Advantage
This sampling and analytical procedure provides a simple, convenient, and precise means to monitor occupational exposure to glutaraldehyde vapors and aerosols.
1.4 Disadvantage
The coated filters are currently not commercially available.
(Additional data, 1997). The coated filters are now commercially available. The OSFs are not currently commercially available.
2. Sampling Procedure
2.1 Apparatus
2.1.1 Samples are collected by use of a personal sampling pump that can be calibrated to within ±5% of the recommended flow rate with the sampling device attached.
2.1.2 A sample is collected using an open-face air monitoring cassette containing 2 glass-fiber filters. The filters are separated and retained using cassette rings (See Figure 2.1.2). Each filter is coated with DNPH and phosphoric acid. Instructions for the preparation of the coated filters and assembly of the sampler are given in Section 4.11 of this method.
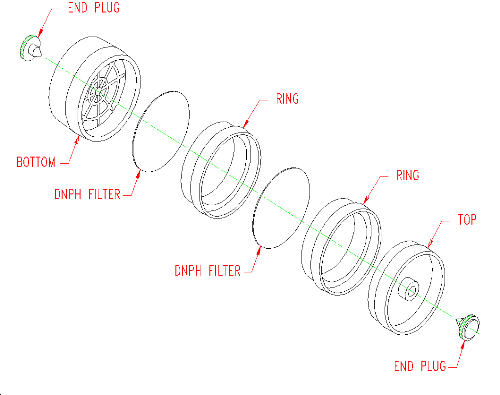
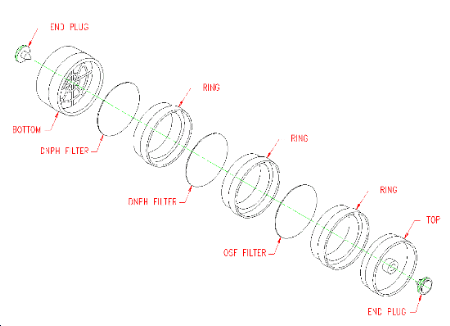
2.1.3 (Additional data, 1997). Ozone levels greater than 10 ppb
may require use of an
2.2 Reagents
No sampling reagents are required.
2.3 Sampling technique
2.3.1 Remove the inlet section (top) and the end plug on the exit section of the air monitoring cassette so that sampling is performed open face.
2.3.2 Attach the sampling device to the sampling pump with flexible, plastic tubing such that the front filter of the sampler is exposed directly to the atmosphere.
2.3.3 Attach the open-face air monitoring cassette vertically (face down) in the worker's breathing zone in such a manner that it does not impede work performance or safety.
2.3.4 Remove the sampling device after sampling for the appropriate time. Replace the inlet section (top) and the end plug on the exit section of the air monitoring cassette. Wrap the sample end-to-end with an official OSHA seal (Form 21).
2.3.5 Keep the collected samples in the dark whenever possible as a precaution against photo-decomposition.
2.3.6 (Additional data, 1997). Ship samples suspected of containing low levels of glutaraldehyde (such as 10-ppb STS) in an insulated container using Blue IceTM (or equivalent) by overnight delivery service (FedExTM, or equivalent).
2.3.7 Submit at least one blank with each set of samples. The blank should be handled the same as the other samples except that no air is drawn through it.
2.3.8 List any potential interferences on the sample data sheet.
2.4 Sampler capacity
2.4.1 Sampler capacity studies were performed by sampling controlled test atmospheres with the recommended sampling device. The average glutaraldehyde concentration of these controlled test atmospheres was 0.4 ppm and the average relative humidity was 66% at 30°C. Five-percent breakthrough occurred after sampling for 171 min at 1 L/min. At the end of the sampling time, 171 L of air had been sampled and 256 µg of glutaraldehyde had been collected. (Section 4.5)
2.4.2 An additional sampler capacity experiment was performed at reduced relative humidity to determine if low humidity had an effect on capacity. No breakthrough was observed when a controlled test atmosphere containing 0.2 ppm glutaraldehyde at 33% relative humidity and 30°C was sampled for 18 min at 1 L/min. The average amount of glutaraldehyde recovered from the samples was 92% of theoretical.
2.4.3 (Additional data, 1997). Sampler capacity studies were
performed at 10-ppb glutaraldehyde, 81% relative humidity at 22°C,
and a sampling rate of 2 L/min.
2.4.4 (Additional data, 1997). Other experiments were conducted to test the sampling method. Samples were collected at both high and low humidity, at both 1 and 2 L/min, and for both 5 min and 15 min. The results of these tests were expressed as percent ratios which were calculated by dividing low humidity results by high humidity results, by dividing 1 L/min results by 2 L/min results, and by dividing 5 min results by 15 min results. The respective ratios were 102.1, 97.6, and 105.5%. (Section 6.9)
2.5 Extraction efficiency
2.5.1 The average extraction efficiency for glutaraldehyde from DNPH coated glass-fiber filters at the target concentration was essentially 100%. (Section 4.6)
2.5.2 Extracted samples remain stable for at least 16 h. (Section 4.6)
2.5.3 (Additional data, 1997). The average extraction efficiency over the range of 0.5 to 2 times the 10-ppb STS target concentration was 98.9%. The average extraction efficiency over the range of 0.5 to 2 times the 2-ppb LTS target concentration was 99.7%. (Section 6.10)
2.5.4 (Additional data, 1997). Average extraction efficiencies for 0.05, 0.1 and 0.2 times the 10-ppb STS were 100.5, 92.2, and 95.8% respectively. Average extraction efficiencies for 0.05, 0.1 and 0.2 times the 2-ppb LTS were 95.9, 100.3, and 99.1% respectively. (Section 6.10)
2.5.5 (Additional data, 1997). Extracted samples remain stable for at least 16 hours. (Section 6.10)
2.6 Recommended air volume and sampling rate
2.6.1 The recommended air volume is 15 L and the recommended sampling rate is 1 L/min.
2.6.2 When longer term sampling is necessary, the recommended air
volume is 120 L and the recommended sampling rate is 1 L/min. The
reliable quantitation limit for a
2.6.3 (Additional data, 1997). Collect 10-ppb STS at 2 L/min for 15 min.
2.6.4 (Additional data, 1997). Collect 2-ppb LTS at 2 L/min for 4 hours if ozone is less than 10 ppb. Ozone present in the sampled air at levels greater than 10 ppb is a negative sampling interference that can cause low results. The severity of the interference depends on the amount of ozone present and on the length of time that the glutaraldehyde derivative is exposed to ozone. Use either an ozone-scavenging filter (Section 4.11.3) when ozone levels are greater than 10 ppb, or a "safe air volume" calculated by dividing 4.6 by the ozone level in ppm. For example: if the ozone level is 0.04 ppm (40 ppb) the "safe air volume" would be 115 L collected at 2 L/min (4.6/0.04=115). (Section 6.9.2.4, Table 6.9.2.4.1, and Figure 6.9.2.4.1)
2.6.5 (Additional data, 1997). The air concentration equivalent to the reliable quantitation limit depends on the air volume sampled.
2.7 Interferences (sampling)
2.7.1 Any substance present in the sampled air and capable of reacting with DNPH or the DNPH derivative of glutaraldehyde is a potential interference. Many aldehydes and ketones are capable of reacting with DNPH.
2.7.2 Suspected interferences should be reported to the laboratory with submitted samples.
2.7.3 (Additional data, 1997). Ozone is a negative sampling
interference that can cause sampling results to be low. The severity
of the interference depends on the amount of ozone present and on
the length of time that the glutaraldehyde derivative is exposed to
ozone. Results from STS were about 10% low after sampling a 240-ppb
ozone test atmosphere for 15 min, and results from LTS were about
45% low after sampling a
The effects of ozone can be reduced by use of an ozone-scavenging
filter (OSF) consisting of a glass fiber filter coated with
2.8 Safety precautions (sampling)
2.8.1 Attach the sampling equipment to the worker in such a manner that it will not interfere with work performance or safety.
2.8.2 Follow all safety practices that apply to the work area being sampled.
3. Analytical Procedure
3.1 Apparatus
3.1.1 A high performance liquid chromatograph (HPLC) equipped with a UV detector and a manual or automatic sample injector. A Waters Associates Model 6000A HPLC pump, a Waters Associates Model 440 UV detector and a Waters Associates Model U6K manual sample injector were used in this evaluation.
(Additional data, 1997). A Hewlett Packard 1050 Series HPLC consisting of a pumping system, programmable variable wavelength detector, and an autosampler was used to analyze samples for the additional evaluation data.
3.1.2 An HPLC column capable of resolving the glutaraldehyde DNPH derivative from interferences. A 25-cm × 4.6-mm i.d. DuPont Zorbax CN (PN 850952-705) HPLC column was used in this evaluation.
(Additional data, 1997). A Restek Pinnacle TO-11 (5-µm), 25-cm × 4.6-mm i.d., (Catalog no. 9172575) HPLC column was used to analyze samples for the additional evaluation data.
3.1.3 Vials, 4-mL glass with Teflon-lined septum caps.
3.1.4 Volumetric flasks, pipets and syringes for preparing standards, making dilutions and performing injections.
3.1.5 A tube rotator or other suitable means to extract the samples. A Fisher Roto-Rack tube rotator was used for this evaluation.
3.1.6 An electronic integrator or some other suitable means to measure detector response. A Hewlett-Packard Model 3357 Data System was used in this evaluation.
(Additional data, 1997). A Waters Millennium Chromatography Manager system was used to analyze samples for the additional evaluation data.
3.2 Reagents
3.2.1 Acetonitrile, HPLC grade. American Burdick and Jackson acetonitrile UV was used in this evaluation.
3.2.2 Water, HPLC grade. Water from a Millipore Milli-Q water filtration system was used in this evaluation.
3.2.3 Phosphoric acid, reagent grade. "Baker Analyzed" Reagent grade 85% phosphoric acid was used in this evaluation.
3.2.4 Glutaraldehyde. Aldrich Chemical Company, 25% by weight solution in water, glutaraldehyde was used in this evaluation. This solution contained 229.5 mg/mL glutaraldehyde as determined by the procedure which is presented in Section 4.10.
3.2.5 2,4-Dinitrophenylhydrazine (DNPH). DNPH (70%), Lot No. 1707 LJ, obtained from Aldrich Chemical Company was recrystallized from hot acetonitrile for use in this evaluation.
3.2.6 Analytical standard preparation solution. This solution is prepared by diluting 1 g of recrystallized DNPH and 5 mL of phosphoric acid to 1 L with acetonitrile.
3.3 Standard preparation
3.3.1 It is recommended that standards be prepared about 1 h before the air samples are to be analyzed in order to insure the complete reaction between glutaraldehyde and DNPH. Standards should be prepared fresh daily. The actual concentration of the glutaraldehyde solution (Section 3.2.4) should be determined by titration as described in Section 4.10. As a precaution against photo-decomposition, standards and samples should be kept in the dark whenever possible.
3.3.2 Prepare glutaraldehyde standard solutions by diluting known volumes of the nominal 25% glutaraldehyde solution with acetonitrile. A solution containing 0.23 mg/mL glutaraldehyde was prepared by diluting 1.0 mL of the reagent to 1000 mL with acetonitrile.
3.3.3 Place 2.0-mL aliquots of analytical standard preparation solution (Section 3.2.6) into each of several 4-mL glass vials. Seal each vial with a Teflon-lined septum cap.
3.3.4 Prepare standards by injecting appropriate volumes of glutaraldehyde standard solution (Section 3.3.2) into the sealed 4-mL vials. A standard containing 11.5 µg per sample glutaraldehyde was prepared by injecting 50 µL of 0.23 mg/mL glutaraldehyde into a vial containing 2.0 mL of analytical standard preparation solution.
(Additional data, 1997). A standard containing 1.15 µg per sample (approximating the 10-ppb STS) was prepared by injecting 5.0 µL of 0.23 mg/mL glutaraldehyde into a vial containing 2.0 mL of analytical standard preparation solution. A standard containing 3.91 µg per sample (approximating the 2-ppb LTS) was prepared by injecting 17.0 µL of 0.23 mg/mL glutaraldehyde into a vial containing 2.0 mL of analytical standard preparation solution.
3.3.5 Prepare a sufficient number of standards to generate a calibration curve. Analytical standard concentrations should bracket sample concentrations.
3.4 Sample preparation
3.4.1 Open the air monitoring cassette and remove the front coated filter. Fold this filter in half, twice (resulting in a quarter circle) and place it in a 4-mL glass vial. Remove the backup fitter, fold it in a similar manner as the front filter and place it in a separate 4-mL glass vial. Do not wad or crumple the filters.
(Additional data, 1997). Discard the OSF (if present) in a container designated for contaminated waste.
3.4.2 Add 2.0 mL of acetonitrile to each vial.
3.4.3 Seal the vials with Teflon-lined septum caps and place them on the tube rotator. Set the rotation speed to 60 rpm and allow them to extract for 1 h.
3.5 Analysis
3.5.1 HPLC conditions
| column: | DuPont Zorbax CN, 25-cm × 4.6-mm i.d. (PN
|
| mobile phase: | 55% acetonitrile in water containing 0.1% phosphoric acid (v/v/v) |
| flow rate: | 1 mL/min |
| injection volume: | 10 µL |
| UV detector: | 365 nm |
| retention time: | 5.9 min |
(Additional data, 1997). The following alternative conditions were developed. The Restek column provides somewhat better resolution of the glutaraldehyde derivative from the sampler matrix than does either the Zorbax, or a Bakerbond CN column.
| column: | Restek Pinnacle TO-11 (5-µm), 25-cm × 4.6-mm i.d., (Catalog no. 9172575) |
| mobile phase: | 62% acetonitrile in water containing 0.1% phosphoric acid (v/v/v) |
| flow rate: | 1 mL/min |
| injection volume: | 20 µL |
| UV detector: | 355 nm |
| retention time: | 9.0 min |
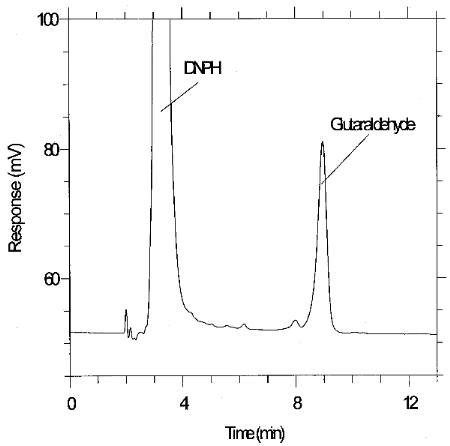
3.5.2 Use a suitable method such as electronic integration to measure detector response.
3.5.3 Use an external standard procedure to prepare a calibration curve with several standard solutions of different concentrations. Prepare the calibration curve daily. Program the integrator to report results in µg per sample
3.5.4 Make sure that sample concentrations are bracketed with standards as stated in Section 3.3.5.
3.6 Interferences (analytical)
3.6.1 Any compound having a similar retention time as the
3.6.2 HPLC parameters (mobile phase composition, column, etc.) may be changed to circumvent interferences.
3.6.3 Retention time on a single column is not proof of chemical identity. Analysis using an alternate HPLC column, detection at another wavelength, comparison of absorbance response ratios and structure determination by mass spectrometry are additional means of identification. (See Figure 6.11 for a UV spectrum of the derivative)
3.7 Calculations
3.7.1 Results are obtained by use of calibration curves. Calibration curves are prepared by plotting detector response against concentration in µg per sample for each standard. The best line through the data points is determined by curve fitting.
3.7.2 The concentration in µg per sample for a particular sample is determined by comparing its detector response to the calibration curve. If glutaraldehyde is found on the backup filter, it is added to the amount found on the front filter. This total amount is then corrected by subtracting the total amount (if any) found on the blank.
3.7.3 The glutaraldehyde air concentration can be expressed using the following equation:
mg/m3 = A/B
| where | A | = | µg per sample from Section 3.7.2 |
| B | = | liters of air sampled |
3.7.4 The following equation can be used to convert glutaraldehyde results in mg/m3 to ppm at 25°C and 760 mm Hg:
ppm = (mg/m3)(24.46)/(100.12)
| where | mg/m3 | = | result from Section 3.7.3 |
| 24.46 | = | molar volume at 760 mm Hg and 25°C | |
| 100.12 | = | molecular weight of glutaraldehyde |
3.8 Safety precautions (analytical)
3.8.1 Avoid skin contact and inhalation of all chemicals.
3.8.2 Restrict the use of all chemicals to a fume hood.
3.8.3 Wear safety glasses and a lab coat in all lab areas.
4. Backup Data
4.1 Detection limit of the analytical procedure
The injection size recommended in the analytical procedure (10
µL) was used to determine the detection limit of the analytical
procedure. The detection limit of the analytical procedure was 1.31 ng
per injection. This was the amount of glutaraldehyde which gave a peak
sufficiently large to permit its visual detection in the presence of
potentially interfering peaks in a sample chromatogram. This detection
limit was determined by the analysis of a standard containing 0.131
µg/mL glutaraldehyde. Figure 4.1 is a chromatogram of the
detection limit of the analytical procedure produced using the Restek
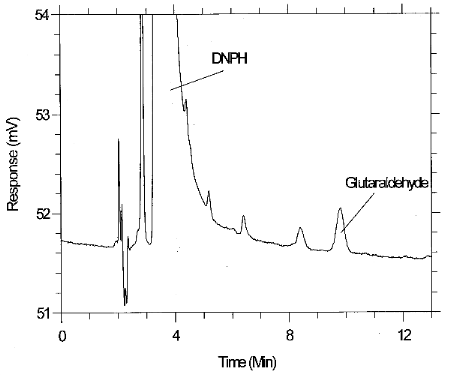
4.2 Detection limit of the overall procedure and reliable quantitation limit data
The injection size recommended in the analytical procedure (10 µL) was used in the determination of the detection limit of the overall procedure and in the determination of the reliable quantitation limit. Samples were prepared by injecting 50 µL of a solution containing 5.36 µg/mL glutaraldehyde (50 µL × 5.36 µg/mL = 0.268 µg) onto each of 6 coated glass-fiber filters. This is the amount of analyte that when extracted with 2.0 mL acetonitrile resulted in a solution with a concentration similar to the solution that was used to determine the detection limit of the analytical procedure (0.131 µg/mL). The amount of glutaraldehyde spiked on the coated filters included any amount that was expected to be lost because of incomplete extraction. The spiked filters were placed in separate 4-mL glass vials, stored at room temperature in the dark and then analyzed the next day. Since the glutaraldehyde recoveries were near 100% and the precision was better than ±25%, the detection limit of the overall procedure and the reliable quantitation limit were 0.268 µg per sample (4.4 ppb or 18 µg/m3).
Table 4.2
Data for Detection Limit of
the
Overall Procedure and the Reliable Quantitation Limit
|
| |||
| sample number | theo amt (µg) | amt recovered (µg) | recovery (%) |
|
| |||
| 1 | 0.268 | 0.269 | 100.4 |
| 2 | 0.268 | 0.257 | 95.9 |
| 3 | 0.268 | 0.228 | 85.1 |
| 4 | 0.268 | 0.284 | 106.0 |
| 5 | 0.268 | 0.260 | 97.0 |
| 6 | 0.268 | 0.266 | 99.3 |
| 0.261 | 97.3 | ||
| SD | 6.9 | ||
| 1.96 × SD | 13.5 | ||
|
| |||
4.3 Precision (analytical method only)
The precision of the analytical method was evaluated by performing multiple injections of analytical standards at 0.5, 1, and 2 times the TLV target concentration.
Table 4.3
Glutaraldehyde Precision Data
|
| |||
| × target concn | 0.5× | 1× | 2× |
| (µg per sample) | 6.0 | 12.0 | 24.0 |
|
| |||
| 676428 | 1249968 | 2510938 | |
| 633559 | 1241804 | 2496676 | |
| 635204 | 1268634 | 2468907 | |
| 644284 | 1213801 | 2550920 | |
| 682320 | 1250483 | 2512370 | |
| 657713 | 1301514 | 2534457 | |
| 654918 | 1254367 | 2512378 | |
| SD | 20877 | 29204 | 28675 |
| CV | 0.0319 | 0.0233 | 0.0114 |
| pooled CV | 0.024 | ||
|
| |||
4.4 Instrument response to the analyte
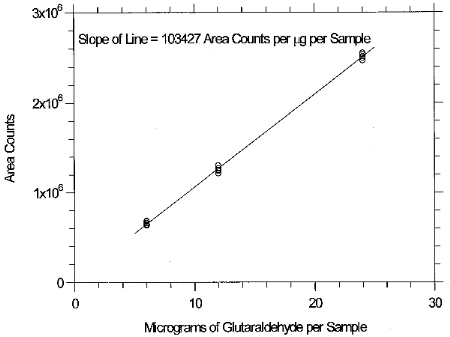
The experimental data in Table 4.3 are presented graphically in Figure 4.4. This figure is a calibration curve over the concentration range of 0.5 to 2 times the TLV target concentration. The instrument response was linear over this range.
4.5 Breakthrough data
Breakthrough studies were performed with the recommended collection
device by sampling controlled test atmospheres containing
glutaraldehyde in air. The average glutaraldehyde inlet concentration
was 0.4 ppm and the average relative humidity was 66% at 30°C. The
sampling rate was 1 L/min.
Table 4.5
Glutaraldehyde Breakthrough Data
|
| |||
| air volume (L) |
breakthrough (%) |
air volume (L) |
breakthrough (%) |
|
| |||
| 18.1 | 0.0 | 105.7 | 0.0 |
| 30.6 | 0.0 | 120.0 | 0.0 |
| 51.6 | 0.0 | 148.9 | 1.6 |
| 59.6 | 0.0 | 155.1 | 1.2 |
| 76.5 | 0.0 | 194.0 | 9.3 |
| 98.9 | 0.0 | ||
|
| |||
4.6 Extraction efficiency and stability of extracted samples
The extraction efficiency of glutaraldehyde from DNPH-coated filters was determined by injecting 55 µL of a solution containing 0.22 mg/mL glutaraldehyde onto each of 6 coated filters. This amount is equivalent to 0.2 ppm for a 15 min air sample. The filters were placed in sealed 4-mL glass vials, stored at room temperature in the dark and then analyzed the next day. Following the initial analysis, the samples were immediately resealed and then reanalyzed about 16 h later using fresh standards. The results of these studies are presented in Table 4.6. The average reanalysis of the extracted samples was 101.6% of the original analysis.
Table 4.6
Extraction Efficiency and Stability
Data
|
| ||
| extraction efficiency (%) |
reanalysis 16-h later (%) | |
|
| ||
| 98.3 | 102.0 | |
| 103.0 | 104.0 | |
| 101.0 | 103.0 | |
| 105.0 | 105.0 | |
| 96.0 | 99.3 | |
| 97.1 | 96.0 | |
| 100.1 | 101.6 | |
|
| ||
4.7 Storage data
Storage samples were generated by sampling a controlled test
atmosphere containing 0.2 ppm glutaraldehyde for 15 min at 1 L/min.
The relative humidity of the sampled air was 72% at
Table 4.7
Storage Data
|
| |||||||
| time (days) | ambient recovery(%) |
time (days) | refrigerated recovery (%) | ||||
|
| |||||||
| 0 | 103.0 | 102.0 | 105.0 | 0 | 99.0 | 95.0 | 99.6 |
| 3 | 107.0 | 98.8 | 103.0 | 2 | 99.2 | 95.2 | 96.9 |
| 6 | 106.0 | 98.8 | 98.3 | 6 | 97.3 | 111.0 | 98.3 |
| 10 | 105.0 | 97.9 | 108.0 | 9 | 97.7 | 99.5 | 97.3 |
| 13 | 100.0 | 102.0 | 102.0 | 13 | 102.0 | 93.1 | 97.2 |
| 17 | 102.0 | 105.0 | 109.0 | 16 | 97.3 | 93.0 | 98.8 |
|
| |||||||
4.8 Reproducibility data
Reproducibility samples were generated by sampling a controlled test atmosphere containing 0.2 ppm glutaraldehyde in air for 15 min at 1 L/min. The relative humidity of the sampled air was 76% at 29°C. The samples and a draft copy of this evaluation were given to a chemist unassociated with this evaluation. The samples were analyzed immediately after generation. No individual sample deviated from its theoretical value by more than the precision (±12%) at the 95% confidence level for the 17-day storage test. (Section 4.7)
Table 4.8
Reproducibility Results
|
| |||
| sample no. | theoretical amount (µg) | analytical result (µg) | recovery (%) |
|
| |||
| 1 | 11.2 | 12.1 | 108.0 |
| 2 | 12.8 | 13.5 | 105.5 |
| 3 | 11.6 | 11.8 | 101.7 |
| 4 | 11.8 | 11.9 | 100.8 |
| 5 | 12.4 | 12.4 | 100.0 |
| 6 | 11.6 | 11.4 | 98.3 |
|
| |||
4.9 Generation of controlled test atmospheres
The controlled test atmospheres which were used in this evaluation were generated by pumping a glutaraldehyde/water solution into a heated glass manifold with a Sage Instruments Model 355 Syringe Pump. The glutaraldehyde/water solution was volatilized and then diluted with heated air. The dilution air was metered into the heated glass manifold using a precision, calibrated rotameter. The dilution air was humidified, if desired, by passing it through a water bubbler prior to its entering the heated glass manifold. The water bubbler was contained in a temperature-controlled water bath. The relative humidity of the dilution air could be varied by changing the temperature of the water bath. If dry dilution air was required, the water bubbler was not used. The relative humidity of the test atmosphere was monitored, after mixing, with a YSI Model 91 Dew Point Hygrometer. The test atmosphere passed through a manifold from which samples could be collected.
The glutaraldehyde concentration of the test atmosphere was adjusted to the desired level by varying the aldehyde concentration of the glutaraldehyde/water solution.
The theoretical glutaraldehyde concentrations of the test atmospheres were calculated using the concentration of the glutaraldehyde/water solution, the flow rate of the syringe pump, and the volume of the dilution air. The actual concentration of a controlled test atmosphere, theoretically containing 0.78 mg/m3 glutaraldehyde, was determined by sampling the atmosphere using the following sampling and analytical techniques:
I. Direct collection on XAD-4 adsorbent. Immediate desorption and GC analysis using a photoionization detector.
II. Collection using two DNPH impingers connected in series. Analysis by HPLC using a UV detector.
III. Collection on DNPH coated XAD-2 adsorbent. Immediate desorption and analysis by HPLC using a UV detector.
IV. Collection and analysis using the recommended method.
Two samples were collected using each technique and the results of this study are presented in Table 4.9.
Table 4.9
Determination of the Concentration of a
Controlled
Test Atmosphere by Comparative Sampling and Analysis
|
| ||||
| technique | analytical results (mg/m3) | percent of | ||
| 1 | 2 | ave | theoretical | |
|
| ||||
| I | 0.650 | 0.642 | 0.646 | 82.8 |
| II | 0.633 | 0.656 | 0.645 | 82.6 |
| III | 0.641 | 0.632 | 0.637 | 81.6 |
| IV | 0.704 | 0.654 | 0.679 | 87.1 |
|
| ||||
The average of all of the samples was 83.5% of the calculated theoretical amount. There was no breakthrough observed in any of the samples.
The difference between theoretical and actual concentrations of the test atmospheres may be the result of partial decomposition of glutaraldehyde in the heated volatilization manifold of the generation apparatus.
Actual concentrations of controlled test atmospheres, which were used in this evaluation, were determined by multiplying the theoretical volumetric concentrations by 83.5%.
(Additional data, 1997). Test atmospheres were prepared to collect
samples for the additional evaluation data using an all glass vapor
generation system. The atmospheres were generated by pumping a
solution of glutaraldehyde/methanol with an ISCO Model 100DM syringe
pump into a heated glass manifold where it evaporated into a heated
dilution air stream. The dilution air was generated using a
It was necessary to dilute glutaraldehyde with methanol in order to
quantitatively generate atmospheres at the
4.10 Procedure to determine glutaraldehyde by acid titration (Ref. 5.6)
4.10.1 Apparatus
Miscellaneous glassware. Fifty-mL burette, 250-mL Erlenmeyer flasks, 1-L volumetric flasks, pipets, etc.
4.10.2 Reagents
4.10.2.1 Sodium sulfite, anhydrous. Prepare a 0.1 M solution by dissolving 12.6 g of the salt in 1 L of deionized water.
4.10.2.2 Hydrochloric acid, reagent grade. Prepare a 0.1 N solution by diluting 7.9 mL of 38% HCl to 1 L with deionized water.
4.10.2.3 Thymolphthalein indicator. Prepare a 0.1% solution in ethanol.
4.10.2.4 Methyl orange indicator. Prepare a 0.1% solution in ethanol.
4.10.2.5 Sodium carbonate, ACS primary standard grade.
4.10.3 Procedure
Standardize the 0.1 N HCI solution using sodium carbonate and methyl orange indicator. A complete procedure for the standardization is presented in Ref. 5.5.
Place 50 mL of 0.1 M sodium sulfite and three drops of thymolphthalein indicator into a 250-mL Erlenmeyer flask. Titrate the contents of the flask to a colorless end-point with 0.1 N HCI (usually one or two drops is sufficient). Transfer 0.50 mL of the nominal 25% glutaraldehyde/water solution (Section 3.2.4) into the same flask and titrate the mixture with 0.1 N HCI, again, to a colorless endpoint. The glutaraldehyde concentration of the solution may be calculated by the following equation:
Glutaraldehyde, mg/mL = (acid titer × acid normality × 50.06)/mL of sample
This method is based on the quantitative liberation of sodium
hydroxide when glutaraldehyde reacts with sodium sulfite to form the
4.11 Procedure to coat glass-fiber filters with DNPH/phosphoric acid and assembly of the sampling device
4.11.1 Apparatus
4.11.1.1 Hotplate
4.11.1.2 Miscellaneous glassware: 250-mL volumetric flask, 30-, 50-, and 150-mL beakers, pipets, etc.
4.11.1.3 Plastic air monitoring cassettes, for 37-mm diameter
filters. Unassembled
4.11.2 Reagents
4.11.2.1 Acetonitrile and toluene. American Burdick and Jackson HPLC grade acetonitrile and Fisher Scientific Optima grade toluene were used in this evaluation.
4.11.2.2 2,4-Dinitrophenylhydrazine (DNPH). DNPH (70%) Lot No. 1707 LJ, obtained from Aldrich Chemical Company, was recrystallized from hot acetonitrile for use in this evaluation.
4.11.2.3 Glass-fiber filters, 37-mm diameter Gelman Sciences Type A glass-fiber filters, Lot No. 8318, were used in this evaluation.
4.11.2.4 Phosphoric acid, reagent grade. "Baker analyzed" Reagent grade 85% phosphoric acid was used in this evaluation.
4.11.2.5 DNPH/phosphoric acid solution. Prepare this solution
by diluting 1 g of recrystallized DNPH and 5 mL of 85% phosphoric
acid to 250 mL with acetonitrile. Allow this solution to stand
4.11.2.6 (Additional data, 1997).
The following is quoted (with permission) from information provided by Flexsys (Ref. 7.9):
- Guidelines for Recrystallizing
SantoflexTM 6PPD
The general process for purifying and recrystallizing Santoflex 6PPD is by vacuum distillation. Handling of the recrystallized material should be done under an inert atmosphere to prevent oxidation through contact with oxygen in the atmosphere.
Equipment
General Procedure
Table 4.11.2
Vapor Pressure of Santoflex
6PPD
|
| |
| temp (°C) | vapor pressure |
| (Torr) | |
|
| |
| 162 | 0.064 |
| 180 | 0.25 |
| 200 | 1.0 |
| 227 | 4.0 |
|
| |
4.11.3 Procedure
(CAUTION! Evaporation of solvents must be performed in an exhaust hood.)
Place a glass-fiber filter on a 30-mL beaker, or some other suitable support, so that only the outside edge of the filter is supported. Pipet 0.5 mL of the DNPH solution (Section 4.11.2.5) onto the surface of the filter. Make sure that the filter is completely saturated with the solution. Allow the acetonitrile to evaporate for about 20 min. Place the coated filters in a suitable container and allow them to dry overnight. Analyze a blank filter to determine if there are any severe analytical interferences present. If a batch of filters is not suitable, discard the reagents and the filters.
Prepared filters were tested for shelf-life by storing them in a tightly sealed container either at ambient temperature or at -20°C. Stored filters were used to periodically sample controlled test atmospheres over a month. Sample results did not appear to be dependent on filter storage temperature but prepared filters should be stored at reduced temperature as a precaution against reagent decomposition. Filters prepared and stored as described remain usable for at least a month.
Assemble the sampling device by placing a coated filter in the outlet section of the air monitoring cassette. DO NOT USE BACK-UP PADS. Next, place a ring on the first filter. Now, put another coated filter on the ring and another ring on top of that filter. Complete the assembly by placing the inlet section on the ring. Plug the outlet and inlet openings with plastic end plugs. An exploded view of the air sampler is shown in Figure 2.1.2. Put the air sampler on a table top with the outlet section down. Press on the top of the air sampler with sufficient force to seal the cassette. Use tape or shrink bands to further seal the two rings and the outlet sections of the cassette. Store the assembled air sampler at reduced temperature (if possible) when there is an appreciable time before it is to be used for sampling.
(Additional data, 1997). Preparation of ozone-scavenging filter
(OSF). Place a glass-fiber filter on a 30-mL beaker, or some other
suitable support, so that only the outside edge of the filter is
supported. Pipet 0.5 mL of the 15 mg/mL
(Additional data, 1997). Incorporation of OSF into air sampler. Refer to Figure 2.1.3. The OSF is positioned before the DNPH filters, and separated from them with a cassette ring, so that sampled air passes through the OSF before passing through the DNPH filters. Remove the cassette top section and place an OSF on the ring. Place another ring on top of the OSF, replace the top section, and seal the sampler. Use tape or shrink bands to further seal the three rings and bottom section. Store the assembled sampler in a freezer.
5. References
5.1 Levin, J.-O.; Andersson, K.; Lindahl, R.; Nilsson, C.-A. J.
Anal. Chem. 1985 57
5.2 Fung, K.; Grosjean, D. J. Anal. Chem. 1981 53 168-171.
5.3 "OSHA Analytical Methods Manual"; U.S. Department of Labor,
Occupational Safety and Health Administration; OSHA Analytical
Laboratory: Salt Lake City, UT, 1985; Method 52; American Conference
of Governmental Industrial Hygienists (ACGIH): Cincinnati, ISBN:
5.4 "Documentation of the Threshold Limit Values and Biological
Indices", 5th ed.; American Conference of Governmental Industrial
Hygienists (ACGIH): Cincinnati, ISBN:
5.5 Treadwell, F.P.; Hall, W.T. "Analytical Chemistry"; John Wiley and Sons: New York, 1948; Vol. II, pp 481-483.
5.6 Walker, J.F. "Formaldehyde"; Reinhold: New York, 1953; p 382.
6. Backup Data (Additional data, 1997)
6.1 Determination of detection limits
Detection limits, in general, are defined as the amount (or concentration) of analyte that gives a response (YDL) that is significantly different (three standard deviations (SDBR)) from the background response (YBR).
YDL - YBR = 3(SDBR)
The measurement of YBR and SDBR in chromatographic methods is typically inconvenient and difficult because YBR is usually extremely low. Estimates of these parameters can be made with data obtained from the analysis of a series of analytical standards or samples whose responses are in the vicinity of the background response. The regression curve obtained for a plot of instrument response versus concentration of analyte will usually be linear. Assuming SDBR and the precision of the data about the curve are similar, the standard error of estimate (SEE) for the regression curve can be substituted for SDBR in the above equation. The following calculations derive a formula for DL:

| Yobs | = | observed response |
| Yest | = | estimated response from regression curve |
| n | = | total number of data points |
| k | = | 2 for linear regression curve |
At point YDL on the regression curve
| YDL = A(DL) + YBR | A = analytical sensitivity (slope) |
therefore
| DL = | (YDL - YBR)
A |
Substituting 3(SEE) + YBR for YDL gives
| DL = | 3(SEE)
A |
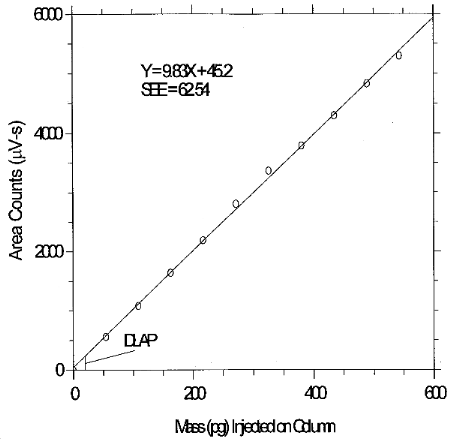
6.2 Detection limit of the analytical procedure (DLAP)
The DLAP is measured as the mass of analyte actually introduced into the chromatographic column. Ten analytical standards were prepared in equal descending increments with the highest standard containing 27.15 ng/mL of glutaraldehyde. This is the concentration that would produce a peak approximately 10 times the background noise of a reagent blank near the elution time of the analyte. These standards, and the reagent blank, were analyzed with the recommended analytical parameters (20-µL injection), and the data obtained were used to determine the required parameters (A and SEE) for the calculation of the DLAP. Values of 9.83 and 62.54 were obtained for A and SEE respectively. DLAP was calculated to be 19.1 pg.
Table 6.2
Detection Limit of the Analytical
Procedure
|
| ||
| concn | mass on | area counts |
| (ng/mL) | column (pg) | (µV-s) |
|
| ||
| 0 | 0 | 0 |
| 2.715 | 54.3 | 558 |
| 5.430 | 108.6 | 1078 |
| 8.145 | 162.9 | 1638 |
| 10.860 | 217.2 | 2187 |
| 13.575 | 271.5 | 2222 |
| 16.280 | 325.6 | 3365 |
| 19.005 | 380.1 | 3788 |
| 21.720 | 434.4 | 4294 |
| 24.435 | 488.7 | 4688 |
| 27.150 | 543.0 | 4672 |
|
| ||
6.3 Detection limit of the overall procedure (DLOP)
The DLOP is measured as mass per sample and expressed as equivalent air concentration, based on the recommended sampling parameters. Ten samplers were spiked with equal descending increments of analyte, such that the highest sampler loading was 325.8 ng per sample. This is the amount spiked on a sampler that would produce a peak approximately 10 times the background response for a sample blank. These spiked samplers, and a sample blank, were analyzed with the recommended analytical parameters, and the data obtained used to calculate the required parameters (A and SEE) for the calculation of the DLOP. Values of 90.7 and 499.24 were obtained for A and SEE, respectively. The DLOP was calculated to be 16.5 ng per sample (STS: 0.13 ppb or 0.55 µg/m3; LTS: 0.0083 ppb or 0.034 µg/m3).
Table 6.3
Detection Limit of the Overall
Procedure
|
| |
| mass per sample | area counts |
| (ng) | (µV-s) |
|
| |
| 0 | 1411 |
| 32.58 | 4649 |
| 65.16 | 7727 |
| 97.74 | 10163 |
| 130.32 | 12788 |
| 162.9 | 15272 |
| 195.48 | 18258 |
| 228.06 | 22262 |
| 260.64 | 24987 |
| 293.22 | 27984 |
| 325.8 | 31460 |
|
| |
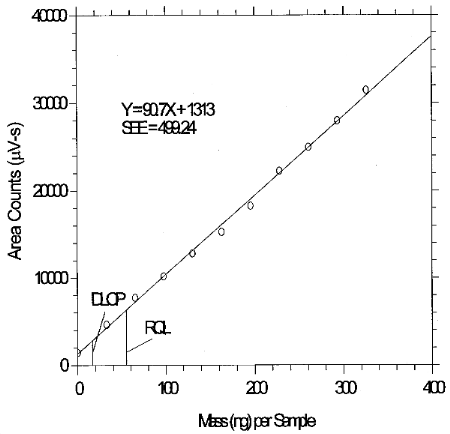
6.4 Reliable quantitation limit (RQL)
The RQL is considered the lower limit for precise quantitative measurements. It is determined from the regression line parameters obtained for the calculations of the DLOP (Section 4.3) providing at least 75% of the analyte is recovered. The RQL is defined as the amount of analyte that gives a response (YRQL) such that
YRQL - YBR = 10(SDBR)
therefore
| RQL = | 10(SEE)
A |
The RQL for glutaraldehyde was calculated to be 55.0 ng per sample (STS: 0.44 ppb or 1.8 µg/m3); LTS: 0.02 ppb or 0.11 µg/m3). The recovery at this concentration is essentially 100%.
6.5 Precision (analytical method)
The precision of the analytical procedure is measured as the pooled relative standard deviation (RSDP). Relative standard deviations are determined from six replicate injections of glutaraldehyde standards at 0.5, 0.75, 1, 1.5 and 2 times the target concentrations. After assuring that the RSDs satisfy the Cochran test for homogeneity at the 95% confidence level, RSDP was calculated to be 0.68% and 0.83% for the lower and higher target concentration, respectively.
Table 6.5.1
Instrument response to Glutaraldehyde
at the 10-ppb STS Concentration
|
| |||||
| × STS concn | 0.5× | 0.75× | 1× | 1.5× | 2× |
| ng per sample | 669.06 | 892.08 | 1338.12 | 1784.16 | 2453.22 |
|
| |||||
| area counts | 72164 | 97542 | 140820 | 198141 | 256688 |
| (µV-s) | 72959 | 98516 | 142396 | 197413 | 260312 |
| 72957 | 98393 | 142264 | 198674 | 261092 | |
| 72557 | 97352 | 142768 | 198553 | 262649 | |
| 73213 | 97366 | 142666 | 199091 | 263156 | |
| 72470 | 96927 | 140382 | 199682 | 257912 | |
| 72720.00 | 97682.67 | 141882.67 | 198592.33 | 260301.50 | |
| SD | 388.47 | 632.37 | 1018.59 | 779.59 | 2571.03 |
| RSD | 0.53 | 0.65 | 0.72 | 0.39 | 0.99 |
|
| |||||
Table 6.5.2
Instrument response to Glutaraldehyde
at the 2-ppb LTS Concentration
|
| |||||
| × LTS concn | 0.5× | 0.75× | 1× | 1.5× | 2× |
| ng per sample | 2007.18 | 2899.26 | 4014.36 | 5798.52 | 7805.7 |
|
| |||||
| area counts | 215608 | 320355 | 432076 | 650472 | 885485 |
| (µV-s) | 218628 | 328115 | 432589 | 662534 | 887672 |
| 218966 | 326240 | 433613 | 664159 | 885390 | |
| 218803 | 327149 | 438510 | 656494 | 879843 | |
| 220680 | 327886 | 440416 | 657363 | 895223 | |
| 217201 | 327600 | 434058 | 650118 | 875522 | |
| 218319.33 | 326224.17 | 435210.33 | 656856.67 | 884855.83 | |
| SD | 1729.85 | 2950.68 | 3422.33 | 5867.16 | 6757.8 |
| RSD | 0.79 | 0.90 | 0.79 | 0.89 | 0.76 |
|
| |||||
The Cochran test for homogeneity:

The critical value of the g-statistic, at the 95% confidence
level, for five variances, each associated with six observations is
0.5065. The g-statistics are 0.4164 and 0.2363 for the

The (RSDP)s are 0.69% and 0.83% for the 10-ppb STS and 2-ppb LTS concentrations respectively.
6.6 Precision (overall procedure)
The precision of the overall procedure is determined from the storage data in Section 6.7. The determination of the standard error of estimate (SEER) for a regression line plotted through the graphed storage data allows the inclusion of storage time as one of the factors affecting overall precision. The SEER is similar to the standard deviation, except it is a measure of the dispersion of data about a regression line instead of about a mean. It is determined with the following equation:

| Yobs | = | observed % recovery at a given time |
| Yest | = | estimated % recovery from the regression line at the same given time |
| n | = | total number of data points |
| k | = | 2 for linear regression |
| k | = | 3 for quadratic regression |
An additional 5% for pump error (SP) is added to the SEER by the addition of variances to obtain the total standard error of the estimate.

The precision at the 95% confidence level is obtained by
multiplying the standard error of estimate (with pump error included)
by 1.96 (the z-statistic from the standard normal distribution
at the 95% confidence level). The 95% confidence intervals are drawn
about their respective regression lines in the storage graphs, as
shown in Figures 6.7.1.1 through 6.7.2.2. The precisions of the
overall procedure are 12.9% and 13.4% for
6.7 Storage tests
6.7.1 Storage test for 10-ppb STS
Storage samples were generated by collecting samples for 15 min
at 2 L/min from a
Table 6.7.1
Storage Test for 10-ppb STS
|
| ||||||
| time | ambient storage | refrigerated storage | ||||
| (days) | recovery (%) | recovery (%) | ||||
|
| ||||||
| 0 | 100.0 | 109.0 | 108.5 | 100.0 | 109.0 | 108.5 |
| 108.2 | 106.9 | 105.0 | 108.2 | 106.9 | 105.0 | |
| 104.9 | 104.2 | 104.9 | 104.2 | |||
| 5 | 99.3 | 97.3 | 95.3 | 92.0 | 100.6 | 103.8 |
| 8 | 91.6 | 98.4 | 94.2 | 90.3 | 100.1 | 97.4 |
| 12 | 88.4 | 94.6 | 88.4 | 100.3 | 99.2 | 98.2 |
| 15 | 90.6 | 88.0 | 86.3 | 99.6 | 100.2 | 97.9 |
| 19 | 85.8 | 84.9 | 86.9 | 101.9 | 100.3 | 101.2 |
|
| ||||||
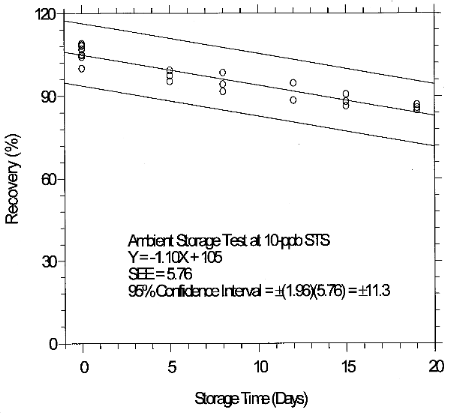
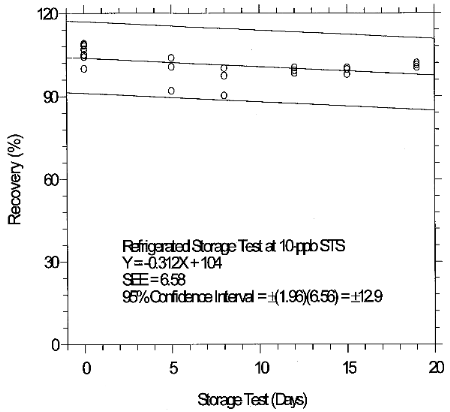
Inspection of the ambient storage graph shows that the storage
loss was 21% during the 19-day test period. OME Method Evaluation
Guidelines require that efforts be made to improve the sampling
method if storage loss is greater than 10% so that restrictions do
not have to be placed on sample storage time before analysis, or on
sample storage temperature. Such attempts were made: sampler
treatments (in addition to DNPH and phosphoric acid) with ascorbic
acid or with alpha-tocopherol (Vitamins C and E); and with
diethyl phthalate alone, and in combination with
4-tert-butylcatechol (TBC). Vitamins C and E were selected
because it was thought that the observed instability could be caused
by oxidation, TBC was tested because it has been shown to improve
storage stability of other analytes, and diethyl phthalate was used
to retain TBC on the sampling medium. None of these additional
treatments improved storage stability, in fact the presence of
Vitamins C and E resulted in even more instability. It was decided,
considering that the loss was less than 25%, to continue to utilize
the established sampling medium in the interests of method
consistency. The storage loss is only 6% when samples are stored at
4°C therefore, samples suspected of containing low levels of
glutaraldehyde (such as
6.7.2. Storage test for 2-ppb LTS
The recommended sampling time for LTS is 4 hours. This sampling
time is excessive for laboratory use because only five samples can
be collected simultaneously with the equipment available. Therefore,
samples were collected from a more concentrated test atmosphere for
a reduced time in order to provide approximately the same mass that
would have been collected had a
Table 6.7.2
Storage Test for 2-ppb LTS
|
| ||||||
| time | ambient storage | refrigerated storage | ||||
| (days) | recovery (%) | recovery (%) | ||||
|
| ||||||
| 0 | 103.3 | 99.1 | 100.6 | 103.3 | 99.1 | 100.6 |
| 100.8 | 100.0 | 100.0 | 100.8 | 100.0 | 100.0 | |
| 100.0 | 98.4 | 99.3 | 100.0 | 98.4 | 99.3 | |
| 96.2 | 96.2 | |||||
| 4 | 106.9 | 101.8 | 102.3 | 105.9 | 117.9 | 101.9 |
| 7 | 105.7 | 105.2 | 94.3 | 100.7 | 104.7 | 95.0 |
| 11 | 106.5 | 101.7 | 98.5 | 103.1 | 105.5 | 104.0 |
| 14 | 97.9 | 99.5 | 88.3 | 111.2 | 103.9 | 98.2 |
| 19 | 105.9 | 94.6 | 92.8 | 109.1 | 102.4 | 103.8 |
|
| ||||||
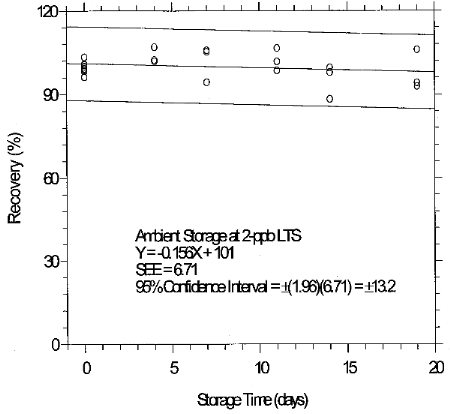
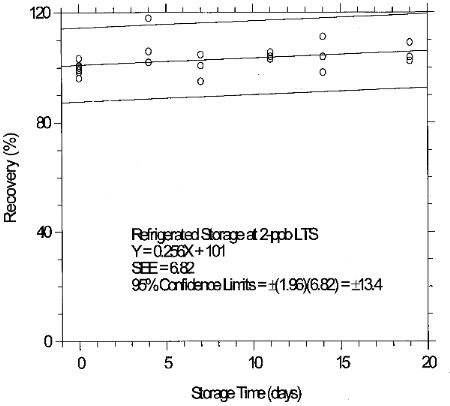
6.7.3 Abbreviated storage test for 2-ppb LTS
An abbreviated storage test was conducted at the 2-ppb LTS by
collecting a limited number of samples at 2 L/min from a
Table 6.7.3
Abbreviated Storage Test for 2-ppb
LTS
|
| |||||||
| time | ambient storage | time | refrigerated storage | ||||
| (days) | recovery (%) | (days) | recovery (%) | ||||
|
| |||||||
| 0 | 96.6 | 95.7 | 95.8 | 0 | 96.6 | 95.7 | 95.8 |
| 94.2 | 87.0 | 94.5 | 94.2 | 87.0 | 94.5 | ||
| 91.7 | 89.5 | 91.7 | 89.5 | ||||
| 8 | 86.2 | 86.2 | 83.2 | 10 | 93.4 | 90.8 | 91.3 |
| 18 | 90.9 | 87.9 | 82.9 | 20 | 96.3 | 96.6 | 95.0 |
|
| |||||||
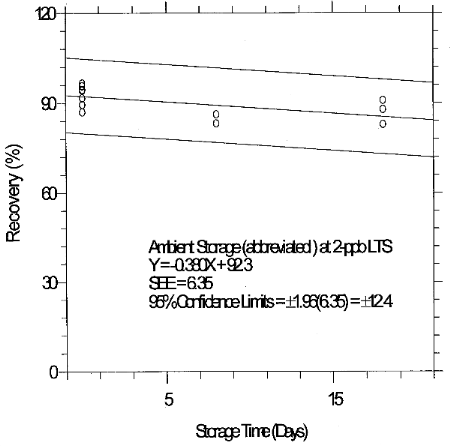
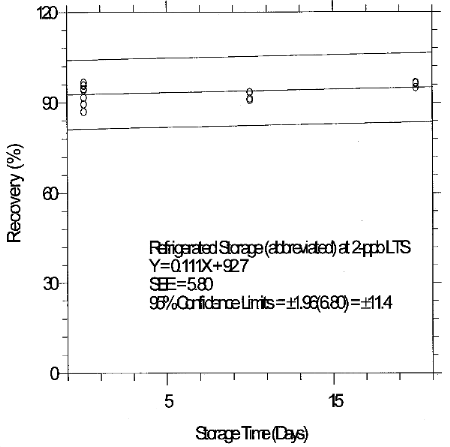
6.8 Reproducibility
6.8.1 Reproducibility for 10-ppb STS
Six samples were prepared by sampling from a test atmosphere containing 10.4 ppb glutaraldehyde for 15 min at 2 L/min. The relative humidity was 82% at 22°C. The samples were submitted to SLTC for analysis. The samples were analyzed after being stored for 10 days at 4°C. Sample results were corrected for extraction efficiency. No sample result had a deviation greater than the precision of the overall procedure determined in Section 6.6, which was ±12.9%.
Table 6.8.1
Reproducibility Data for 10-ppb
STS
|
| |||||
| sample | expected | reported | recovery | deviation | |
| (ppb) | (ppb) | (%) | (%) | ||
|
| |||||
| 1 | 10.4 | 10.3 | 99.0 | -1.0 | |
| 2 | 10.4 | 10.5 | 101.0 | +1.0 | |
| 3 | 10.4 | 10.2 | 98.1 | -1.9 | |
| 4 | 10.4 | 10.1 | 97.1 | -2.9 | |
| 5 | 10.4 | 10.4 | 100.0 | 0.0 | |
| 6 | 10.4 | 9.7 | 93.3 | -6.7 | |
|
| |||||
6.8.2 Reproducibility for 2-ppb LTS
The recommended sampling time for LTS is 4 hours. This sampling time is excessive for laboratory use because only five samples can be collected simultaneously with the equipment available. Therefore, reproducibility samples were collected from a more concentrated test atmosphere for a reduced time in order to provide approximately the same mass that would have been collected had a 2-ppb atmosphere been sampled for 4 hours at 2 L/min. Six samples were collected by sampling a test atmosphere containing 9.6 ppb glutaraldehyde for 45 min at 2 L/min. The relative humidity was 71% at 23°C. The samples were submitted to SLTC for analysis. The samples were analyzed after being stored for 3 days at 4°C. Sample results were corrected for extraction efficiency. No sample result had a deviation greater than the precision of the overall procedure determined in Section 6.6, which was ±13.4%.
Table 6.8.2
Reproducibility Data at Mass
Equivalent for 2-ppb LTS
|
| |||||
| sample | expected | reported | recovery | deviation | |
| mass (ng) | mass (ng) | (%) | (%) | ||
|
| |||||
| 1 | 3916 | 3718 | 94.9 | -5.1 | |
| 2 | 3728 | 3526 | 94.6 | -5.4 | |
| 3 | 3547 | 3280 | 92.5 | -7.5 | |
| 4 | 3486 | 3250 | 93.2 | -6.8 | |
| 5 | 3905 | 3890 | 99.6 | -0.4 | |
| 6 | 3517 | 3350 | 95.2 | -4.8 | |
|
| |||||
6.9 Sampler capacity and additional tests
6.9.1 Sampler capacity
The capacity of the sampler for glutaraldehyde was determined at 400 ppb in the original evaluation of Method 64. The breakthrough concentration was calculated by dividing the amount of glutaraldehyde found on the backup filter by the air volume sampled. Percent breakthrough was calculated by dividing the breakthrough concentration by the inlet concentration, and multiplying by 100. These tests were performed at 66% relative humidity at 30°C. Five-percent breakthrough occurred after sampling for 171 min at 1 L/min, and the capacity of the sampler was 256 µg of glutaraldehyde.
Additional sampler capacity tests were performed for this work. Breakthrough (BT) terms were defined as above. These tests were performed at approximately 10-ppb glutaraldehyde, and 81% relative humidity at 22°C. The test atmosphere was sampled at 2 L/min using the recommended two-section samplers. Five-percent breakthrough was never attained. The sample with the largest air volume, 728 L, had about 31 g of glutaraldehyde which is well below the 256-µg capacity determined in the original evaluation. The recommended sampler has more than sufficient capacity to monitor the 2-ppb LTS.
Table 6.9.1
Breakthrough of Glutaraldehyde
Collected on Glass Fiber Filters
Coated With DNPH and Phosphoric
Acid
|
| |||||
| test | air vol | BT concn | inlet concn | BT | |
| no. | (L) | (ng/L) | (ng/L) | (%) | |
|
| |||||
| 1 | 137.0 | 0.095 | 42.82 | 0.22 | |
| 247.5 | 0.055 | 0.13 | |||
| 399.2 | 0.095 | 0.22 | |||
| 489.1 | 0.26 | 0.11 | |||
| 2 | 395.0 | 0.0025 | 42.82 | 0.01 | |
| 484.5 | 0.00 | 0.00 | |||
| 507.4 | 0.085 | 0.20 | |||
| 682.0 | 0.11 | 0.26 | |||
| 675.6 | 0.068 | 0.16 | |||
| 3 | 530.0 | 0.093 | 42.75 | 0.22 | |
| 620.5 | 0.080 | 0.19 | |||
| 643.8 | 0.074 | 0.17 | |||
| 722.3 | 0.082 | 0.19 | |||
| 728.1 | 0.076 | 0.18 | |||
|
| |||||
6.9.2 Additional tests
Additional testing of the sampling method was conducted at low
relative humidity (Section 6.9.2.1), at 1-L/min sampling rate
(Section 6.9.2.2), and at 5-min sampling times (Section 6.9.2.3).
The results for the additional testing are presented as the percent
ratio of average results for each tested condition. For example, the
percent ratio of the average of the samples collected at low
humidity to the average of samples collected at high humidity was
102.1. The effects of ozone, a reported negative interference for
formaldehyde collected on
6.9.2.1 Humidity effect
The humidity study was performed by collecting samples at a set
humidity, changing the humidity, and then collecting additional
samples as soon as the humidity stabilized. Two studies were
performed: one study at high humidity of 77% and 23°C and at low
humidity of 27% at 23°C (run 1); the other study at high humidity
of 93% at 22°C and at low humidity of 29% and 22°C (run 2). Both
tests were performed at about 10-ppb glutaraldehyde, 2 L/min
sampling rate, and
Table 6.9.2.1
Humidity Effect
|
| |||
| run no. | results at low | results at high | percent ratio |
| humidity (ng/L) | humidity (ng/L) | (low RH/high RH) | |
|
| |||
| 1 | 44.93 | 44.77 | 100.4 |
| 2 | 38.59 | 37.17 | 103.8 |
| 102.1 | |||
|
| |||
6.9.2.2 Sampling rate effect
The sampling rate study was performed by simultaneously collecting samples at either 2 or at 1 L/min. Five individual tests were performed: 2 tests at about 5-ppb, and 3 at about 9-ppb glutaraldehyde. The average relative humidity was 70% at 24°C
Table 6.9.2.2
Sampling Rate Effect
|
| |||
| run no. | results at 1-L/min | results at 2-L/min | percent ratio |
| (ng/L) | (ng/L) | (1-L/min/2-L/min) | |
|
| |||
| 1 2 3 4 5 |
21.84 20.86 37.64 36.40 42.32 |
21.30 21.58 38.04 37.15 45.93 |
102.5 96.7 98.9 98.0 92.1 97.6 |
|
| |||
One experiment was performed in which results from samples collected at either 0.5 or at 2-L/min were compared. The percent ratio (0.5/2-L/min) was 37.90 ng/L/39.23 ng/L = 96.6%.
6.9.2.3 Sampling time effect
The sampling time study was performed by collecting a set of samples for 15 min, and another set for 5 min. The sampling rate was 2 L/min, the glutaraldehyde concentration was about 11 ppb, and the relative humidity was 81% at 22°C.
Sampling Time Effect
|
| ||
| 5-min results (ng/L) |
15-min results (ng/L) |
percent ratio (5-min/15-min) |
|
| ||
| 48.00 | 45.50 | 105.5 |
|
| ||
6.9.2.4 Ozone interference
Ozone has been reported to be a significant negative interference in formaldehyde methods which utilize DNPH-coated silica gel tubes (Ref 7.4). The interference was caused by the reaction of ozone with the formaldehyde-DNPH derivative. The formaldehyde levels studied were 20, 40, and 140 ppb; and the ozone levels were 0, 120, 300, 500, and 770 ppb. Formaldehyde derivative loss was greater at higher ozone levels, with sampling losses of approximately 60% at 300 ppb ozone. The amount of formaldehyde derivative lost depended more on the ozone level than on the formaldehyde level.
The data in Table 6.9.2.4.1 (and in Figure 6.9.2.4.1) shows that ozone can also be a significant negative sampling interference for this method. The interference was not severe for 15-min STS as shown by the data in Table 6.9.4.2.2.
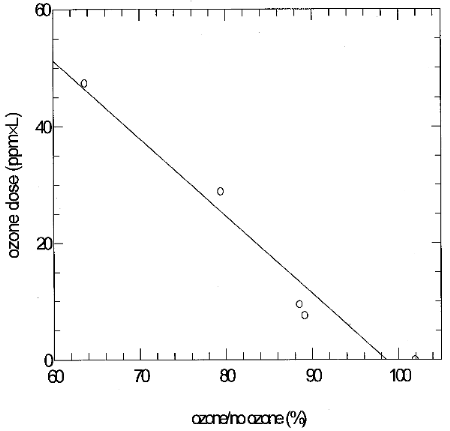
LTS experiments were conducted by sampling a 10-ppb glutaraldehyde test atmosphere to collect the mass expected in 2-ppb LTS, and then using the same samplers to sample a separately generated ozone test atmosphere for 4 hours. The relative humidity of the glutaraldehyde atmospheres was about 80% at 23°C, and about 50% at 23°C for the ozone atmospheres. These experiments represented the worst case because the full amount of glutaraldehyde derivative was available to react with ozone. Four samples were collected from the glutaraldehyde test atmosphere for each experiment, two samples were used as controls (no ozone), and two were used to sample the ozone test atmosphere (ozone). Glutaraldehyde (glut) results from each set of two samples were averaged, and the percent ratio of glutaraldehyde results from samples which had been exposed to ozone to results from corresponding samples which had not been exposed to ozone was calculated. The ozone dose is a measure of total ozone exposure, and it was calculated by multiplying ppm ozone by L of air sampled. Figure 6.9.2.4.1 shows that 95% glutaraldehyde recovery occurs at about 4.6 ppm×L ozone dose. Solution of the equation (4.6=ppm×L) for 0.04 ppm (40 ppb) ozone gives 115 L. This is the air volume that could be sampled if 40 ppb ozone were present and still give 95% glutaraldehyde recovery.
Ozone Interference
|
| ||||
| ozone (ppm) |
ozone dose (ppm×L) |
glut (ng/L) ozone |
glut (ng/L) no ozone |
ratio (%) |
|
| ||||
| 0.0 0.016 0.02 0.06 0.10 |
0 7.57 9.46 28.89 47.43 |
40.77 34.81 35.02 31.28 26.91 |
40.00 39.08 39.59 39.42 42.32 |
101.9 89.1 88.5 79.4 63.6 |
|
| ||||
The experimental results in Table 6.9.2.4.2 were obtained by collecting sets of four samples from glutaraldehyde test atmospheres (either 2 or 10 ppb, and about 80% relative humidity and 23°C) for 15 min and then using two of the samples to sample ozone test atmospheres for 15 min.
Ozone Interference for STS
|
| ||
| glut concn (ppb) |
ozone dose (ppm×L) |
ozone/no ozone (%) |
|
| ||
| 10 10 2 2 2 |
7.23 5.46 7.78 1.12 4.43 |
89.8 93.1 91.7 95.1 95.6 |
|
| ||
Two similar experiments were performed in which the ozone test atmosphere was sampled before sampling the glutaraldehyde atmosphere to determine if ozone deactivated the reagent-coated sampling medium. The percent ratios were 99.6 and 102.0. These results show that the quantity of DNPH reagent coated on the filter is sufficient, and that the interference is primarily caused by ozone reacting with the glutaraldehyde derivative.
Two additional similar experiments were performed by first sampling a 10-ppb glutaraldehyde test atmosphere for either 67 or 46 min, and then sampling ambient indoor SLTC air (during the month of December) for 4 hours with the same samplers. The ambient ozone levels were 8 and 4 ppb, respectively. The percent ratios were 98.2 for 8-ppb ozone, and 91.6 for the 4-ppb ozone tests. These results show that sampling ambient (December) SLTC air had no extreme effect on glutaraldehyde recovery.
The ozone interference manifests itself by reacting with the glutaraldehyde derivative. The product of the interference has not been detected in chromatographic analysis. The severity of the interference depends both on the ozone level and on the length of exposure time. The most expedient approach to solve the problem was to attempt to modify the sampling method in order to reduce or eliminate the interference. One way to accomplish this would be to develop an ozone-scavenging filter which could be placed in front of the sampling filters, and which would remove ozone before it could react with the DNPH derivative. A literature review revealed several reagents which have been used in air sampling to remove ozone. Some of the reagents are mixtures of potassium iodide and glycerol (Ref. 7.5); sodium thiosulfate, potassium carbonate, and glycerol (Ref. 7.6); and sodium nitrite, potassium carbonate, and glycerol (Ref. 7.7) (OSHA's ozone-sampling reagent). Glycerol is used as a non-volatile substrate, and potassium carbonate provides a chemically basic environment to enhance the reaction with ozone.
Several different combinations of these mixtures were tested by
coating them on glass fiber filters and incorporating them into
standard glutaraldehyde samplers. The modified samplers consisted
of an ozone-scavenging filter placed in the same cassette as the
DNPH filters, in front of the glutaraldehyde sampling filters, and
separated from the DNPH filters by a cassette ring in the same
manner as the two DNPH filters are separated. Modified and
standard samplers, used as controls, were used to sample
glutaraldehyde test atmospheres. In each case glutaraldehyde
results were significantly lower in samples using reagent treated
Goodyear Rubber formulates antiozonants into some of their
products to prevent damage from atmospheric ozone. A colleague at
Goodyear was contacted and asked to suggest chemicals which might
eliminate or reduce the ozone interference in this method. Nickel
dibutyl dithiocarbamate and Goodyear's product, Wingstay 300
(N-(l,3-dimethyl-butyl)-N'-phenyl-p-phenylenediamine) were
identified as possible candidates. A Goodyear employee said that
nickel dibutyl dithiocarbamate was the most effective antiozonant
they had ever tested, but that it was toxic. Goodyear also
supplied a small sample of recrystallized
Nickel dibutyl dithiocarbamate (NIDBTC) and
Reduction of the Ozone Interference
|
| ||||
| reagent |
ozone dose (ppm×L) |
ozone (%) |
no ozone (%) |
ozone/no ozone (%) |
|
| ||||
| NiDBTC NiDBTC DMBPPDA DMBPPDA DMBPPDA |
43.17 36.85 35.62 48.08 48.25 |
91.9 85.7 91.8 94.6 91.1 |
95.2 91.8 95.2 97.3 95.3 |
96.5 93.4 96.4 97.2 95.6 |
|
| ||||
These results show that both reagents used to prepare OSFs were generally effective. DMBPPDA was selected for use in this method because NiDBTC was identified as a suspect carcinogen on the MSDS that was included with the reagent. The OSF should be used only when ozone levels in sampled air are above 10 ppb, and make its inclusion necessary (Table 6.9.2.4.1). Ozone levels less than 10 ppb do not require OSF. As an alternative to using OSF, the air sample volume could be reduced. Figure 6.9.2.4.1 shows that 95% recovery is attained at an ozone dose of 4.6 ppm×L. A "safe air volume" that would result in 95% recovery could be calculated by dividing 4.6 by the ppm ozone level at the sampling site. For example: if the ozone level were 0.020 ppm (20 ppb), the "safe air volume" would be 230 L. It is unnecessary to use OSF when collecting 15-min STS as shown by the data in Table 6.9.2.4.2.
6.9.2.5 This method uses open-face sampling so that the full
surface of the
Sample Results
|
| ||||
| sampling rate (L/min) |
sampling time (min) |
open face results (ng/L) |
closed face results (ng/L) |
open face/closed face (%) |
|
| ||||
| 2 2 2 |
240 48 64 |
7.43 33.43 35.28 |
7.49 33.66 36.14 |
99.2 99.3 97.6 |
|
| ||||
6.10 Extraction efficiency and stability of extracted samples
6.10.1 Extraction efficiency at the l0-ppb STS concentration
The extraction efficiencies (EE) of glutaraldehyde were determined by liquid-spiking coated filters with amounts of glutaraldehyde-DNPH approximately equivalent to 0.05 to 2 times the 10-ppb STS concentration. These samples were stored overnight at ambient temperature and then extracted and analyzed. The average extraction efficiency over the working range of 0.5 to 2 times the target concentration was 98.9%.
Extraction Efficiency of Glutaraldehyde from Coated
Filters at the 10-ppb STS Target Concentration
|
| ||||||
| × STS concn (ng/sample) |
0.05× 54 |
0.1× 10⁸ |
0.2× 244 |
0.5× 597 |
1× 1356 |
2× 2442 |
|
| ||||||
| EE (%) |
100.8 99.8 104.1 92.5 106.0 99.7 |
92.6 90.1 95.7 83.9 94.6 96.2 |
94.0 99.6 96.1 95.5 94.5 95.1 |
100.4 99.0 96.7 94.1 95.7 96.8 |
101.0 99.0 97.8 99.0 101.2 98.7 |
99.5 100.2 104.8 98.7 96.3 101.6 |
| 100.5 | 92.2 | 95.8 | 97.1 | 99.4 | 100.2 | |
|
| ||||||
The stability of extracted samples was investigated by reanalyzing the 1×STS about 16 h after the initial analysis. After the original analysis was performed, three vials were recapped with new septa while the remaining three retained their punctured septa. The samples were reanalyzed with fresh standards. The average percent change was +1.7% for samples that were resealed with new septa and +1.7% for those that retained their punctured septa.
Stability of Extracted Samples at the 10-ppb STS Target Concentration
|
| |||||
| punctured septa replaced | punctured septa retained | ||||
| initial EE (%) |
EE after one day (%) |
difference (%) |
initial EE (%) |
EE after one day (%) |
difference (%) |
|
| |||||
| 101.0 99.0 97.8 99.3 |
101.6 102.0 99.4 averages 101.0 |
+0.6 +3.0 +1.6 +1.7 |
99.0 101.2 98.7 99.6 |
103.3 101.8 98.8 averages 101.3 |
+4.3 +0.6 +0.1 +1.7 |
|
| |||||
6.10.2 Extraction efficiency at the 2-ppb LTS concentration
The extraction efficiencies (EE) of glutaraldehyde were determined by liquid-spiking coated filters with amounts of glutaraldehyde-DNPH approximately equivalent to 0.05 to 2 times the 2-ppb LTS concentration. These samples were stored overnight at ambient temperature and then extracted and analyzed. The average extraction efficiency over the working range of 0.5 to 2 times the target concentration was 99.7%.
Extraction Efficiency of Glutaraldehyde from Coated Filters
at the 2-ppb LTS Target Concentration
|
| ||||||
| × LTS concn (ng/sample) |
0.05× 217 |
0.1× 434 |
0.2× 841 |
0.5× 2170 |
1× 4340 |
2× 8410 |
|
| ||||||
| EE (%) |
93.3 93.4 94.3 101.4 95.9 97.3 |
99.4 99.8 98.6 105.7 100.2 98.2 |
99.1 96.3 108.9 96.6 99.3 94.4 |
100.0 101.3 101.3 96.0 99.4 99.8 |
100.9 111.4 95.4 95.7 95.1 101.1 |
98.8 100.2 98.0 101.0 101.5 98.9 |
| 95.9 | 100.3 | 99.1 | 99.6 | 99.9 | 99.7 | |
|
| ||||||
The stability of extracted samples was investigated by reanalyzing the 1×LTS about 16 h after the initial analysis. After the original analysis was performed, three vials were recapped with new septa while the remaining three retained their punctured septa. The samples were reanalyzed with fresh standards. The average percent change was -0.7% for samples that were resealed with new septa, and +2.0% for those that retained their punctured septa.
Stability of Extracted Samples at the 10-ppb STS Target Concentration
|
| |||||
| punctured septa replaced | punctured septa retained | ||||
| initial EE (%) |
EE after one day (%) |
difference (%) |
initial EE (%) |
EE after one day (%) |
difference (%) |
|
| |||||
| 100.9 111.4 95.4 102.6 |
101.6 108.2 95.9 averages 101.9 |
+0.7 -3.2 +0.5 -0.7 |
95.7 95.1 101.1 97.3 |
98.1 98.3 101.4 averages 99.3 |
+2.4 +3.2 +0.3 +2.0 |
|
| |||||
6.11 Qualitative analysis
The UV spectrum for the DNPH derivative of glutaraldehyde was obtained with a Hewlett Packard Model 1HP-1090 Liquid Chromatograph equipped with a diode array detector and using a Restek TO-11 LC column.
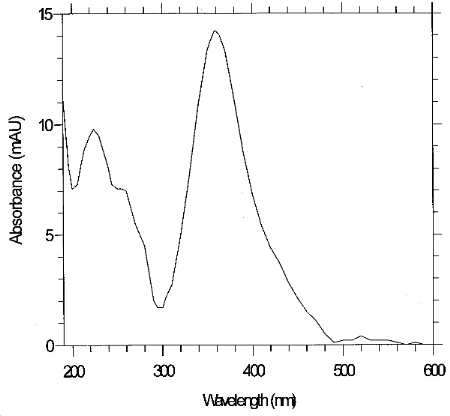
7. References
7.1 Fed. Regist. 1996, 61, Jan. 24, 1996, 1947-1950.
7.2 1996 TLVs and BEIs, Threshold Limit Values for Chemical
Substances and Physical Agents Biological Exposure Indices, ISBN:
7.3 OSHA Analytical Methods Manual, 2nd ed., U.S. Department of Labor, Occupational Safety and Health Administration, Salt Lake Technical Center, Salt Lake City, UT 1993, "Method Evaluation Guidelines" (1993) American Conference of Governmental Industrial Hygienists (ACGIH): Cincinnati, OH, Publ. No. 4542.
7.4 Sirju, A.-P.; Shepson, P.B. Environ. Sci. Technol. 1995 29 384-392.
7.5 Helmig, D.; Greenberg, J. J. High Res. Chromatogr. 1995 18 15-18.
7.6 Lehmpuhl, D.W.; Birks, J.W. J. of Chromatogr. 1996, 71-81.
7.7 OSHA Analytical Methods Manual, 2nd ed., U.S. Department
of Labor, Occupational Safety and Health Administration, Salt Lake
Technical Center, Salt Lake City, UT 1993, "Method
7.8 Posey, F., The Goodyear Tire and Rubber Co., Akron, OH, personal communication, 1997.
7.9 Butkus, D., Flexsys America L.P., Akron, OH, personal communication, 1997.