![]()
| Method no.: | 87 | ||
| Matrix: | Air | ||
| Procedure: | Samples are collected | ||
| Recommended air volume and sampling rate: |
100 L at 1 L/min | ||
|
| |||
| phenylenediamine |
|||
| meta- | ortho- | para- | |
|
| |||
| Target concentration: | 0.10 mg/m3 | 0.10 mg/m3 | 0.10 mg/m3 |
| Reliable quantitation limit: (based on a 100-L air volume) |
0.56 µg/m3 | 2.1 µg/m3 | 0.44 µg/m3 |
| Standard error of estimate at the target concentration: (Section 4.7.) |
5.3% | 7.9% | 5.7% |
|
| |||
| Status of method: | Evaluated method. This method has been subjected to the established evaluation procedures of the Organic Methods Evaluation Branch. | ||
| Date: February 1991 | Chemist: Carl J. Elskamp | ||
OSHA Analytical Laboratory
Salt Lake City, Utah
1. General Discussion
- 1.1. Background
- 1.1.1. History
Phenylenediamines are particularly difficult to determine in air
because they are very susceptible to oxidation reactions, which
create sample stability and analytical problems. There are a number
of methods in the literature which utilize various bubbler or
impinger solutions for collection of air samples. (Refs.
Air sampling and analytical procedures have previously been
evaluated by the OSHA Salt Lake Analytical Laboratory for a number
of other aromatic amines which utilize a sampling device containing
glass fiber filters coated with dilute sulfuric acid. (Refs.
1.1.2. Toxic effects (This section is for information only and should not be taken as the basis of OSHA policy.)
Exposure to phenylenediamines has been reported to affect the
kidney, liver, and blood. Inhalation causes respiratory problems and
asthma, but the most common toxic effect is dermatitis. (Ref.
5.12.) The current OSHA PEL and ACGIH TLV are 0.1
mg/m3 for
1.1.3. Workplace exposure
The major uses for phenylenediamines are in the manufacture of dyes. They are also used to dye hair and fur, as photographic development agents, curing agents for epoxy resins, vulcanization accelerators, and as components of gasoline antioxidants. (Ref. 5.13.)
1.1.4. Physical properties and other descriptive information (Ref. 5.14.)
|
| |||
| phenylenediamine |
|||
| meta- | ortho- | para- | |
|
| |||
| CAS no.: | 108-45-2 | 95-54-5 | 106-50-3 |
| molecular weight: | 108.14 | 108.14 | 108.14 |
| melting point: | 62-63°C | 103-104°C | 145-147°C |
| boiling point: | 284-287°C | 256-258°C | 267°C |
| description: | white crystals turning red on exposure of air | brownish-yellow crystals | white to slightly red crystals; darkens on exposure to air |
| solubility: | soluble in water, methanol, ethanol, chloroform, acetone, DMF, MEK, dioxane | slightly soluble in water; freely soluble in alcohol, chloroform, ether | soluble in 100 parts cold water; soluble in alcohol, chloroform, ether |
| structural formula: | 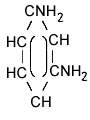 meta |
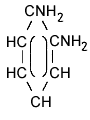 ortho |
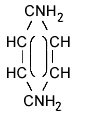 para |
| synonyms: (Ref.
5.13.)
| |||
The analyte air concentrations throughout this method are based on the recommended sampling and analytical parameters.
1.2. Limit defining parameters
- 1.2.1. Detection limit of the analytical procedure
The detection limits of the analytical procedure are 0.14, 0.53,
and 0.11 ng per injection for
1.2.2. Detection limit of the overall procedure
The detection limits of the overall procedure are 56, 211, and 44
ng per sample for
1.2.3. Reliable quantitation limit
The reliable quantitation limits are 56, 211, and 44 ng per
sample for m-, o-, and
The reliable quantitation limits and detection limits reported in this method are based upon optimization of the instrument for the smallest possible amount of analyte. When the target concentration of an analyte is exceptionally higher than these limits, they may not be attainable at the routine operating parameters.
1.2.4. Instrument response to the analyte
The instrument response over concentration ranges representing 0.5 to 2 times the target concentrations is linear for the three analytes. (Section 4.4.)
1.2.5. Recovery
The recoveries of m-, o-, and p-phenylenediamine from samples used in 15-day storage tests remained above 98%, 84%, and 98% respectively. The sample filters were stored in cassettes in a closed drawer at approximately 21°C. (Section 4.5.)
1.2.6. Precision (analytical method only)
The pooled coefficients of variation obtained from replicate
injections of analytical standards at 0.5, 1, and 2 times the target
concentrations are 0.0063, 0.0095, and 0.0090 for
1.2.7. Precision (overall procedure)
The precisions at the 95% confidence level for the 15-day storage
tests are ±10.3, ±15.4 and ±11.1% for
1.2.8. Reproducibility
Six samples, spiked by liquid injection, and a draft copy of this procedure were given to a chemist unassociated with this evaluation. The samples were analyzed after 48 days of storage at approximately 0°C. No individual sample result deviated from its theoretical value by more than the corresponding precision of the overall procedure as reported in Section 1.2.7. (Section 4.8.)
1.3. Advantages
- 1.3.1. The acid-treated filter provides a convenient method of
sampling for a number of aromatic amines.
1.3.2. The analysis is rapid, sensitive, and precise.
1.4. Disadvantages
None
2. Sampling Procedure
- 2.1. Apparatus
- 2.1.1. Samples are collected using a personal sampling pump that
can be calibrated within ±5% of the recommended flow rate with the
sampling device attached.
2.1.2. Samples are collected closed-face using a sampling device
consisting of two
2.2. Reagents
None required
2.3. Sampling technique
- 2.3.1. Remove the plastic plugs from the sampling device
immediately before sampling.
2.3.2. Attach the sampling device to the sampling pump with flexible tubing and place the device in the employee's breathing zone.
2.3.3. Seal the sampling device with the plastic plugs immediately after sampling.
2.3.4. Seal and identify each sampling device with an OSHA Form 21.
2.3.5. Submit at least one blank sampling device with each sample set. Handle the blanks in the same manner as the air samples, but draw no air through them.
2.3.6. Record the volume of air sampled (in liters) for each sample, along with any potential interferences.
2.4. Collection efficiency
A collection efficiency study was conducted by drawing humid air
through a sampling device that was attached to an impinger containing
milligram amounts of the pure amines. The inlet of the impinger was
attached to a humid air generator so air at approximately 80% relative
humidity could be drawn through it. The impinger was heated to
approximately 60°C with a heat tape. After sampling for 4 h at 1
L/min, the filters were analyzed. None of the amines were found on the
back filter and approximately 230, 670, and 130 µg of
2.5. Extraction efficiency
- 2.5.1. The average extraction efficiencies from six filters for
each amine spiked at the target concentration are 100.8%, 97.6%, and
101.0% for
2.5.2. The stability of extracted samples was verified by
reanalyzing the extraction efficiency samples 24 h later using fresh
standards. The average recoveries for the reanalyzed samples were
99.2%, 93.5%, and 98.4% for
2.6. Recommended air volume and sampling rate
- 2.6.1. The recommended air volume is 100 L.
2.6.2. The recommended sampling rate is 1 L/min.
2.6.3. When short-term samples are required, the reliable
quantitation limits will be larger. For example, the reliable
quantitation limit for
2.7. Interferences (sampling)
- 2.7.1. Any compound in the sampled air that will react with the
sulfuric acid on the treated filters or with the collected analyte
is a potential sampling interference.
2.7.2. Suspected interferences should be reported to the laboratory with submitted samples.
2.8. Safety precautions (sampling)
- 2.8.1. Attach the sampling equipment to the employees so that it
will not interfere with work performance or safety.
2.8.2. Follow all safety procedures that apply to the work area being sampled.
3. Analytical Procedure
- 3.1. Apparatus
- 3.1.1. An HPLC system equipped with an ultraviolet detector. A
3.1.2. An HPLC column capable of separating the analyte from the
solvent and interferences. A Waters
3.1.3. An electronic integrator or some other suitable means of
measuring peak areas or heights. A
3.1.4. Small resealable glass vials with Teflon-lined caps
capable of holding 4 mL.
3.1.5. A dispenser capable of delivering 2.0 mL of the EDTA extraction solution.
3.1.6. A pH meter with a combination electrode is used in the preparation of the HPLC mobile phase.
3.2. Reagents
- 3.2.1.
3.2.2. HPLC grade acetonitrile and water. The acetonitrile used
in this evaluation was "Optima" brand from Fisher Chemical (Fair
Lawn, NJ) and the water was from an
3.2.3. Ethylenediaminetetraacetic acid (EDTA), reagent grade. A 0.1 g/L EDTA aqueous solution is used to extract the sample filters.
3.2.4. Phosphoric acid, 10 N sulfuric acid, and dibasic sodium phosphate (Na2HPO4), reagent grade.
3.3. Standard preparation
- 3.3.1. Restrict the use of pure compounds and concentrated
standards to regulated areas. Prepare concentrated stock standards
by accurately weighing approximately 50 mg of each amine into a
3.3.2. Prepare analytical standards by injecting microliter
amounts of stock standards into
3.3.3. Bracket sample concentrations with analytical standard concentrations. If sample concentrations are higher than the upper range of prepared standards, prepare higher standards to ascertain detector response or dilute the extract of the samples using the EDTA extraction solution.
3.4. Sample preparation
- 3.4.1. Transfer the sample filters to individual 4-mL vials.
3.4.2. Add 2.0 mL of the aqueous EDTA extraction solution to each vial.
3.4.3. Recap and periodically invert the vials over a period of 10 min.
3.4.4. Analyze by making direct injections of the extracts.
3.5. Analysis
- 3.5.1. HPLC conditions and information
| mobile phase: | 0.05 M sodium phosphate in 95/5, water/acetonitrile at
pH 7.0. Prepare by adding 7.1 g of dibasic sodium phosphate
per 1 L of the final total volume of mobile phase to the
water. After the sodium phosphate has dissolved (expedited
using sonication) adjust the pH of this aqueous solution to
7.0 with phosphoric acid. Add the acetonitrile to the
|
| flow rate: | 2 mL/min |
| UV detector wavelength: | 240 nm |
| injection volume: | 5 µL |
| column: | Waters Radial-Pak 100-mm × |
| retention times: | m-phenylenediamine, 3.8 min o-phenylenediamine, 7.0 min |
| chromatogram: | Section 4.10. |
3.5.2. Measure peak areas or heights by use of an integrator or by other suitable means.
3.5.3. Construct a calibration curve by plotting response (peak areas or heights) of standard injections versus micrograms of analyte per sample. Bracket sample concentrations with standards.
3.6. Interferences (analytical)
- 3.6.1. Any compound that elutes in the same general time as the
amine of interest is a potential interference. Suspected
interferences reported to the laboratory with submitted samples by
the industrial hygienist must be considered before samples are
extracted.
3.6.2. HPLC parameters may be changed to possibly circumvent interferences.
3.6.3. Retention time on a single column is not considered proof of chemical identity. Analyte identity should be confirmed by mass spectrometry if possible.
3.7. Calculations
The analyte concentration for samples is obtained from the calibration curve in micrograms of analyte per sample. If any analyte is found on any back filter, that amount is added to the amount found on the corresponding front filter. If any analyte is found on the blank filters, the combined amount is subtracted from the combined sample amounts. The air concentrations are calculated using the following formula.
| mg/m3 = | (micrograms of analyte per sample)
|
3.8. Safety precautions (analytical)
- 3.8.1. Restrict the use of pure compounds and concentrated
standards to regulated areas. Avoid skin contact and inhalation of
all chemicals.
3.8.2. Restrict the use of all chemicals to a fume hood if possible.
3.8.3. Wear safety glasses and a lab coat at all times while in the lab area.
4. Backup Data
- 4.1. Detection limit of the analytical procedure
The injection volume (5 µL) listed in Section
3.5.1. was used in the determination of the detection limits of
the analytical procedure. The detection limits of 0.14, 0.53, and 0.11
ng per injection were determined by analyzing dilute standards
equivalent to 56, 211, and 44 ng per sample for
4.2. Detection limit of the overall procedure
The detection limits of the overall procedure were determined by
analyzing filters spiked with loadings equivalent to the detection
limits of the analytical procedure. Samples were prepared by injecting
56, 211, and 44 ng of
|
| ||
| sample no. | ng spiked | ng recovered |
|
| ||
| 1 2 3 4 5 6 |
56 56 56 56 56 56 |
56.6 56.3 63.0 53.3 47.5 53.6 |
|
| ||
|
| ||
| sample no. | ng spiked | ng recovered |
|
| ||
| 1 2 3 4 5 6 |
211 211 211 211 211 211 |
204 213 200 197 195 193 |
|
| ||
|
| ||
| sample no. | ng spiked | ng recovered |
|
| ||
| 1 2 3 4 5 6 |
44 44 44 44 44 44 |
39.3 42.3 47.2 45.6 42.4 44.2 |
|
| ||
4.3. Reliable quantitation limit
The reliable quantitation limits were determined by analyzing
filters spiked with loadings equivalent to the detection limits of the
analytical procedure. Samples were prepared by injecting 56, 211, and
44 ng of
|
| |||
| sample no. | percent recovered | ||
|
| |||
| 1 2 3 4 5 6 |
101.1 100.5 112.5 95.2 84.8 95.7 |
SD = Precision = = |
98.3 9.1 (1.96)(±9.1) ±17.8 |
|
| |||
|
| |||
| sample no. | percent recovered | ||
|
| |||
| 1 2 3 4 5 6 |
96.7 100.9 94.8 93.4 92.4 91.5 |
SD = Precision = = |
95.0 3.4 (1.96)(±3.4) ±6.7 |
|
| |||
|
| |||
| sample no. | percent recovered | ||
|
| |||
| 1 2 3 4 5 6 |
89.3 86.1 107.3 103.6 96.4 100.5 |
SD = Precision = = |
98.9 6.3 (1.96)(±6.3) ±12.3 |
|
| |||
4.4. Instrument response to the analyte
The instrument response to the analytes over the range of 0.5 to 2
times the target concentrations was determined from multiple
injections of analytical standards. The response is linear for the
three analytes with slopes (in area counts per micrograms of analyte
per sample) of 2120, 1663, and 2805 for
|
| |||
| × target
concn µg/sample mg/m3 |
0.5× 4.918 0.0492 |
1× 9.837 0.0984 |
2× 19.67 0.197 |
|
| |||
| area counts | 10260 10096 10037 10143 10146 9992 |
20563 20615 20471 20608 20362 20615 |
41330 41218 41425 41385 41399 41581 |
| 10112 | 20539 | 41390 | |
|
| |||
|
| |||
| × target
concn µg/sample mg/m3 |
0.5× 5.203 0.0520 |
1× 10.41 0.104 |
2× 20.81 0.208 |
|
| |||
| area counts | 7838 7741 7832 7678 7686 7634 |
16545 16644 16472 16438 16634 16121 |
33874 33549 33612 33810 33763 33637 |
| 7735 | 16476 | 33708 | |
|
| |||
|
| |||
| × target
concn µg/sample mg/m3 |
0.5× 4.879 0.0488 |
1× 9.757 0.0976 |
2× 19.51 0.195 |
|
| |||
| area counts | 13088 13079 13182 12781 13212 12901 |
26947 26891 26703 26439 26538 26866 |
54204 53772 54331 53866 53945 54348 |
| 13040 | 26731 | 54078 | |
|
| |||
Storage samples were generated by spiking sulfuric acid-treated
glass fiber filters with amounts of analyte equal to the target
concentrations (9.837, 10.41, and 9.757 µg of
|
| |||||||
| days of | % recovery | ||||||
| storage | refrigerated | ambient | |||||
|
| |||||||
| 0 0 3 6 9 12 15 |
100.5 95.5 97.7 99.2 98.0 98.5 93.4 |
98.8 96.6 97.1 97.4 98.7 100.1 96.7 |
98.7 98.0 98.8 98.4 99.4 99.8 95.3 |
100.5 95.5 96.7 100.2 99.9 100.9 99.8 |
98.8 96.6 103.4 98.6 99.9 100.1 98.9 |
98.7 98.0 97.2 99.9 100.1 100.3 100.5 | |
|
| |||||||
|
| |||||||
| days of | % recovery | ||||||
| storage | refrigerated | ambient | |||||
|
| |||||||
| 0 0 3 6 9 12 15 |
94.8 92.3 95.3 88.1 97.0 90.7 92.0 |
96.8 92.3 92.7 90.6 92.0 96.2 94.6 |
102.1 95.6 100.6 90.7 95.6 89.3 91.5 |
94.8 92.3 103.0 79.7 89.7 87.6 92.6 |
96.8 92.3 104.1 86.2 89.2 82.6 85.7 |
102.1 95.6 92.9 85.0 91.0 75.9 89.5 | |
|
| |||||||
|
| |||||||
| days of | % recovery | ||||||
| storage | refrigerated | ambient | |||||
|
| |||||||
| 0 0 3 6 9 12 15 |
99.3 95.4 95.5 97.1 98.0 95.6 94.5 |
101.1 96.1 92.2 96.4 97.0 100.5 98.0 |
100.4 100.5 94.4 97.9 98.9 100.0 94.2 |
99.3 95.4 93.1 91.8 97.3 100.1 98.6 |
101.1 96.1 99.5 98.8 97.6 101.3 98.7 |
100.4 100.5 101.2 97.7 95.9 98.3 101.0 | |
|
| |||||||
4.6. Precision (analytical method only)
The precision of the analytical method for each analyte is the pooled coefficient of variation determined from replicate injections of standards. The precisions are based on the data from Section 4.4.
|
| |||
| × target
concn µg/sample mg/m3 |
0.5× 4.918 0.0492 |
1× 9.837 0.0984 |
2× 19.67 0.197 |
|
| |||
| SD (area counts) CV |
94.1 0.0093 |
102.8 0.0050 |
119.2 0.0029 |
|
| |||
|
| |||
| × target
concn µg/sample mg/m3 |
0.5× 5.203 0.0520 |
1× 10.41 0.104 |
2× 20.81 0.208 |
|
| |||
| SD (area counts) CV |
84.7 0.0110 |
192.6 0.0117 |
126.9 0.0038 |
|
| |||
|
| |||
| × target
concn µg/sample mg/m3 |
0.5× 4.879 0.0488 |
1× 9.757 0.0976 |
2× 19.51 0.195 |
|
| |||
| SD (area counts) CV |
167.3 0.0128 |
206.8 0.0077 |
248.6 0.0046 |
|
| |||
4.7. Precision (overall procedure)
The precision of the overall procedure is determined from the storage data. The determination of the standard error of estimate (SEE) for a regression line plotted through the graphed storage data allows the inclusion of storage time as one of the factors affecting overall precision. The SEE is similar to the standard deviation, except it is a measure of dispersion of data about a regression line instead of about a mean. It is deterinined with the following equation:
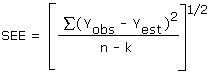
| where | |
| n = k = k = |
total no. of data points 2 for linear regression 3 for quadratic regression |
| Yobs = | observed % recovery at a given time |
| Yest = | estimated % recovery from the regression line at the same given time |
An additional 5% for pump error is added to the SEE by the addition
of variances. The precision at the 95% confidence level is obtained by
multiplying the SEE (with pump error included) by 1.96 (the
Six samples were prepared by injecting microliter quantities of
standards onto
|
| ||||
| sample no. | µg found | µg expected | % found | % deviation |
|
| ||||
| 1 2 3 4 5 6 |
17.70 9.692 4.661 9.224 18.99 5.130 |
19.67 9.837 4.918 9.837 19.67 4.918 |
90.0 98.5 94.8 93.8 96.5 104.3 |
-10.0 -1.5 -5.2 -6.2 -3.5 +4.3 |
|
| ||||
|
| ||||
| sample no. | µg found | µg expected | % found | % deviation |
|
| ||||
| 1 2 3 4 5 6 |
18.34 9.768 4.605 9.502 19.93 4.703 |
20.81 10.41 5.203 10.41 20.81 5.203 |
88.1 93.8 88.5 91.3 95.8 90.4 |
-11.9 -6.2 -11.5 -8.7 -4.2 -9.6 |
|
| ||||
|
| ||||
| sample no. | µg found | µg expected | % found | % deviation |
|
| ||||
| 1 2 3 4 5 6 |
17.63 9.523 4.601 9.256 18.83 4.990 |
19.51 9.757 4.879 9.757 19.51 4.879 |
90.4 97.6 94.3 94.9 96.5 102.3 |
-9.6 -2.4 -5.7 -5.1 -3.5 +2.3 |
|
| ||||
Six sample filters for each amine were spiked with the target
concentration amounts by liquid injection (9.837, 10.41, and 9.757 µg
of
|
| ||
| sample no. | % extracted | % extracted (reanalyzed after 24 h) |
|
| ||
| 1 2 3 4 5 6 |
99.6 99.2 100.3 101.9 100.7 103.2 100.8 |
98.1 99.8 100.1 98.4 98.0 100.9 99.2 |
|
| ||
|
| ||
| sample no. | % extracted | % extracted (reanalyzed after 24 h) |
|
| ||
| 1 2 3 4 5 6 |
96.9 98.0 95.9 96.0 96.4 102.5 97.6 |
88.8 95.5 93.7 92.7 94.1 96.2 93.5 |
|
| ||
|
| ||
| sample no. | % extracted | % extracted (reanalyzed after 24 h) |
|
| ||
| 1 2 3 4 5 6 |
99.9 100.2 99.3 101.7 101.6 103.2 101.0 |
97.0 98.3 99.4 97.7 98.7 99.6 98.4 |
|
| ||
A chromatogram of an analytical standard is shown in Figure
4.10. The chromatogram is from a
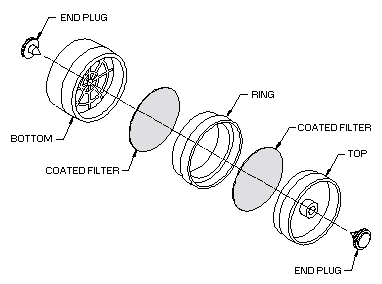
Figure 2.1.2. Unassembled sampling device for phenyldenediamines.
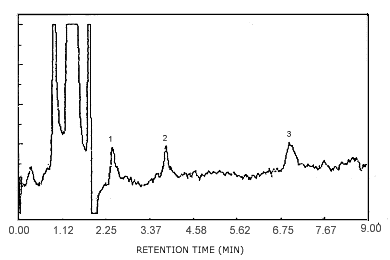
Figure 4.1. Detection limit chromatogram. Key:1 = p-phenylenediamine, 2 = m-phenylenediamine, 3 = o-phenylenediamine.
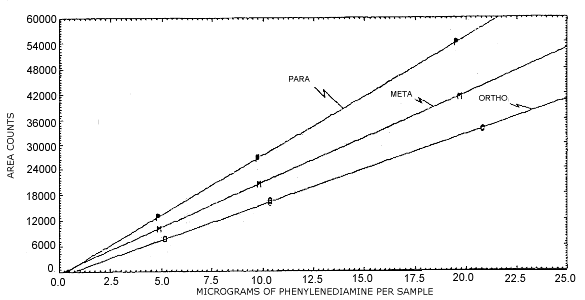
Figure 4.4. Instrument response.
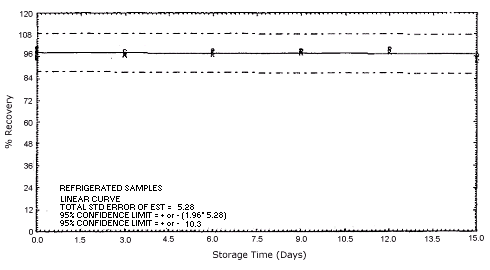
Figure 4.5.1.1. Refrigerated m-phenylenediamine storage samples.
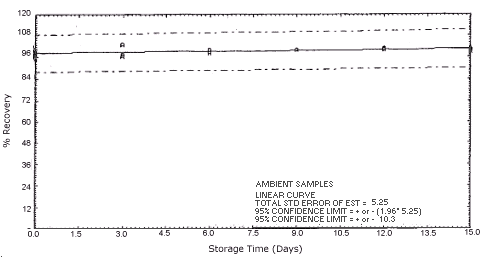
Figure 4.5.1.2. Ambient m-phenylenediamine storage samples.
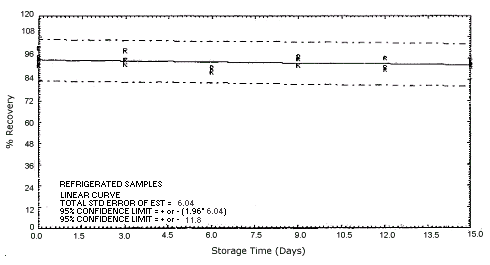
Figure 4.5.2.1. Refrigerated o-phenylenediamine storage samples.
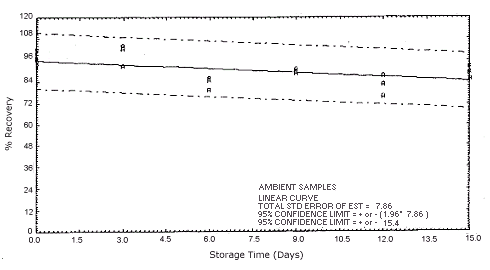
Figure 4.5.2.2. Ambient o-phenylenediamine storage samples.
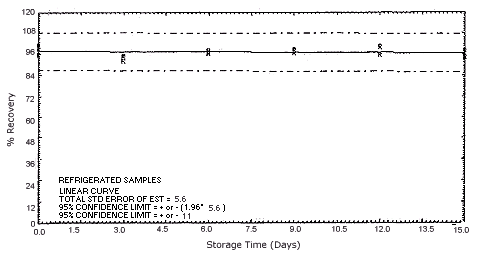
Figure 4.5.3.1. Refrigerated p-phenylenediamine storage samples.
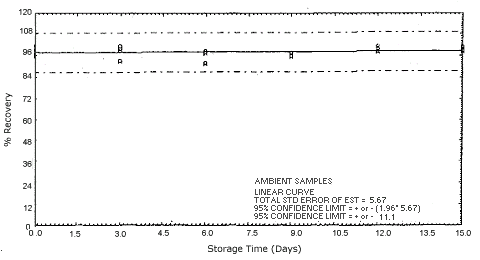
Figure 4.5.3.2. Ambient p-phenylenediamine storage samples.
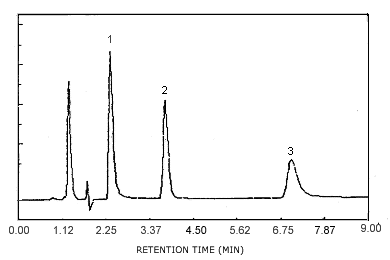
Figure 4.10. Chromatogram of a standard at the target concentrations. Key:
5. References
- 5.1. Lugg, G.A. Anal. Chem., 1963,
35,
5.2. Levin, V.; Nippoldt, B.W.; Rebertus, R.L.
Anal. Chem., 1967, 39,
5.3. Simonov, V.A.; Bartenev, V.D.; Mikhailova,
I.A. Hyg. and Sanit., 1972, 36,
5.4. Burg, W.R.; Winner, B.E.; Elia, V.J. Am.
Ind. Hyg. Assoc. J., 1980, 41,
5.5. Dmitriev, M.T.; Semyanistye, V.D.;
Shelyapina, E.N.; Piskunov, B.G. Gig. Sanit., 1988,
11,
5.6. Elia, V.J.; Powers, K.M.; Burg, W.R. Am.
Ind. Hyg. Assoc. J., 1982, 43,
5.7. "OSHA Analytical Methods Manual", Second Edition, U.S. Department of Labor, Occupational Safety and Health Administration; OSHA Analytical Laboratory: Salt Lake City, UT, 1990; Method 57; American Conference of Governmental Industrial Hygienists (ACGIH): Cincinnati, OH, Publication No. 4542.
5.8. ibid. Method 65.
5.9. ibid. Method 71.
5.10. ibid. Method 73.
5.11. ibid. Method 78.
5.12. Jasmin, G. Can. Biol., 1961, 20, 37.
5.13. "Hazardous Substances Database", on-line database from U.S. Department of Health and Human Services, National Library of Medicine, Bethesda, MD.
5.14. Badavari, S., Ed. "Merck Index", 11th ed.; Merck and Co.: Rahway, NJ, 1989.