|
| Method no.: |
88 |
| |
|
| Matrix: |
Air |
| |
|
| Target
Concentration: |
1 ppm (2.4
mg/m3) and 20 ppm (47
mg/m3) |
| |
|
| Procedure: |
Samples are collected
by drawing air through standard size Anasorb 747 adsorbent
tubes. The Anasorb 747 is desorbed with carbon disulfide and
the desorbate is analyzed by gas chromatography using a flame
ionization detector. |
| |
|
Recommended air
volume
and sampling rate: |
5 L at 0.1
L/min |
| |
|
Standard error of
estimate
at target concentration:
(Section
4.7.): |
5.7% (1 ppm)
6.5%
(20 ppm) |
| |
|
| Special
requirement: |
Stored samples should
be kept at 0° or colder to reduce migration. Reduced
temperature shipment of samples to the laboratory is not
necessary. |
| |
|
| Status of method: |
Evaluated method.
This method has been subjected to the established evaluation
procedures of the Organic Methods Evaluation Branch. |
| |
|
| June 1991 |
Carl J.
Elskamp |
| |
|
Organic Methods Evaluation Branch
Industrial
Hygiene Chemistry Division
OSHA Salt Lake Technical
Center
Sandy UT 84070-6406
|
1.
General Discussion
1.1. Background
1.1.1. History
OSHA has set a time
weighted average final rule limit of 20 ppm for workplace
exposure to propylene oxide. (Ref.
5.1.) Based on evidence that propylene oxide is an
animal carcinogen, NIOSH recommends that occupational
exposure to propylene oxide be reduced to the lowest
feasible level. (Ref.
5.2.) Because the PEL for ethylene oxide, which is
chemically similar to propylene oxide and is also an
animal carcinogen, has recently been reduced to 1 ppm (Ref.5.3.),
evaluation data was collected at 1 ppm (TC-1)
as well as 20 ppm (TC-20) to assure that an
adequate monitoring procedure would be available if the
PEL for propylene oxide were significantly lowered in the
future.
The current methodology used by OSHA to
determine propylene oxide in air is based on the coconut
shell charcoal tube procedure evaluated by NIOSH. (Ref.
5.4.) The concentration range studied was 50 to 200
ppm (5-L air samples) because the OSHA PEL
was 100 ppm at that time. The method specifies that
samples be shipped at reduced temperatures, although no
sample stability tests were reported. Typically, air
samples collected on adsorbent tubes are shipped
refrigerated to minimize migration of analyte from the
front section to the back section of adsorbent.
Preliminary tests at the 20-ppm level
(5-L air samples) confirmed that migration
was indeed a problem. Test samples were prepared by
spiking the front sections of SKC, Inc. Lot 120 coconut
shell charcoal tubes and storing them at room temperature
for six days. Approximately 5 L of air at 80% relative
humidity had been drawn through the charcoal tubes before
they were spiked. Upon analysis, about 20% of the original
amount of propylene oxide was found on the back sections.
When added to the amount found on the front sections, the
total amount found was only about 80% of the original
amount spiked. This not only indicated that there is a
migration problem but there may also be a stability
problem for propylene oxide collected on charcoal.
Commercially available glass sampling tubes
containing a new carbon-based adsorbent
called Anasorb 747 were evaluated and found to be a
superior alternative to charcoal sampling tubes. Storage
samples generated from humid atmospheres exhibited
excellent storage stability over the 15-day
perious studied. Some minor migration of propylene oxide
to the back section of the sampling tubes for the
TC-20 anbient storage samples was observed,
but was not considered significant enough to require
shipment of samples to the laboratory at reduced
temperatures.
1.1.2. Toxic effects (This section
is for information only and should not be taken as the
basis of OSHA policy.)
Propylene oxide is an
irritant and a mild depressant of the central nervous
system. Excessive exposure may cause irritation of the
eyes, nose, throat, and lungs. Contact with the liquid may
cause skin or eye irritation or burns. (Ref.
5.5.)
NIOSH has recently issued a Current
Intelligence Bulletin on the carcinogenic effects of
exposure to propylene oxide. Numerous studies are cited
that show propylene oxide exposure produces cancer and
benign tumors in both rats and mice. They conclude that
propylene oxide should be considered a potential
occupational carcinogen and worker exposure should be
reduced to the lowest feasible levels. (Ref.
5.2.)
Currently OSHA has a transitional limit
of 100 ppm and a final rule limit of 20 ppm for
8-hour time weighted average exposures to
airborne propylene oxide. (Ref.
5.1.)
1.1.3. Workplace exposure
Propylene oxide is produced by the chlorohydrin
process, where propylene is reacted with chlorine, or by
the hydroperoxide process, where an organic hydroperoxide
is used to epoxidize propylene. The estimated U.S.
production of propylene oxide in 1980 was 1,767 million
pounds. It is used primarily as an intermediate for the
manufacture of polyether polyols in the production of
polyurethane foams, and for the manufacture of propylene
glycol in the production of unsaturated polyester resins.
Small quantities are also used for sterilizing medical
equipment and for fumigating foodstuffs. In 1983, NIOSH
estimated that 209,000 U.S. workers were potentially
exposed to propylene oxide. (Ref.
5.2.)
1.1.4. Physical properties (Ref.
5.5. unless otherwise noted)
|
|
|
structural
formula:
|
 |
| CAS number: |
75-56-9 |
| molecular weight: |
58.08 |
| specific gravity
(water=1): |
0.830 |
| boiling point at 101.3
kPa(760 mmHg): |
34° |
| melting point: |
-112° |
| vapor density (air = 1
at boiling point of propylene oxide): |
2 |
| vapor pressure at
20°: |
58.9 kPa (442
mmHg) |
| appearance: |
colorless liquid |
| odor: |
etherlike |
| evaporation rate (butyl
acetate = 1): |
33.7 |
| flash point (closed
cup): |
-37° |
| autoignition
temperature: |
748° |
| flammable limits in air,
% by volume: |
2.1 to 37.0 |
| odor threshold: |
200 ppm |
| solubility: |
59% by weight in water
at 25° miscible with acetone, benzene, carbon
tetrachloride, ether, and methanol (Ref.
5.2.) |
| synonyms: |
1,2-propylene oxide;
epoxypropane; 1,2-epoxy-propane;
2,3-epoxypropane; ethylene oxide,
methyl-; methyl ethylene oxide; methyl
oxirane; oxirane, methyl-;
NCI-C50099; oxyde de propylene
(French); propene oxide; propylene epoxide;
propyleneoxide; propane, 1,2-epoxy-;
propane, epoxy-; UN 1280 (Ref.
5.6.) |
The analyte air concentrations
throughout this method are based on the recommended
sampling and analytical parameters. Air concentrations
listed in ppm and ppb are referenced to 25° and 101.3 kPa
(760 mmHg).
1.2. Limit defining
parameters
1.2.1. Detection limit of the analytical
procedure
The detection limit of the analytical
procedure is 24 pg per injection. This is the amount of
propylene oxide that will produce a peak with a height
approximately 5 times the height of baseline noise. (Section
4.1.)
1.2.2. Detection limit of the overall
procedure
The detection limit of the overall
procedure is 0.415 µg per sample (35 ppb or 83
µg/m3). This is the amount of
propylene oxide spiked on an Anasorb 747 adsorbent tube
that, upon analysis, produces a peak similar in size to
that of the detection limit of the analytical procedure.
(Section
4.2.)
1.2.3. Reliable quantitation limit
The reliable quantitation limit is 0.415 µg per
sample (35 ppb or 83 µg/m3. This
is the smallest amount of propylene oxide that can be
quantitated within the requirements of a recovery of at
least 75% and precision (±1.96 SD) of ±25% or better. (Section
4.3.)
The reliable quantitation limit and detection limits
reported in the method are based upon optimization of the
GC for the smallest possible amount of analyte. When the
target concentration of an analyte is exceptionally higher
than these limits, they may not be attainable at the
routine operating parameters.
1.2.4. Instrument response to the analyte
The
instrument response over the concentration ranges of 0.5
to 2 times the TC-1 and TC-20
target concentrations is linear. (Section
4.4.)
1.2.5. Recovery
The recovery of
propylene oxide from samples used in 15-day
storage tests remained above 86% and 91% at the
TC-1 and TC-20 levels
respectively when the samples were stored at ambient
temperatures. (Section
4.5., from regression lines shown in Figures 4.5.1.2.
and 4.5.2.2.)
1.2.6. Precision (analytical procedure)
The pooled coefficients of variation obtained from
replicate injections of analytical standards at 0.5, 1 and
2 times the target concentrations are 0.013 and 0.012 at
the TC-1 and TC-20 levels
respectively. (Section
4.6.)
1.2.7. Precision (overall procedure)
The precisions at the 95% confidence level for the
refrigerated 15-day storage tests are ±11.2%
and ±12.7% at the TC-1 and TC-20
levels respectively. These include an additional ±5% for
pump error. The overall procedure must provide results at
the target concentration that are ±25% or better at the
95% confidence level. (Section
4.7.)
1.2.8. Reproducibility
Six
samples for each target concentration collected from
controlled test atmospheres and a draft copy of this
procedure were given to a chemist unassociated with this
evaluation. The TC-1 and TC-20
samples were analyzed after 37 and 44 days of refrigerated
storage respectively. One of the TC-1 results
was rejected as being an outlier by the Q test. (Ref.
5.7.) None of the other sample results deviated from
its theoretical value by more than the precision reported
in Section 1.2.7. (Section
4.8.) 1.3. Advantage
Reduced
temperature shipment of samples to the laboratory is not
necessary. 2. Sampling
Procedure
2.1. Apparatus
2.1.1. Samples are collected using a personal
sampling pump calibrated to within ±5% of the recommended
flow rate with a sampling tube in line.
2.1.2.
Samples are collected with solid sorbent sampling tubes
containing Anasorb 747. Each tube consists of two sections
of Anasorb 747 separated by a urethane foam plug. The
front section contains 140 mg and the back section, 70 mg.
The sections are held in place with glass wool plugs in a
glass tube 4-mm i.d. x 70-mm
length. For this evaluation, SKC Inc. Lot 645 tubes
(Catalog Number 226-81) were used.
2.2. Reagents
None required
2.3. Technique
2.3.1. Immediately before sampling, break off
the ends of the Anasorb 747 tube. All tubes should be from
the same lot.
2.3.2. Connect the sampling tube to
the sampling pump with flexible tubing. It is desirable to
utilize sampling tube holders that have protective covers
to shield the employee from the sharp, jagged end of the
sampling tube. position the tube so that sampled air
passes through the 140-mg section first.
2.3.3. Air being sampled should not pass through
any hose or tubing before entering the sampling tube.
2.3.4. To avoid channeling, place the sampling
tube vertically in the employee's breathing zone.
2.3.5. After sampling, seal the tubes immediately
with plastic caps and wrap lengthwise with OSHA Form 21.
2.3.6. Submit at least one blank sampling tube
with each sample set. Blanks should be handled in the same
manner as samples, except no air is drawn through them.
2.3.7. Record sample volumes (in liters of air)
for each sample.
2.3.8. List any compounds that
could be considered potential interferences, especially
solvents, that are being used in the sampling area.
2.3.9. Ship any bulk sample(s) in a container
separate from the air samples. 2.4. Sampler capacity
Sampler
capacity is determined by measuring how much air can be
sampled before breakthrough of analyte occurs, i.e., the
sampler capacity is exceeded. Breakthrough studies were
performed by monitoring the effluent from sampling tubes
containing only the 140-mg section of Anasorb
747 while sampling at 0.1 L/min from an atmosphere
containing 40 ppm of propylene oxide. Breakthrough was
considered to occur when the propylene oxide concentration
in the effluent was 5% of the upstream concentration. The
atmosphere was at approximately 80% relative humidity and
20-25°. The average 5% breakthrough volume from
three determinations was 11.1 L.
2.5. Desorption
efficiency
2.5.1. The average desorption efficiency is
98.5% and 98.8% over the range of 0.5 to 2 times the TC-1
and TC-20 levels respectively. (Section
4.9.)
2.5.2. Desorbed samples remain stable
for at least 24 h. (Section
4.10.)
2.5.3. Desorption efficiencies should
be periodically confirmed because differences may occur
due to variations in Anasorb 747, desorption solvent, and
operator technique.
2.6. Recommended air volume
and sampling rate
2.6.1. For TWA samples, the
recommended air volume is 5 L collected at 0.1 L/min
(50-min samples). Although the break through
volume was experimentally determined to exceed 11 L (Section
2.4.), a recommended air volume of 5 L was chosen to
assure that the method will be valid over a wide range of
sampling conditions.
2.6.2. For
short-term samples, the recommended air
volume is 5 L collected at 1.0 L/min (5-min
samples). 2.7. Interferences (sampling)
2.7.1. It is not known if any compound(s) will
severely interfere with the collection of propylene oxide
on Anasorb 747. In general, the presence of other solvent
vapors in the sampled air wall reduce the capacity of
Anasorb 747 to collect propylene oxide.
2.7.2.
Potential interferences used in the sampling area should
be reported to the laboratory with each sample set.
2.8. Safety precautions (sampling)
2.8.1. Attach the sampling equipment to the
employee so that it will not interfere with work
performance or safety. Use sample tube holders with
protective covers whenever possible.
2.8.2. Wear
eye protection when breaking the ends of the Anasorb 747
tubes.
2.8.3. Follow all safety procedures that
apply to the work area being sampled.
3. Analytical Procedure
3.1. Apparatus
3.1.1. A GC equipped with a flame ionization
detector. For this evaluation, a
Hewlett-Packard 5890 Series II Gas
Chromatograph equipped with a 7673A Automatic Sampler was
used.
3.1.2. A GC column capable of separating
propylene oxide from the desorption solvent, internal
standard and any interferences. A thick film,
60-m x 0.32-mm i.d., fused silica
RTx-Volatiles column (Cat. no. 10904, Restek
Corp., Bellefonte, PA) was used in this evaluation.
3.1.3. An electronic integrator or some other
suitable means of measuring peak areas or heights. A
Waters 860 Networking Computer System was used in this
evaluation.
3.1.4. Two-milliliter vials with
Teflon-lined caps.
3.1.5. A dispenser
capable of delivering 1.0 mL of desorption solvent to
prepare standards and samples. If a dispenser is not
available, a 1.0-mL volumetric pipet may be
used. 3.2. Reagents
3.2.1. Propylene oxide, reagent grade. Fisher
scientific Lot 713390 propylene oxide was used in this
evaluation.
3.2.2. Carbon disulfide,
chromatographic grade. Omnisolv, glass distilled carbon
disulfide from EM Science was used in this evaluation.
3.2.3. A suitable internal standard, reagent
grade. Benzene was used in this evaluation.
3.2.4.
The desorption solvent consists of carbon disulfide
containing an internal standard at a concentration of 25
µL/L.
3.2.5. GC grade nitrogen, air, and hydrogen.
3.3. Standard preparation
3.3.1. Prepare concentrated stock standards by
diluting the reagent grade propylene oxide with carbon
disulfide. Prepare working standards by injecting
microliter amounts of concentrated stock standards into
vials containing 1.0 mL of desorption solvent delivered
from the same dispenser used to desorb samples. For
example, prepare a stock standard by diluting 3.00 mL of
propylene oxide (sp gr = 0.830) to 50.0 mL with carbon
disulfide. This stock solution concentration would equal
49.8 µg/L. A working standard of 239.0 µg/sample is
prepared by injecting 4.8 µL of this stock into a vial
containing 1.0 mL of desorption solvent.
3.3.2.
Bracket sample concentrations with working standard
concentrations. If samples fall outside of the
concentration range of prepared standards, prepare and
analyze additional standards to ascertain the linearity of
response. 3.4. Sample preparation
3.4.1. Transfer each Anasorb 747 section of
the samples to separate vials. Discard the glass tubes and
plugs.
3.4.2. Add 1.0 mL of desorption solvent to
each vial using the same dispenser as used for preparation
of standards.
3.4.3. Immediately cap the vials and
shake them periodically for about 10 min before analysis.
3.5. Analysis
3.5.1. GC conditions
|
|
|
|
| column: |
60-m
x 0.32-mm i.d. fused silica,
RTx-Volatiles, thick film |
| injection
volume: |
1.0
µL (with a 17:1 split) |
| zone
temperatures: |
column-
injector-
detector- |
70°
200°
250° |
| gas flows: |
hydrogen (carrier)-
nitrogen (makeup)-
hydrogen (flame)-
air- |
3.7
mL/min (110 kPa head pressure)
22 mL/min
43
mL/min
400 mL/min |
| retention
times: |
propylene oxide-
(benzene- 6.0 min) |
3.0 min |
| chromatograms: |
Section
4.11 |
3.5.2. Peak areas (or heights) are measured
by an integrator or other suitable means.
3.5.3.
An internal standard (ISTD) calibration method is used.
Calibration curves are prepared by plotting micrograms of
propylene oxide per sample versus
ISTD-corrected response of standard
injections. Sample concentrations must be bracketed by
standards. 3.6. Interferences (analytical)
3.6.1. Any compound that produces a flame
ionization detector response and has a similar retention
time as propylene oxide or the internal standard is a
potential interference. Any potential interferences
reported to the laboratory by the industrial hygienist
should be considered before samples are desorbed.
3.6.2. GC parameters (i.e. column and column
temperature) may be changed to possibly circumvent
interferences.
3.6.3. Retention time on a single
column is not considered proof of chemical identity.
Confirmation should be performed by GC/mass spectrometry
or another suitable technique. 3.7.
Calculations
The propylene oxide concentration for
samples is obtained from the calibration curve in terms of
micrograms per sample, uncorrected for desorption
efficiency. The air concentration is calculated using the
following formulae. The back (70-mg) section is
analyzed primarily to determine if there was any
breakthrough from the front (140-mg) section
during sampling. If a significant amount of analyte is found
on the back section (e.g., greater than 25% of the amount
found on the front section), this fact should be reported
with sample results. If any analyte is found on the back
section, it is added to the amount found on the front
section. This total amount is then corrected by subtracting
the total amount (if any) found in the corresponding blank
sampling tube.
| mg/m3
= |
(micrograms of analyte per sample, blank corrected)
(liters of air sampled)(desorption efficiency)
|
| ppm = |
(mg/m3)(24.46)
58.08 |
=
(mg/m3)(0.421)
|
| where |
24.46 = molar
volume (L) at 25° and 101.3 kPa (760 mmHg)
58.08
= molecular weight of propylene
oxide |
3.8. Safety precautions (analytical)
3.8.1. Avoid skin contact and inhalation of
all chemicals.
3.8.2. Restrict the use of all
chemicals to a fume hood then possible.
3.8.3.
Wear safety glasses and a lab coat at all times while in
the lab area. 4. Backup Data
4.1. Detection limit of the
analytical procedure
The injection size listed in
the analytical procedure (1.0 µL with a 17:1 split) was used
in the determination of the detection limit of the
analytical procedure. The detection limit of 24 pg was
determined by making injections of a 415 pg/µL standard.
This amount was judged to produce a peak with a height
approximately 5 times the baseline noise. A chromatogram of
such an injection is shown in Figure
4.1.
4.2. Detection limit of
the overall procedure
Six samples were prepared by
injecting 0.415 µg (5.0 µL of a 0.083 µg/µL standard) of
propylene oxide into the 140-mg section of
Anasorb 747 tubes. The detection limit of the overall
procedure corresponds to an air concentration of 35 ppb (83
µg/m3).
Table 4.2.
Detection Limit
of the Overall Procedure
|
| sample no. |
µg spiked |
µg recovered |
|
1
2
3
4
5
6 |
0.415
0.415
0.415
0.415
0.415
0.415 |
0.379
0.386
0.401
0.388
0.395
0.392 |
|
4.3. Reliable quantitation limit
The
reliable quantitation limit was determined by analyzing
Anasorb 747 tubes that had been spiked with a loading
equivalent to the detection limit of the overall procedure.
Samples were prepared by injecting 0.415 µg (5.0 µL of a
0.083 µg/L standard) of propylene oxide into the
140-mg section of Anasorb 747 tubes. This
amount corresponds to an air concentration of 35 ppb (83
µg/m3).
Table 4.3.
Reliable
Quantitation Limit
(Based on samples and data of Table
4.2)
|
| sample no. |
percent recovered |
statistics |
|
1
2
3
4
5
6 |
91.3
93.0
96.6
93.5
95.2
94.5 |
X
=
SD
=
Precision =
=
|
94.0
1.84
(1.96)(±1.84)
±3.61 |
|
4.4. Instrument response to the analyte
The instrument response to the analyte over the
range of 0.5 to 2 times each target concentration was
determined from multiple injections of analytical standards.
These data are given in Tables 4.4.1.
and 4.4.2.
and Figures 4.4.1.
and 4.4.2.
The response is linear with slopes (in
ISTD-corrected area counts per microgram of
analyte per sample) of 278.9 and 280.2 for the
TC-1 and TC-20 levels
respectively.
Table 4.4.1.
Instrument
Response
|
x
TC-1
µg/sample
ppm |
0.5x
5.976
0.503 |
1x
11.95
1.01 |
2x
23.90
2.01 |
|
| area counts |
1716
1703
1714
1651
1729
1692
|
3426
3383
3467
3368
3376
3389
|
6742
6717
6813
6684
6656
6633
|
| X |
1701 |
3402 |
6708 |
|
Table 4.4.2.
Instrument
Response
|
x
TC-20
µg/sample
ppm |
0.5x
119.5
10.1 |
1x
239.0
20.1 |
2x
478.1
40.3 |
|
| area counts |
34508
34113
34482
34083
34174
33508
|
67259
66119
67717
67721
68350
66971
|
132472
133973
132993
136494
136590
134849
|
| X |
34145 |
67356 |
134562 |
|
4.5. Storage test
Thirty-six samples
were generated at each target concentration by sampling from
atmospheres that were at ambient temperature and
approximately 80% relative humidity. Samples were collected
for 50 min at 0.1 L/min (5-L samples). For each set of 36
samples for each target concentration, six samples were
analyzed immediately after generation, fifteen were stored
in a refrigerator at 0° and fifteen were stored in a closed
drawer at ambient temperatures of 21-25°. Six
samples, three from refrigerated and three from ambient
storage, were analyzed at intervals over a period of fifteen
days. The results are given in Tables 4.5.1. and 4.5.2.
and shown graphically in Figures 4.5.1.1.,
4.5.1.2.,
4.5.2.1.
and 4.5.2.2.
After nine days of ambient temperature storage of the
TC-20 samples, approximately 1% of the
collected propylene oxide was found on the back sections.
Similarly, approximately 2% and 4% was found on the back
sections of the twelve- and
fifteen-day ambient storage samples
respectively There was no observed migration of propylene
oxide for the refrigerated TC-20 samples or any
of the TC-1 samples.
Table 4.5.1.
Storage Test
at TC-1
|
| storage time |
% recovery |
| (days) |
(refrigerated) |
|
(ambient) |
|
0
0
3
6
9
12
15 |
89.2
90.5
92.8
85.8
86.8
87.4
94.2 |
87.6
87.4
90.8
84.7
88.2
85.8
92.0 |
91.2
90.4
92.7
85.0
90.0
87.4
89.5 |
|
89.2
90.5
92.6
87.9
89.2
85.6
87.7 |
87.6
87.4
92.6
86.1
87.1
84.2
87.3 |
91.2
90.4
93.5
86.2
86.7
82.6
88.2 |
|
Table 4.5.2.
Storage Test
at TC-20
|
| storage time |
% recovery |
| (days) |
(refrigerated) |
|
(ambient) |
|
0
0
3
6
9
12
15
|
100.1
98.8
93.6
102.0
90.9
95.8
91.5 |
99.8
98.6
94.7
96.7
87.5
96.2
90.9 |
103.6
99.7
91.5
99.8
87.8
100.8
92.8 |
|
100.1
98.8
91.1
98.2
91.3
100.6
93.4 |
99.8
98.6
92.1
95.7
90.1
96.8
88.8 |
103.6
99.7
91.6
96.5
87.4
94.8
90.2 |
|
4.6. Precision (analytical
Procedure)
The precision of tide analytical
procedure is the pooled coefficient of variation determined
from replicate injections of standards. The precision of the
analytical Procedure for each target concentration is given
in Tables 4.6.1. and 4.6.2.
These tables are based on the data Presented in Section
4.4.
Table 4.6.1.
Precision of
the Analytical Procedure
at 0.5 to 2 times TC-1 (Based
on Table
4.4.1.)
|
x
TC-1
µg/sample
ppm |
0.5x
5.976
0.503 |
1x
11.95
1.01 |
2x
23.90
2.01 |
|
SD (area
counts)
CV
CV =
0.013 |
27.4
0.0161 |
37.8
0.0111 |
65.1
0.0097 |
|
Table 4.6.2.
Precision of
the Analytical Procedure
at 0.5 to 2 times TC-20 (Based
on Table
4.4.2.)
|
x
TC-20
µg/sample
ppm |
0.5x
119.5
10.1 |
1x
239.0
20.1 |
2x
478.1
40.3 |
|
SD (area
counts)
CV
CV =
0.012 |
362.4
0.0106 |
766.7
0.0114 |
1738.1
0.0129 |
|
4.7. Precision (overall procedure)
The precision of the overall procedure is determined
from the storage data. The determination of the standard
error of estimate (SEE) for a regression line plotted
through the graphed storage data allows the inclusion of
storage time as one of the factors affecting overall
precision. The SEE is similar to the standard deviation,
except it is a measure of dispersion of data about a
regression line instead of about a mean. It is determined
with the following equation:
| SEE
= |
[ |
Ó(Yobs -
Yest)2 |
] |
1/2 |
| where |
n =
k =
k = |
total no. of data points
2
for linear regression
3 for quadratic
regression |
|
Yobs = |
observed % recovery at a given
time |
|
Yest = |
estimated % recovery from the
regression line at the same given
time | |
|
|
|
| n
- k |
| |
An additional 5% for pump error is added to
the SEE by the addition of variances. The SEEs are 5.7% and
6.5% at the TC-1 and TC-20 levels
respectively. The precision of the overall procedure is the
precision at the 95% confidence level, which is obtained by
multiplying the SEE (with pump error included) by 1.96 (the
z-statistic from the standard normal
distribution at the 95% confidence level). The 95%
confidence intervals are drawn about their respective
regression lines in the storage graphs The precisions of the
overall procedure are ±11.2% and ±12.7% at the
TC-1 and TC-20 levels
respectively. The SEE and precision of the overall procedure
for each level were obtained from Figures 4.5.1.1.
and 4.5.2.1.
4.8. Reproducibility
Six
samples collected for each target concentration from
controlled test atmospheres (at about 80% R.H.,
23-24°, 86-88 kPa) were analyzed
by a chemist unassociated with this evaluation. The samples
were generated by drawing the test atmospheres through
sampling tubes for 50 min at approximately 0.1 L/min. The
TC-1 and TC-20 samples were stored
in a refrigerator for 37 and 44 days respectively before
being analyzed. About 2-3% of the total amount
of anlyte found was on the back sections of the
TC-20 samples. Sample number 4 at the
TC-1 level was rejected as being an outlier by
the Q test. (Ref.
5.7.)
Table
4.8.1.
Reproducibility at the TC-1
Level
|
| sample no. |
µg found |
µg expected |
% found |
% deviation |
|
1
2
3
4
5
6 |
10.87
11.02
11.50
9.47
10.79
11.00 |
11.18
11.06
11.27
10.88
10.73
10.95 |
97.2
99.6
102.0
87.0
100.6
100.5 |
-2.8
-0.4
+2.0
-13.0
+0.6
+0.5 |
|
Table
4.8.2.
Reproducibility at the TC-20
Level
|
| sample no. |
µg found |
µg expected |
% found |
% deviation |
|
1
2
3
4
5
6 |
216.2
215.0
218.4
208.6
212.0
218.8 |
227.1
224.4
227.1
224.1
224.3
228.7 |
95.2
95.8
96.2
93.1
94.5
95.7 |
-4.8
-4.2
-3.8
-6.9
-5.5
-4.3 |
|
4.9. Desorption efficiency
The
desorption efficiency over the range of 0.5 to 2 times each
target concentration was determined by injecting microliter
amounts of stock standards into the front section of Anasorb
747 tubes.
Table 4.9.
Desorption
Efficiency Data
|
| level |
TC-1
|
|
TC-20
|
x target
concn
µg/sample
ppm |
0.5x
5.976
0.503 |
1x
11.95
1.01 |
2x
23.90
2.01 |
|
0.5x
119.5
10.1 |
1x
239.0
20.1 |
2x
478.1
40.3 |
|
desorption
efficiency,
% |
97.7
98.5
102.3
101.1
99.8
97.0 |
97.8
98.6
98.6
97.8
98.0
97.7
|
98.5
97.8
97.5
97.9
97.7
98.4
|
|
98.7
97.4
97.0
96.1
95.3
98.2
|
97.1
99.0
98.7
96.7
99.0
99.4
|
100.0
101.8
102.5
102.3
103.3
95.1
|
X
|
99.4
|
98.1
|
98.0
|
|
97.1
|
98.3
|
100.8
|
| X |
98.5 |
|
98.8 |
|
4.10. Stability of desorbed samples
The stability of desorbed samples was checked by
reanalyzing the target concentration samples from Section
4.9. one day later using fresh standards. The sample
vials were resealed with new septa after the original
analyses and were allowed to stand at room temperature until
reanalyzed.
Table 4.10.
Stability of
Desorbed Samples
at the Target Concentrations
|
|
% desorption after 24 h
|
| sample no. |
TC-1 |
TC-20 |
|
1
2
3
4
5
6 |
92.9
95.0
94.3
94.3
94.8
94.5
|
97.8
98.6
96.9
96.4
95.1
98.9
|
| X |
94.3 |
97.3 |
|
4.11. Chromatograms
Chromatograms at
each target concentration are shown in Figures 4.11.1.
and 4.11.2.
The chromatograms are from injections of standards
equivalent to 5-L air samples at the target
concentrations.
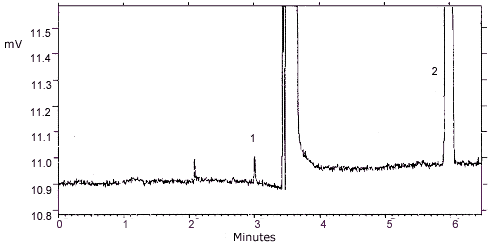
Figure 4.1.
Detection limit chromatogram. Key: (1) propylene oxide (2)
benzene.
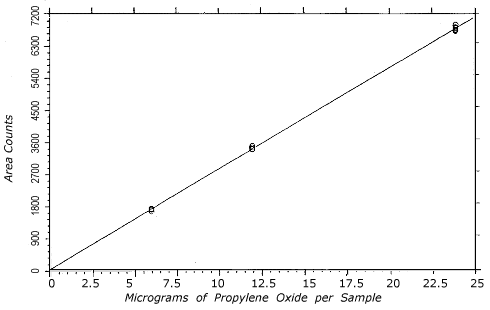
Figure 4.4.1.
Instrument response to propylene oxide over the 0.5 to 2
times the TC-1 range.
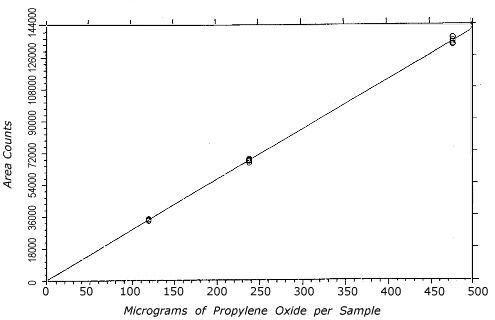
Figure 4.4.2.
Instrument response to propylene oxide over the 0.5 to 2
times the TC-20 range.
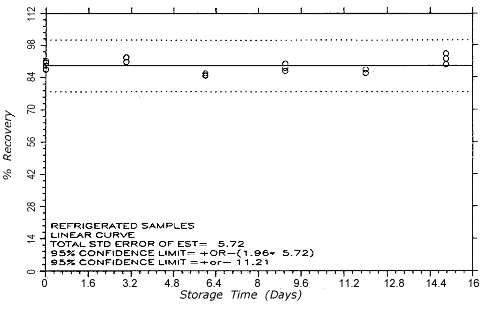
Figure 4.5.1.1.
TC-1 refrigerated storage
samples.
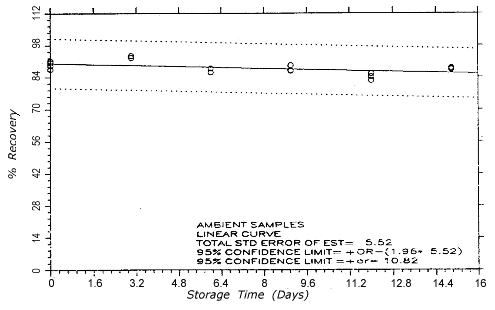
Figure 4.5.1.2.
TC-1 ambient storage
samples.
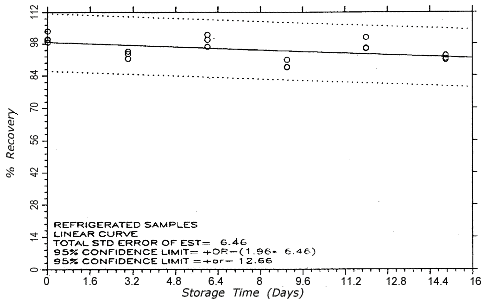
Figure 4.5.2.1.
TC-20 refrigerated storage
samples.
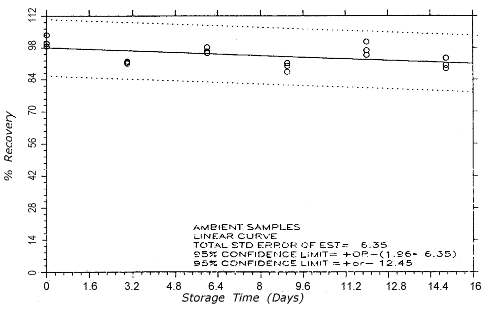
Figure 4.5.2.2.
TC-20 ambient storage
samples.
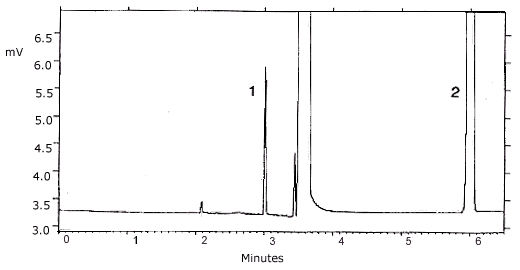
Figure 4.11.1.
Chromatogram of a standard at the TC-1 target
concentration. Key: (1) propylene oxide (2)
benzene.
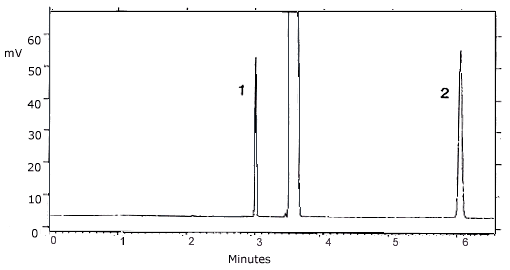
Figure 4.11.2.
Chromatogram of a standard at the TC-20 target
concentration. Key: (1) propylene oxide (2)
benzene. 5. References
5.1. "Code of Federal
Regulations", 29 CFR 1910.1000, Table
Z-1-A.-Limits for Air Contaminants, U.S.
Government Printing Office, Washington, DC, 1990.
5.2. "NIOSH Current Intelligence Bulletin 51:
Carcinogenic Effects of Exposure to Propylene Oxide", U.S.
Department of Health and Human Services, Public Health
Service, Centers for Disease Control, National Institute for
Occupational Safety and Health, Publications Dissemination,
DSDTT; Cincinnati, OH, 1989, Publ. No. 89-111.
5.3. "Code of Federal
Regulations", 29 CFR 1910.1047, Ethylene Oxide, U.S.
Government Printing Office, Washington, DC, 1990.
5.4."NIOSH Manual of Analytical Methods", 3rd
ed. Vol. 2; U.S. Department of Health and Human Services,
Public Health Service, Centers for Disease Control, National
Institute for Occupational Safety and Health, Division of
Physical Sciences and Engineering; Cincinnati, OH, 1985,
Method 1612, DHHS (NIOSH).
5.5.
"Occupational Health Guidelines for Chemical Hazards",
NIOSH/OSHA, Jan. 1981, DHHS (NIOSH) Publ. No.
81-123.
5.6.
"Registry of Toxic Effects of Chemical Substances",
1985-86 ed. Vol. 4; U.S. Department of Health
and Human Services, Public Health Service, Centers for
Disease Control, National Institute for Occupational Safety
and Health, U.S. Government Printing Office, Washington, DC,
1987.
5.7. Miller, J. C.; Miller,
J. N. "Statistics for Analytical Chemistry", Ellis Horwood
Limited: Chichester, England, 1984, p 59-62.
|
| |
| |

