ETHYLVINYLBENZENE
STYRENE
| Method no.: | 89 |
| Matrix: | Air |
| Target concentration: | 50 ppm (215 mg/m3) for
styrene 7.6 ppm (40 mg/m3) for ethylvinylbenzene 10 ppm (50 mg/m3) for divinylbenzene |
| Procedure: | Samples are collected by drawing air through glass sampling tubes containing coconut shell charcoal coated with 4-tert-butylcatechol. Samples are desorbed with toluene and analyzed by GC using a flame ionization detector. |
| Recommended air volume and sampling rate: |
12 L at 0.05 L/min |
| Reliable quantitation limit: | 100 ppb (426 µg/m3) for
styrene 71 ppb (384 µg/m3) for ethylvinylbenzene 94 ppb (500 µg/m3) for divinylbenzene |
| Standard error of estimate at the target concentration: |
7.4% for styrene |
| (Section 4.7.) | 5.2% for ethylvinylbenzene 5.2% for divinylbenzene |
| Status of method: | Evaluated method. This method has been subjected to the established evaluation procedures of the Organic Methods Evaluation Branch. |
| Date: July 1991 | Chemist: Donald Burright |
OSHA Salt Lake Technical Center
Salt Lake City, UT 84165-0200
1. General Discussion
- 1.1. Background
- 1.1.1. History
The evaluation presented here was initiated as an effort to
overcome the low and
Divinylbenzene (DVB) was included for evaluation because preliminary tests with coconut shell charcoal sampling tubes and carbon disulfide (CS2) desorption confirmed it also had low desorption efficiency problems. This was anticipated because it is structurally similar to styrene. The collection of styrene and DVB on the same sampler was desirable because the two chemicals are used together in the production of some polymers.
The inclusion of DVB, for evaluation, led to the evaluation of the procedure for ethylvinylbenzene (EVB). Although EVB has no OSHA PEL, it is a significant and inherent contaminant of the commonly used grades of DVB. Technical (tech) grade DVB typically contains 42% EVB by weight. Because the OSHA PEL for DVB applies only to the isomers of DVB and not to the tech grade DVB. Therefore for that reason, EVB was quantitated separately. o-DVB is not found in tech grade DVB, because it is converted to naphthalene during the production of DVB.
The procedure presented here successfully overcomes the low and non-linear desorption efficiency that styrene displayed at low sampler loadings when collected with coconut shell charcoal and desorbed with CS2. This procedure also improved the desorption efficiency for DVB.
1.1.2. Toxic effects (This section is for information only and should not be taken as the basis of OSHA policy.)
Styrene is readily absorbed by the respiratory and gastrointestinal systems, and the skin. Exposures to styrene have caused central nervous system depression and complaints about headache, fatigue, sleepiness, nausea, malaise, difficulty in concentrating, and a feeling of intoxication. Styrene vapor is an irritant to the eyes and upper respiratory system. Liquid styrene is a skin irritant. Studies have suggested that styrene exposure has affected liver function. (Ref. 5.3.) The OSHA PEL for styrene is 50 ppm (215 mg/m3) for a time weighted average (TWA) and 100 ppm (425 mg/m3) for a short-term exposure limit (STEL). These values are the final rule limits of Title 29 Code of Federal Regulations. (Ref. 5.4.) The LD50 in rats for styrene is 1220 mg/kg (Ref. 5.5.).
The toxic effects of tech grade DVB are similar to those encountered with styrene. As with styrene, the odor can be detected at levels below dangerous concentrations. Eye and nasal irritation may occur at concentrations above 100 ppm. The LD50 in rats for divinylbenzene is 4640 mg/kg. (Ref. 5.5.) The OSHA PEL for DVB is 10 ppm (50 mg/m3) for a TWA. This is the final rule limit of Title 29 Code of Federal Regulations. (Ref. 5.4.) There is no OSHA PEL or ACGIH TLV for EVB. The LD50 in rats for m-ethylvinylbenzene is 4360 mg/kg (Ref. 5.5.).
1.1.3. Workplace exposure
NIOSH estimates that at least 30 thousand workers in 1000 plants are potentially exposed in the United States on a full-time basis to styrene. It is also estimated that compounds containing styrene are utilized in over 20 thousand facilities with more than 300 thousand workers potentially exposed. In 1981, 3.3 million tons were produced in the United States. It was estimated that in 1984, styrene would be consumed by the production of the following products: 62% in polystyrene, 22% in copolymers such as styrene-acrylonitrile and acrylonitrile-butadiene-styrene, 7% in styrene-butadiene rubber, 7% in unsaturated polyester resins, and 2% in miscellaneous uses. (Ref. 5.3.)
No estimate was found of the estimated number of workers potentially exposed to EVB and DVB. In 1981, 3000-4000 metric tons of DVB and about 2000-3000 metric tons of EVB was produced in the world. The largest use for DVB is as copolymer with styrene in ion-exchange resins (Ref. 5.6.).
1.1.4. Physical properties and other descriptive information (Ref. 5.3. for styrene and Ref. 5.6. for DVB, unless otherwise stated)
| compound: | styrene | tech grade DVB* |
| CAS number: | 100-42-5 | 1321-74-0 |
| molecular weight: | 104.15 | 130.19 |
| melting point: | -30.6°C | -45°C |
| boiling point: | 145.0°C | 195°C (calculated) |
| chemical formula: | C6H5CH=CH2 | CH2=CHC6H4CH=CH2 |
| vapor pressure: | 1.09 kPa (8.21 mmHg) | 0.12 kPa (0.9 mmHg) |
| at 30°C | ||
| density: | 0.9059 g/mL | 0.9162 g/mL |
| at 20°C | ||
| self-ignition | ||
| temperature: | 490°C | |
| flash point: | 31.1°C | 74°C |
| (Cleveland open cup) | ||
| solubility: | slightly soluble in water; soluble in most organic solvents | slightly soluble in water; soluble in most organic solvents |
| synonyms: | cinnamene; cinnamenol; ethenylbenzene; vinyl benzene; phenylethylene | DVB; vinyl styrene; divinylbenzene |
| compound: | ethylvinylbenzene | |
| CAS no.: | 28106-30-1 | |
| molecular weight: | 132.22 | |
| synonyms: | ethyl styrene; EVB | |
| chemical formula: | CH3CH2C6H4CH=CH2 | |
* tech grade DVB used in this evaluation contained 55% DVB, 42% EVB (CAS no. 28106-30-l), 1.5% diethylbenzene (CAS no. 25340-17-4), 1.5% naphthalene (CAS no. 91-20-3) and 1500 ppm 4-tert-butylcatechol (inhibitor) (CAS no. 98-29-3) (Ref. 5.7.)
The analyte air concentrations throughout this method are based on the recommended sampling and analytical parameters. Air concentrations listed in ppm and ppb are referenced to 25°C and 101.3 kPa (760 mmHg).
1.2. Limit defining parameters
- 1.2.1. Detection limit of the analytical procedure
The detection limits of the analytical procedure are 0.127, 0.115, and 0.151 ng per injection (1.0-µL injection with a 40:1 split) for styrene, EVR and DVB respectively. These are the amounts of analyte that will produce peaks with heights that are approximately 5 times the baseline noise or a nearby contaminant peak. (Section 4.1.)
1.2.2. Detection limit of the overall procedure
The detection limits of the overall procedure are 5.09, 4.60 and 6.02 µg per sample for styrene, EVB and DVB respectively. These are the amounts of each analyte spiked on the sampling device that, upon analysis, produces a peak similar in size to that of the respective detection limit of the analytical procedure. These detection limits correspond to air concentrations of 100 ppb (426 µg/m3), 71 ppb (384 µg/m3), and 94 ppb (500 µg/m3) for styrene, EVB and DVB respectively. (Section 4.2.)
1.2.3. Reliable quantitation limit
The reliable quantitation limits are 5.09, 4.60 and 6.02 µg per sample for styrene, EVB and DVB respectively. These are the amounts of each analyte spiked on the sampling device that, upon analysis , produces a peak similar in size to that of the respective detection limit of the analytical procedure and can be quantitated within the requirements of a recovery of at least 75% and a precision (±1.96 SD) of ±25% or better. These detection limits correspond to air concentrations of 100 ppb (426 µg/m3), 71 ppb (384 µg/m3), and 94 ppb (500 µg/m3) for styrene, EVB and DVB respectively. (Section 4.3.)
The reliable quantitation limit and detection limits reported in the method are based upon optimization of the instrument for the smallest possible amount of analyte. When the target concentration of analyte is exceptionally higher than these limits, they may not be attainable at the routine operating parameters.
- 1.2.4. Instrument response to the analyte
The instrument responses over concentration ranges representing 0.5 to 2 times the target concentration are linear. (Section 4.4.)
1.2.5. Recovery
The recoveries of styrene, EVB and DVB from samples used in 17-day storage tests remained above 89.7%, 91.0% and 75.0% respectively. The samples were stored in a closed drawer at about 22°C. (Section 4.5., regression lines of Figures 4.5.1.1., 4.5.2.1. and 4.5.3.1.)
1.2.6. Precision (analytical procedure only)
The pooled coefficients of variation obtained from replicate determinations of analytical standards at 0.5, 1 and 2 times the target concentrations are 0.0123, 0.0052 and 0.0058 for styrene, EVB and DVB respectively. (Section 4.6.)
1.2.7. Precision (overall procedure)
The precisions at the 95% confidence level for the 17-day ambient temperature storage tests are ±14.5%, ±10.2% and ±10.2% for styrene, EVB and DVB respectively. (Section 4.7.) These each include an additional ±5% for sampling error.
1.2.8. Reproducibility
Six samples, liquid-spiked with styrene and tech grade DVB and a draft copy of this procedure were given to a chemist unassociated with this evaluation. The samples were analyzed for styrene and EVB after 55 days of refrigerated storage. No individual sample result for styrene and EVB deviated from its theoretical value by more than the precision reported in Section 1.2.7. The values for DVB were not within established precision limits. The data could not be reanalyzed because it was no longer available. The test was repeated for DVB.
In the repeated test, six samples, liquid-spiked with tech grade DVB and a draft copy of this procedure were given to a chemist unassociated with this evaluation. The samples were analyzed only for DVB after 1 day of ambient storage. No individual sample result deviated from its theoretical value by more than the precision reported in Section 1.2.7. (Sectioil 4.8.)
1.3. Advantages
- 1.3.1. The new sampler provides better desorption
characteristics than those of OSHA Method 9 (Ref. 5.1.). This
eliminates the need to apply a large correction for desorption at
low sampler loadings.
1.3.2. The desorption efficiency for DVB from TBC-coated coconut shell charcoal is 81.8% with toluene as the desorbing solvent; it was only 58.2% when desorbing with CS2.
1.3.3. The sampler may be used for other analytes as long as they are compatible with the desorbing solvent, toluene.
1.4. Disadvantages
An extended chromatographic run time was used to remove the late eluting TBC from the analytical column.
2. Sampling Procedure
- 2.1. Apparatus
- 2.1.1. Samples are collected using a personal sampling pump that
can be calibrated within ±5% of the recommended flow rate with the
sampling device attached.
2.1.2. Samples are collected with 4-mm i.d. × 6-mm o.d. × 7.0 cm glass sampling tubes packed with two sections of coconut shell charcoal that has been coated with TBC, 10% by weight. The front section contains 110 mg and the back section contains 55 mg of TBC-coated coconut shell charcoal.
The sections are held in place with glass wool plugs. For this evaluation, tubes were purchased from SKC, Inc. (catalog no. 226-73).
2.2. Reagents
No sampling reagents are required.
2.3. Technique
- 2.3.1. Immediately before sampling, break off the ends of the
TBC-coated coconut shell charcoal tube. All tubes should be from the
same lot.
2.3.2. Attach the sampling tube to the sampling pump with flexible tubing. It is desirable to utilize sampling tube holders which have a protective cover to shield the employee from the sharp, jagged end of the sampling tube. Position the tube so that sampled air first passes through the 110-mg section.
2.3.3. Air being sampled should not pass through any hose or tubing before entering the sampling tube.
2.3.4. Attach the sampler vertically with the 110-mg section pointing downward, in the worker's breathing zone so it does not impede work performance or safety.
2.3.5. After sampling for the appropriate time, remove the sample and seal the tube with plastic end caps. Wrap each sample end-to-end with a Form OSHA-21 seal.
2.3.6. Submit at least one blank sample with each set of samples. Handle the blank sampler in the same manner as the other samples except draw no air through it.
2.3.7. Record sample volumes (in liters of air) for each sample, along with any potential interferences.
2.3.8. Ship any bulk samples in a container separate from the air samples.
2.3.9. Submit the samples to the laboratory for analysis as soon as possible after sampling. If delay is unavoidable, store the samples at reduced temperature.
2.4. Sampler capacity
- 2.4.1. The sampling capacity of the front section of a
TBC-coated coconut shell charcoal sampling tube was tested by
sampling from a gas sampling bag containing an atmosphere of 99.3
ppm (423 mg/m3) of styrene at ambient
temperature and 80% relative humidity. The sampling rate was 0.05
L/min.
No breakthrough was observed after sampling for 6 h at 0.05 L/min or a total of 18 L.
2.4.2. Because a stable atmosphere of EVB and DVB could not be
produced, a
During the same test, styrene was found on four of the back tubes and reached the 5% breakthrough air volume after 14.5 L had been pulled through the tube. The recovery of styrene from all of the tubes was 87.8%, which is about 8.0% less than the desorption efficiency. (Section 4.9.)
2.5. Desorption efficiency
- 2.5.1. The average desorption efficiencies from TBC-coated
coconut shell charcoal adsorbent are 95.8%, 95.0% and 81.8% for
styrene, EVB and DVB over the range of 0.5 to 2 times the target
concentration. (Section 4.10.1.)
2.5.2. Desorbed samples remain stable for at least 24 h. (Section 4.10.2.)
2.6. Recommended air volume and sampling rate
- 2.6.1. For time-weighted average samples, the recommended air
volume is 12 L collected at 0.05 L/min (4-h samples).
2.6.2. For short-term exposure limit samples, the recommended air volume is 0.75 L collected at 0.05 L/min (15-min samples).
2.6.3. When short-term exposure limit samples are required, the reliable quantitation limit becomes larger. For example, the reliable quantitation limits are 1.6 ppm (6.8 mg/m3), 1.1 ppm (6.1 mg/m3) and 1.5 ppm (8.0 mg/m3) for styrene, EVB and DVB respectively when 0.75 L of air is collected.
2.7. Interferences (sampling)
- 2.7.1. It is not known if any compounds will severely interfere
with the collection of styrene, EVB or DVB on TBC-coated coconut
shell charcoal. In general, the presence of other contaminant vapors
in the air will reduce the capacity of TBC-coated coconut shell
charcoal to collect styrene, EVB or DVB.
2.7.2. Suspected interferences should be reported to the laboratory with submitted samples.
2.8. Safety precautions (sampling)
- 2.8.1. The sampling equipment should be attached to the worker
in such a manner that it will not interfere with work performance or
safety.
2.8.2. All safety practices that apply to the work area being sampled should be followed.
2.8.3. Protective eyewear should be worn when breaking the ends of the glass sampling tubes.
3. Analytical Procedure
- 3.1. Apparatus
- 3.1.1. A GC equipped with a flame ionization detector (FID). A
Hewlett-Packard 5890 Gas Chromatograph equipped with a 7673A
Autosampler and an FID was used in this evaluation.
3.1.2. A GC column capable of separating styrene, EVB, DVB and the internal standard from the desorbing solvent and any potential interferences. A 60-m × 0.32-mm i.d. DB-5 (1.0-µm film thickness) capillary column (J & W Scientific) was used in this evaluation.
3.1.3. An electronic integrator or some other suitable means of measuring detector response. A Waters 860 Networking Computer System were used in this evaluation.
3.1.4. Two-milliliter vials with polytetrafluoroethylene-lined caps.
3.1.5. A dispenser capable of delivering 1.0 mL of desorbing solution is used to prepare standards and samples. If a dispenser is not available, a 1.0-mL volumetric pipet may be used.
3.2. Reagents
- 3.2.1. Styrene. Reagent grade or better should be used. The
styrene, 99+% (GOLD LABEL), used in this evaluation was purchased
from Aldrich Chemical Co. (Milwaukee, WI).
3.2.2. divinylbenzene. The divinylbenzene used in this evaluation was purchased from Pfaltz & Bauer (Stamford, CT). This was technical grade DVB and contained 55% m- and p-divinylbenzene, 42% m- and p-ethylvinylbenzene and 3% other compounds.
3.2.3. Toluene. Reagent grade or better should be used. The toluene (b&j brand HIGH PURITY SOLVENT) used in this evaluation was purchased from American Burdick & Jackson (Muskegon, MI).
3.2.4. Desorbing solution. The desorbing solution is prepared by adding 250 µL of an appropriate internal standard to 1 L of toluene. n-Hexylbenzene (reagent grade) was used in this evaluation and was purchased from ICN (Plainview, NY).
3.3. Standard preparation
- 3.3.1. Prepare concentrated stock standards of styrene, EVB and
DVB in toluene. Prepare working analytical standards by injecting
microliter amounts of concentrated stock standards into 2-mL vials
containing 1 mL of desorbing solution delivered from the same
dispenser used to desorb samples. For example, to prepare a target
level standard, inject 10 PL of a stock solution containing 254,
44.6 and 58.5 mg/mL of styrene, EVB and DVB respectively in toluene
into 1 mL of desorbing solution.
3.3.2. Prepare a sufficient number of analytical standards to generate a calibration curve. Ensure that the amount of styrene, EVB and DVB found in the samples is bracketed by the range of the standards. Prepare additional standards if necessary.
3.4. Sample preparation
- 3.4.1. Remove the plastic caps from the sample tube and
carefully transfer each section of the adsorbent to separate 2-mL
vials. Discard the glass tube and glass wool plugs.
3.4.2. Add 1.0 mL of desorbing solution to each vial and immediately seal the vials with polytetrafluoroethylene-lined caps.
3.4.3. Shake the vials vigorously several times during the next 30 min.
3.5. Analysis
- 3.5.1. Analytical conditions
| GC conditions | |
| initial | |
| temperatures: | 100°C (column) 200°C (injector) 300°C (detector) |
| temp program: | hold initial temp 1.0 min, increase temp at 5°C/mic to 150°C, then increase temp at 10°C/min to 280°C. |
| column gas flow: | 1.2 mL/min (hydrogen) |
| septum purge: | 1.5 mL/min (hydrogen) |
| injection size: | 1.0 µL (40:1 split) |
| column: | 60 m × 0.32-mm i.d. capillary DB-5 (l.0-µm film thickness) |
| retention times: | 9.3 min (styrene) 14.1 min (m-EVB) 14.3 min (p-EVB) 14.9 min (m-DVB) 15.2 min (p-DVB) 18.2 min (n-hexylbenzene) |
| FID conditions | |
| hydrogen flow: | 34 mL/min |
| air flow: | 450 mL/min |
| nitrogen makeup flow: |
33 mL/min |
| chromatogram: | Figure 3.5.1. |
3.5.2. Measure detector response using a suitable method such as electronic integration.
3.5.3. An internal standard (ISTD) calibration method is used. A calibration curve can be constructed by plotting micrograms of analyte per sample versus ISTD-corrected response of standard injections. Bracket the samples with freshly prepared analytical standards over a range of concentrations. Because the analytes EVB and DVB each consist of a pair of isomers (meta and para), the peak areas of each pair are summed to give the response for that analyte.
3.6. Interferences (analytical)
- 3.6.1. Any compound that produces an FID response and has a
similar retention time as the analyte or internal standard is a
potential interference. If any potential interferences were
reported, they should be considered before samples are desorbed.
Generally, chromatographic conditions can be altered to separate an
interference from the analyte.
3.6.2. Retention time on a single column is not considered proof of chemical identity. Analysis by an alternate GC column or confirmation by mass spectrometry are additional means of identification.
3.7. Calculations
The analyte concentration for samples is obtained from the appropriate calibration curve in terms of micrograms per sample, uncorrected for desorption efficiency. The air concentration is calculated using the following formulae. The back (55-mg) section is analyzed primarily to determine the extent of sample saturation during sampling. If any analyte is found on the back section, it is added to the amount on the front section. This total amount is then corrected by subtracting the total amount (if any) found on the blank.
| mg/m3 = | (micrograms of analyte per
sample, blank corrected)
(liters of air sampled) (desorption efficiency) |
| ppm = | (mg/m3) (24.46)
(molecular weight of analyte) |
where
| 24.46 | = | molar volume (liters) at 101.3 kPa (760 mmHg) and 25°C |
| molecular weight = | 104.15 for styrene 132.22 for EVB 130.19 for DVB |
3.8. Safety precautions (analytical)
- 3.8.1. Restrict the use of all chemicals to a fume hood.
3.8.2. Avoid skin contact and inhalation of all chemicals.
3.8.3. Wear safety glasses, gloves and a lab coat at all times while in the laboratory areas.
4. Backup Data
- 4.1. Detection limit of the analytical procedure
The detection limits of the analytical procedure are 0.127, 0.115, and 0.151 ng per injection, based on a 1.0-µL injection (with a 40:1 split) of a standard containing 5.09 µg/mL of styrene, 4.60 µg/mL of EVB, and 6.02 µg/mL of DVB respectively. These amounts produced analyte peaks with height about 5 times the height of the baseline noise (for EVB and DVB) or a nearby contaminant peak (for styrene). Chromatograms of the detection limits of the analytical procedure are shown in Figures 4.1.1. and 4.1.2. Only the meta isomers for EVB and DVB were considered for this test, the para isomers were less than 5 times the height of the baseline noise.
4.2. Detection limit of the overall procedure
The detection limits of the overall procedure are 5.09 µg per sample (100 ppb or 426 µg/m3) for styrene, 4.60 µg per sample (71 ppb or 384 µg/m3) for EVB, and 6.02 µg per sample (94 ppb or 500 µg/m3) for DVB. The injection size listed in the analytical procedure (1.0 µL, 40:1 split) was used in the determination of the detection limit of the overall procedure. Six vials containing 110 mg of TBC-coated coconut shell charcoal were spiked with 5.09 µg of styrene, 4.60 µg of EVB, and 6.02 µg of DVB. The samples were stored at ambient temperature and were desorbed about 24 h after being spiked. Only the meta isomers for EVB and DVB were considered for this test, the para isomers were less than 5 times the height of the baseline noise.
Detection Limit
of the Overall Procedure for Styrene
|
| ||
| sample no. | µg spiked | µg recovered |
|
| ||
| 1 | 5.09 | 4.56 |
| 2 | 5.09 | 4.37 |
| 3 | 5.09 | 4.40 |
| 4 | 5.09 | 4.44 |
| 5 | 5.09 | 4.28 |
| 6 | 5.09 | 4.52 |
|
| ||
Detection Limit
of the Overall Procedure for EVB
|
| ||
| sample no. | µg spiked | µg recovered |
|
| ||
| 1 | 4.60 | 4.31 |
| 2 | 4.60 | 4.43 |
| 3 | 4.60 | 4.38 |
| 4 | 4.60 | 4.48 |
| 5 | 4.60 | 4.02 |
| 6 | 4.60 | 4.55 |
|
| ||
Detection Limit
of the Overall Procedure for DVB
|
| ||
| sample no. | µg spiked | µg recovered |
|
| ||
| 1 | 6.02 | 5.17 |
| 2 | 6.02 | 5.48 |
| 3 | 6.02 | 5.00 |
| 4 | 6.02 | 5.55 |
| 5 | 6.02 | 5.00 |
| 6 | 6.02 | 5.19 |
|
| ||
4.3. Reliable quantitation limit data
The reliable quantitation limits are 5.09 µg per sample (100 ppb or 426 µg/m3) for styrene, 4.60 µg per sample (71 ppb or 384 µg/m3) for EVB, and 6.02 µg per sample (94 ppb or 500 µg/m3) for DVB. The injection size listed in the analytical procedure (1.0 µL 40:1 split) was used in the determination of the reliable quantitation limit. Six vials containing 110 mg of TBC-coated coconut shell charcoal were liquid-spiked with a toluene solution containing styrene, EVB and DVB. Because the recovery of the analytes from the spiked samples was greater than 75% and had a precision of ±25% or better, the detection limits of the overall procedure and reliable quantitation limit are the same. Only the meta isomers for EVB and DVB were considered for this test, the para isomers were less than 5 times the height of the baseline noise.
Reliable Quantitation Limit for Styrene
(Based on samples and data of Table 4.2.1.)
|
| |||
| percent recovered |
statistics | ||
|
| |||
| 89.6 | |||
| 85.9 | = | 87.0 | |
| 86.4 | SD | = | 2.0 |
| 87.2 | Precision | = | (1.96)(±2.0) |
| 84.1 | = | ±3.9 | |
| 88.8 | |||
|
| |||
Reliable Quantitation Limit for EVB
(Based on samples and data of Table 4.2.2.)
|
| |||
| percent recovered |
statistics | ||
|
| |||
| 93.7 | |||
| 96.3 | = | 94.8 | |
| 95.2 | SD | = | 4.0 |
| 97.4 | Precision | = | (1.96)(±4.0) |
| 87.4 | = | ±7.8 | |
| 98.9 | |||
|
| |||
Reliable Quantitation Limit for DVB
(Based on samples and data of Table 4.2.3.)
|
| |||
| percent recovered |
statistics | ||
|
| |||
| 85.9 | |||
| 91.0 | = | 86.9 | |
| 83.1 | SD | = | 3.9 |
| 92.2 | Precision | = | (1.96)(±3.9) |
| 83.1 | = | ±7.6 | |
| 86.2 | |||
|
| |||
4.4. Instrument response to the analyte
The instrument response to styrene, EVB and DVB over the range of 0.5 to 2 times the target concentration is linear with a slope of 205, 205, and 204 (in ISTD-corrected area counts per microgram per sample) respectively. The precision of the response to the analytes was determined by multiple injections of standards. The data below is presented graphically in Figures 4.4.1.-4.4.3.
Instrument Response to Styrene
Injection Split = 40:1
|
| |||
| × target concn | 0.5× | 1× | 2× |
| µg/mL | 1269 | 2537 | 5074 |
|
| |||
| area counts | 262250 | 531098 | 1039966 |
| 258308 | 543880 | 1027745 | |
| 256228 | 532772 | 1045269 | |
| 257649 | 522966 | 1043518 | |
| 263441 | 532464 | 1042270 | |
| 266211 | 532625 | 1056193 | |
| 260681 | 532634 | 1042494 | |
|
| |||
Instrument Response to EVB
Injection Split = 40:1
|
| |||
| × target concn | 0.5× | 1× | 2× |
| µg/mL | 223 | 446 | 892 |
|
| |||
| area counts | 45263 | 91821 | 182599 |
| 45057 | 92287 | 182420 | |
| 44978 | 91847 | 182674 | |
| 45178 | 90897 | 182208 | |
| 45689 | 92063 | 182221 | |
| 46063 | 91570 | 183022 | |
| 45371 | 91748 | 182524 | |
|
| |||
Instrument Response to DVB
Injection Split = 40:1
|
| |||
| × target concn | 0.5× | 1× | 2× |
| µg/mL | 293 | 585 | 1170 |
|
| |||
| area counts | 58946 | 119742 | 238241 |
| 58881 | 120439 | 238099 | |
| 58688 | 119573 | 238203 | |
| 58966 | 118365 | 238047 | |
| 59275 | 119465 | 237883 | |
| 60060 | 119505 | 238453 | |
| 59136 | 119515 | 238154 | |
|
| |||
4.5. Storage data
Storage samples for styrene were generated by sampling for 30 min at the recommended sampling rate from a test atmosphere at 80% relative humidity containing styrene at 8 times the target concentration. The ability to adjust the concentration of the styrene atmosphere was limited due to restrictions in the available equipment. EVB and DVB storage samples were generated by drawing air through tubes at the recommended flow rate after they had been spiked with EVB and DVB on their glass wool plugs. Thirty-six storage samples of each type were collected. One-half of the tubes was stored at reduced temperature (-20°C) and the other half was stored in a closed drawer at ambient temperature (about 22°C). At 3-4 day intervals, three samples were selected from each of the two storage sets and analyzed. The results are listed below and shown graphically in Figures 4.5.1.1.-4.5.3.2.
Storage Test of Styrene
|
| |||||||
| storage time | % recovery | % recovery | |||||
| (days) | (ambient) | (refrigerated) | |||||
|
| |||||||
| 0 | 96.3 | 101.0 | 92.8 | 96.3 | 101.0 | 92.8 | |
| 85.6 | 91.2 | 92.2 | 85.6 | 91.2 | 92.2 | ||
| 4 | 85.1 | 89.6 | 79.2 | 85.9 | 92.4 | 90.6 | |
| 7 | 89.5 | 95.0 | 96.4 | 95.6 | 97.5 | 94.3 | |
| 11 | 84.4 | 94.1 | 90.0 | 95.4 | 93.2 | 88.1 | |
| 14 | 92.4 | 86.7 | 81.5 | 96.5 | 83.9 | 97.1 | |
| 17 | 90.1 | 95.8 | 92.8 | 94.2 | 96.1 | 92.7 | |
|
| |||||||
Storage Test of EVB
|
| |||||||
| storage time | % recovery | % recovery | |||||
| (days) | (ambient) | (refrigerated) | |||||
|
| |||||||
| 0 | 96.9 | 95.5 | 96.1 | 96.9 | 95.5 | 96.1 | |
| 95.5 | 93.3 | 94.8 | 95.5 | 93.3 | 94.8 | ||
| 3 | 93.4 | 93.4 | 94.9 | 96.2 | 95.4 | 94.8 | |
| 7 | 91.5 | 93.1 | 90.3 | 91.7 | 94.2 | 94.7 | |
| 10 | 92.0 | 91.3 | 91.5 | 96.1 | 96.1 | 95.8 | |
| 14 | 93.6 | 93.2 | 93.6 | 98.0 | 98.5 | 98.8 | |
| 17 | 90.2 | 90.0 | 90.4 | 94.9 | 95.8 | 96.2 | |
|
| |||||||
Storage Test of DVB
|
| |||||||
| storage time | % recovery | % recovery | |||||
| (days) | (ambient) | (refrigerated) | |||||
|
| |||||||
| 0 | 85.5 | 83.5 | 84.2 | 85.5 | 83.5 | 84.2 | |
| 83.5 | 82.3 | 83.9 | 83.5 | 82.3 | 83.9 | ||
| 3 | 80.6 | 80.7 | 81.8 | 82.5 | 82.3 | 82.2 | |
| 7 | 78.6 | 78.9 | 75.5 | 78.6 | 81.0 | 80.5 | |
| 10 | 77.9 | 77.0 | 77.8 | 82.3 | 82.3 | 83.2 | |
| 14 | 77.2 | 76.4 | 77.5 | 81.5 | 82.4 | 82.2 | |
| 17 | 75.9 | 75.3 | 76.2 | 81.0 | 82.8 | 81.8 | |
|
| |||||||
4.6. Precision (analytical method)
The precision of the analytical procedure is defined as the pooled
coefficient of variation determined from replicate injections of
styrene, EVB and DVB standards at 0.5, 1 and 2 times the target
concentration. Based on the data of Tables 4.4.1.-4.4.3., the
coefficients of variation (CV) for the three levels and the pooled
coefficient of variation (![]() ) were calculated and are listed below.
) were calculated and are listed below.
Precision of the Analytical Method for Styrene
(Based on the Data of Table 4.4.1.)
|
| |||
| × target concn | 0.5× | 1× | 2× |
| µg/mL | 1269 | 2537 | 5074 |
|
| |||
| SD1 | 3883.6 | 6667.8 | 9174.2 |
| CV | 0.0149 | 0.0125 | 0.0088 |
|
| |||
| 1 standard deviation is in area counts | |||
Precision of the Analytical Method for EVB
(Based on the Data of Table 4.4.2.)
|
| |||
| × target concn | 0.5× | 1× | 2× |
| µg/mL | 223 | 446 | 892 |
|
| |||
| SD1 | 420.7 | 483.5 | 310.0 |
| CV | 0.0068 | 0.0058 | 0.0013 |
|
| |||
| 1 standard deviation is in area counts | |||
Precision of the Analytical Method for DVB
(Based on the Data of Table 4.4.3.)
|
| |||
| × target concn | 0.5× | 1× | 2× |
| µg/mL | 293 | 585 | 1170 |
|
| |||
| SD1 | 490.8 | 670.8 | 209.0 |
| CV | 0.0083 | 0.0056 | 0.0008 |
|
| |||
| 1 standard deviation is in area counts | |||
4.7. Precision (overall procedure)
The precision of the overall procedure is determined from the storage data. The determination of the standard error of estimate (SEE) for a regression line plotted through the graphed storage data allows the inclusion of storage time as one of the factors affecting overall precision. The SEE is similar to the standard deviation, except it is a measure of dispersion of data about a regression line instead of about a mean. It is determined with the following equation:

| where n | = | total no. of data points |
| k | = | 2 for linear regression |
| k | = | 3 for quadratic regression |
| Yobs | = | observed % recovery at a given time |
| Yest | = | estimated % recovery from the regression line at the same given time |
An additional 5% for pump error is added to the SEE by the addition of variances. The precision at the 95% confidence level is obtained by multiplying the SEE (with pump error included) by 1.96 (the z-statistic from the standard normal distribution at the 95% confidence level). The 95% confidence intervals are drawn about their respective regression line in the storage graph as shown in Figure 4.5.1.1. The data for Figures 4.5.1.1., 4.5.2.1. and 4.5.3.1. were used to determine the SEEs of ±7.4%, ±5.2% and ±5.2% and the precisions of the overall procedure of ±14.5%, ±10.2% and ±10.2% for styrene, EVB and DVB respectively.
4.8. Reproducibility data
Six samples were prepared by injecting an aliquot of a toluene solution containing the analytes onto the glass wool plug in front of the sorbent while air was being pulled through the tubes. More air was drawn through the tubes to transfer the analytes to the TBC-coated coconut shell charcoal. The samples were given to a chemist unassociated with this study. The samples were analyzed after being stored for 55 days at 5°C. The desorption efficiencies were used to determine the sample results. No sample result for styrene or EVB had a deviation greater than the precisions of the overall procedure determined in Section 4.7., which are ±14.5% and ±10.2% respectively.
An additional six samples were prepared for DVB in the same manner as described above. The samples were analyzed only for DVB after being stored for 1 day at 23°C. No sample result had a deviation greater than the precision of the overall procedure, ±10.2%.
Reproducibility Data for Styrene
|
| |||
| µg spiked | µg recovered | % recovered | % deviation |
|
| |||
| 2537 | 2469 | 97.3 | -2.7 |
| 2537 | 2339 | 92.2 | -7.8 |
| 1269 | 1154 | 90.9 | -9.1 |
| 1269 | 1119 | 88.2 | -11.8 |
| 3806 | 3612 | 94.9 | -5.1 |
| 3836 | 3548 | 93.2 | -6.8 |
|
| |||
Reproducibility Data for EVB
|
| |||
| µg spiked | µg recovered | % recovered | % deviation |
|
| |||
| 446 | 435 | 97.5 | -2.5 |
| 446 | 429 | 96.2 | -3.8 |
| 223 | 212 | 95.1 | -4.9 |
| 223 | 205 | 91.9 | -8.1 |
| 669 | 645 | 96.4 | -3.6 |
| 669 | 640 | 95.7 | -4.3 |
|
| |||
Reproducibility Data for DVB
|
| |||
| µg spiked | µg recovered | % recovered | % deviation |
|
| |||
| 277 | 287 | 103.6 | +3.6 |
| 277 | 268 | 96.8 | -3.2 |
| 554 | 539 | 97.3 | -2.7 |
| 554 | 534 | 96.4 | -3.6 |
| 831 | 813 | 97.8 | -2.2 |
| 831 | 813 | 97.8 | -2.2 |
|
| |||
4.9. Sampler capacity
Because a stable atmosphere of EVB and DVB could not be produced, another approach had to be used to test for sampler capacity. A tube containing 110 mg of TBC-coated coconut shell charcoal was used as the front section for this test. The glass wool plug in the front of the tube was pulled away from the adsorbent but left in the tube. A new TBC-coated coconut shell charcoal tube was attached in series downstream from the front section. While air was flowing through the tubes at 0.05 L/min, a 5-µL spike containing styrene, EVB and DVB in toluene was injected onto the front glass wool plug of the front tube. This resulted in an equivalent upstream atmospheric concentrations of 846, 149 and 195 mg/m3 for styrene, EVB and DVB respectively, assuming a 1.5 L air volume. This injection was repeated every 30 min for a total of 12 injections over 6 h. Immediately before the second and subsequent injections were performed, the back tube was removed and a new tube installed. No EVB or DVB was found on any of the 12 back tubes and 92.6% of the EVB and 84.3% of the DVB were recovered from the front tube. These values are close to the desorption efficiencies for the compounds.
Styrene was found on four of the back tubes and reached the 5% breakthrough air volume after 14.5 L had been pulled through the tube. Breakthrough was considered to have occurred when the amount on the back tube contained a concentration of analyte that was 5% (5% breakthrough) of the upstream concentration. The data in Table 4.9. is shown graphically in Figure 4.9. The recovery of styrene from all of the tubes was 87.8%, which is about 8.0% less than the desorption efficiency.
Styrene Breakthrough Data
|
| |||
| air vol | sample time | downstream | breakthrough |
| (L) | (min) | (mg/m3) | (%) |
|
| |||
| 0.75 | 15 | 0 | 0 |
| 2.25 | 45 | 0 | 0 |
| 3.75 | 75 | 0 | 0 |
| 5.25 | 105 | 0 | 0 |
| 6.75 | 135 | 0 | 0 |
| 8.25 | 165 | 0 | 0 |
| 9.75 | 195 | 0 | 0 |
| 11.25 | 225 | 0 | 0 |
| 12.75 | 255 | 3.1 | 0.2 |
| 14.25 | 285 | 55.1 | 4.3 |
| 15.75 | 315 | 117.6 | 9.3 |
| 17.25 | 345 | 228.1 | 18.0 |
|
| |||
4.10. Desorption efficiency and stability of desorbed samples
- 4.10.1. Desorption efficiency
The desorption efficiencies (DE) of styrene, EVB and DVB were determined by liquid-spiking 110-mg portions of TBC-coated coconut shell charcoal with the analytes at 0.5 to 2 times the target concentrations. These samples were stored overnight at ambient temperature and then desorbed with desorbing solution and analyzed. The average desorption efficiency over the studied range was 95.8%, 95.0% and 81.8% for styrene, EVB and DVB respectively.
Desorption Efficiency of Styrene
|
| |||
| × target concn | 0.5× | 1× | 2× |
| µg/mL | 1269 | 2537 | 5074 |
|
| |||
| DE, % | 94.7 | 99.5 | 92.1 |
| 95.7 | 96.0 | 94.5 | |
| 95.0 | 97.7 | 95.3 | |
| 95.1 | 98.3 | 93.7 | |
| 95.5 | 98.4 | 94.5 | |
| 95.0 | 97.6 | 94.8 | |
| 95.2 | 97.9 | 94.2 | |
|
| |||
Desorption Efficiency of EVB
|
| |||
| × target concn | 0.5× | 1× | 2× |
| µg/mL | 223 | 446 | 892 |
|
| |||
| DE, % | 92.8 | 96.5 | 94.2 |
| 93.6 | 94.8 | 95.5 | |
| 92.5 | 95.4 | 96.5 | |
| 93.9 | 96.2 | 95.8 | |
| 94.8 | 95.9 | 95.8 | |
| 93.6 | 95.9 | 96.4 | |
| 93.5 | 95.8 | 95.7 | |
|
| |||
Desorption Efficiency of DVB
|
| |||
| × target concn | 0.5× | 1× | 2× |
| µg/mL | 293 | 585 | 1170 |
|
| |||
| DE, % | 78.0 | 84.2 | 83.2 |
| 79.1 | 82.4 | 82.7 | |
| 79.4 | 82.7 | 83.0 | |
| 79.9 | 83.6 | 82.6 | |
| 80.2 | 83.0 | 83.2 | |
| 80.0 | 82.8 | 83.2 | |
| 79.4 | 83.1 | 83.0 | |
|
| |||
4.10.2. Stability of desorbed samples
The stability of desorbed samples was investigated by reanalyzing the target concentration samples 24 h after initial analysis. The original analysis was performed and the vials were not recapped after injection. The samples were reanalyzed with fresh standards. The average recovery of the reanalysis, compared to the average recovery of the original analysis, was 95.8% (-2.1% change), 95.0% (-0.8% change) and 80.6% (-2.5% change) for styrene, EVB and DVB respectively.
Stability of Desorbed Samples for Styrene
|
| ||
| initial recovery | recovery after 24 h | percent |
| (percent) | (percent) | change |
|
| ||
| 99.5 | 95.1 | -4.4 |
| 96.0 | 95.7 | -0.3 |
| 97.7 | 96.9 | -0.8 |
| 98.3 | 95.7 | -2.6 |
| 98.4 | 94.4 | -4.0 |
| 97.6 | 97.0 | -0.6 |
|
| ||
Stability of Desorbed Samples for EVB
|
| ||
| initial recovery | recovery after 24 h | percent |
| (percent) | (percent) | change |
|
| ||
| 96.5 | 95.3 | -1.2 |
| 94.8 | 94.4 | -0.4 |
| 95.4 | 95.9 | +0.5 |
| 96.2 | 94.8 | -1.4 |
| 95.9 | 95.0 | -0.9 |
| 95.9 | 94.8 | -1.1 |
|
| ||
Stability of Desorbed Samples for DVB
|
| ||
| initial recovery | recovery after 24 h | percent |
| (percent) | (percent) | change |
|
| ||
| 84.2 | 81.1 | -3.1 |
| 82.4 | 80.3 | -2.1 |
| 82.7 | 80.6 | -2.1 |
| 83.6 | 81.0 | -2.5 |
| 83.0 | 79.6 | -3.4 |
| 82.8 | 81.2 | -1.6 |
|
| ||
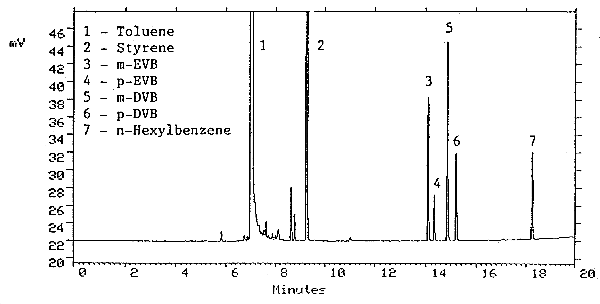
Figure 3.5.1. Chromatogram of styrene, EVB and DVB at the target
concentration. 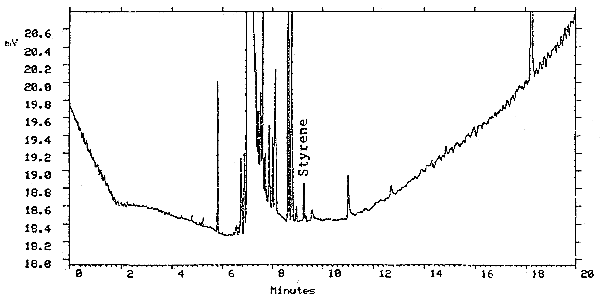
Figure 4.1.1. Chromatogram of styrene at the detection limit, 0.127
ng per injection, injection 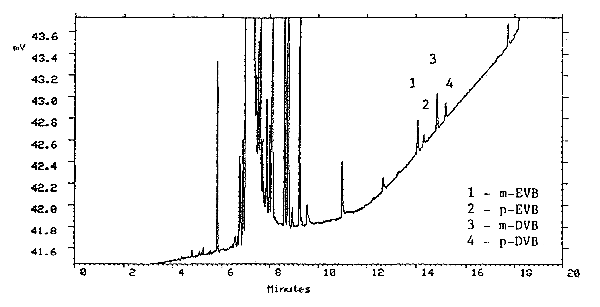
Figure 4.1.2. Chromatogram of EVB and DVB at the detection limit,
0.115 and 0.151 ng per injection respectively, injection split = 40:1.
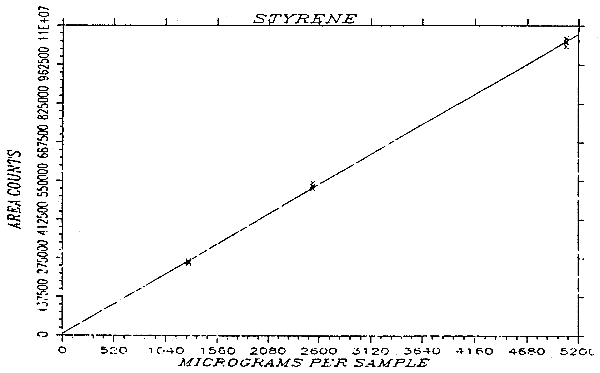
Figure 4.4.1. Instrument response curve for styrene, slope = 235 area
counts per micrograms per sample, injection split = 40:1.

Figure 4.4.2. Instrument response curve for EVB, slope = 205 area
counts per micrograms per sample, injection split = 40:1.

Figure 4.4.3. Instrument response curve for DVB, slope = 204 area
cwnts per micrograms per sample, injection split = 40:1.
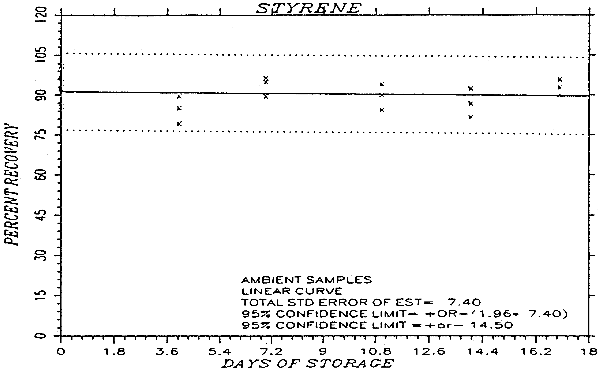
Figure 4.5.1.1. Ambient storage test for styrene.
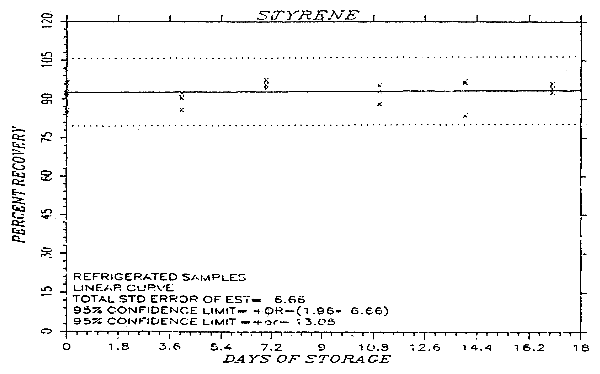
Figure 4.5.1.2. Refrigerated storage test for styrene.
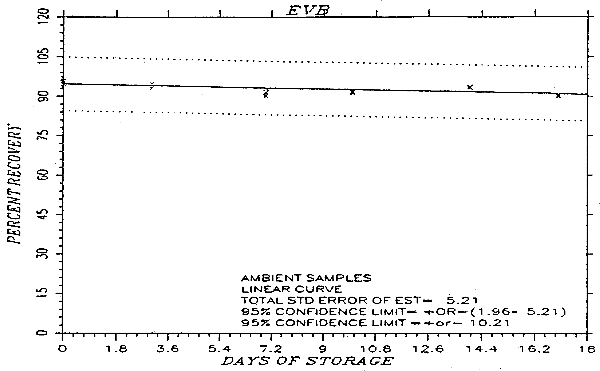
Figure 4.5.2.1. Ambient storage test for EVB. 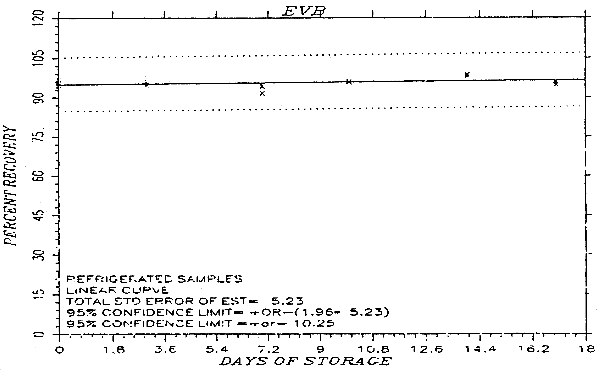
Figure 4.5.2.2. Refrigerated storage test for EVB.

Figure 4.5.3.1. Ambient storage test for DVB. 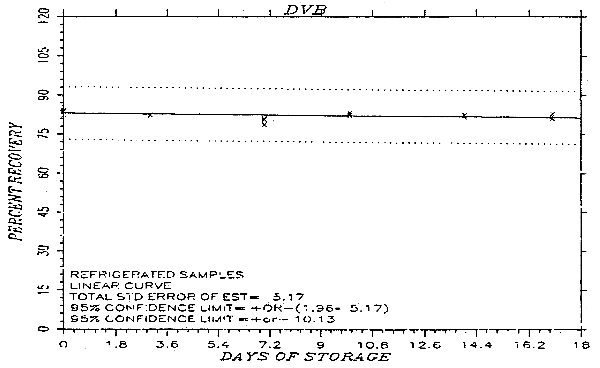
Figure 4.5.3.2. Refrigerated storage test for DVB.
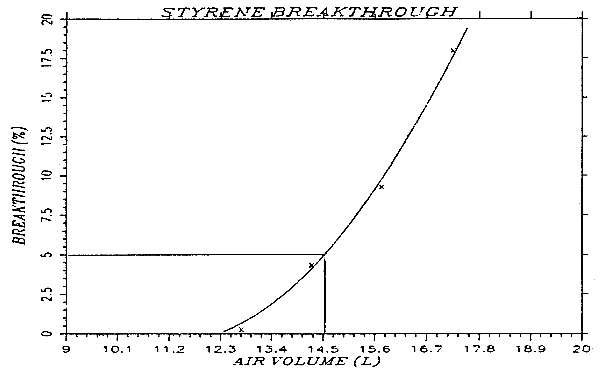
Figure 4.9. Determination of the 5% breakthrough air volume for styrene, 14.5 L at 846 mg/m3.
5. References
- 5.1. "OSHA Analytical Methods Manual", 2nd ed., U.S. Department of
Labor, Occupational Safety and Health Administration; OSHA Analytical
Laboratory; Salt Lake City, UT, 1990; Method 9 - Styrene; American
Conference or Government Industrial Hygienists (ACGIH); Cincinnati,
OH, Publ. No. 4542.
5.2. "OSHA Analytical Methods Manual", 2nd ed., U.S. Department of Labor, Occupational Safety and Health Administration; OSHA Analytical Laboratory; Salt Lake City, UT, 1990; Method 56 - 1,3-Butadiene; American Conference of Government Industrial Hygienists (ACGIH); Cincinnati, OH, Publ. No. 4542.
5.3. "NIOSH Criteria for a Recommended Standard: Occupational Exposure to Styrene", U.S. Department of Health and Human Services, Public Health Service, Center for Disease Control, National Institute for Occupational Safety and Health, Cincinnati, OH, 1983, DHHS (NIOSH) Publ. No. 83-119.
5.4. "Code of Federal Regulations", Title 29, 1910.1000, Table Z-l-A. Limits for Air Contaminants, U.S. Government Printing Office, Washington, D.C., 1990.
5.5. Lewis, P.J. et al. in "Kirk-Othmer Encyclopedia of Technology" 3rd ed.; Grayson, M., Ed.; John Wiley & Sons, New York, 1980, Vol. 21, pp 770-801.
5.6. Sweet, D.V., Ed., "Registry of Toxic Effects of Chemical Substances", 1985-86 ed., U.S. Department of Health and Human Services, Government Printing Office, DHHS(NIOSH), Publication No. 87-114.
5.7. Tradenames Database on CCINFO CD-ROM disc 89-2, Canadian Centre for Occupational Health and Safety, Hamilton, Ontario.