![]()
| Method number | 107 | ||
| Matrix: | Air | ||
|
| |||
| Maneb | Zineb | ||
|
| |||
| Target concentration: | 5 mg/m3 TWA | 5 mg/m3 TWA | |
| OSHA PEL: | None | None | |
| ACGIH TLV: | None* | None | |
|
| |||
| *5 mg/m3 for
manganese dust and compounds, as Mn 0.2 mg/m3 for elemental manganese and inorganic compounds | |||
| Procedure: | Samples are collected by drawing known volumes of air through sampling cassettes containing a membrane filter made of mixed esters of cellulose. Samples are extracted with an aqueous solution of 5%. cysteine and 5%. EDTA and analyzed by LC using a UV detector. | ||
| Recommended air volume and sampling rate: |
500 L at 2.0 L/min | ||
|
| |||
| Maneb | Zineb | ||
|
| |||
| Reliable quantitation limit: | 220 µg/m3 | 103 µg/m3 | |
| Standard error of estimate: | 10.1% | 9.9% | |
|
| |||
| Status of method: | Evaluated method. This method has been subjected to the established evaluation procedures of the Organic Methods Evaluation Branch. | ||
| Date: February 1996 | Chemist: Yihlin Chan | ||
OSHA Salt Lake Technical Center
Salt Lake City, UT 84165-0200
1. General Discussion
- 1.1 Background
- 1.1.1 History
Thiocarbamates and dithiocarbamates are two of the most important families of fungicides (Ref. 5.1). The latter family includes compounds such as ziram, nabam, ferbam, maneb, and zineb. Of these, maneb and zineb are the most commonly used. They and nabam are ethylenebisdithiocarbamates (EBDTC). Although their toxicities are not very high (oral LD50s for mouse are 4100 mg/kg and 7600 mg/kg for maneb and zineb, respectively), monitoring of EBDTC in the working environment or in food residues is important because they can decompose on heating to form ethylene thiourea, an animal carcinogen (Ref. 5.2).
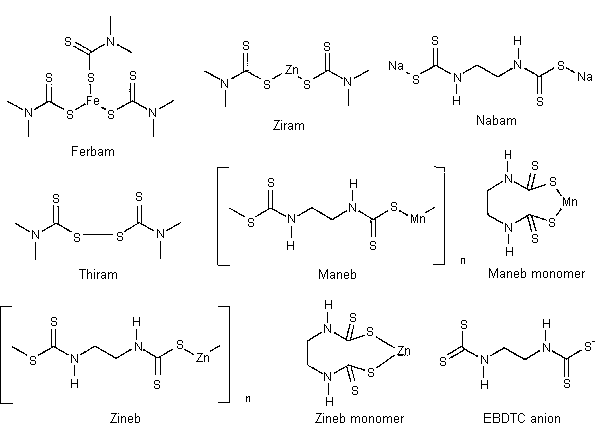
- Currently the most common analytical method for maneb and zineb
is based on acid hydrolysis with the measurement of the released
carbon disulfide by head-space GC analysis (Ref. 5.3). The method is
nonspecific because it does not distinguish dialkyl dithiocarbamates
(such as ziram and ferbam) or thiuram disulfide (such as thiram)
from EBDTC.
When OSHA SLTC first received a set of samples for maneb
analysis, it was noted that maneb is soluble in chloroform according
to Merck Index. The samples were extracted with chloroform and
analyzed by normal-phase LC. The maneb in the eluted peak was
confirmed by mass spectrometry (direct probe). Later it was decided
to do a
Although Merck Index listed their structures as monomeric, maneb and zineb are really polymeric. This makes them difficult to analyze because they are not soluble in most solvents. The reason Merck index (Ref. 5.4) listed their structures as monomeric and described them as soluble in chloroform and other solvents was probably because the scientists who first synthesized these compounds purified them by recrystallization and consequently obtained monomeric maneb and zineb. In the eleventh edition of the Merck Index, the structures of maneb and zineb were corrected to the polymeric forms but they are still listed as soluble in chloroform etc. (Ref. 5.5)
One way to dissolve maneb or zineb is to use chelating agents
such as
When developing this method, DMSO and DMF were first tested to see if they dissolve and depolymerize maneb and zineb. Maneb and zineb went into solution readily but LC analysis under various conditions were unsuccessful. Nabam was next synthesized from ethylenediamine and carbon disulfide. With the authentic nabam in hand, the LC conditions for its analysis were developed, and nabam was found to decompose when dissolved in DMSO.
In considering the analytical procedure, the head-space GC
analysis of carbon disulfide after acid hydrolysis of EBDTC was
considered cumbersome. Besides, it suffers from many interferences.
Derivatization of the EBDTC anion to methyl ester involves
Because maneb and zineb cannot be dissolved without decomposition, many of the standard OSHA tests for validating a method cannot be followed. The analyte cannot be accurately liquid spiked onto the sampling medium. The aerosol generator could not be used with either an atomizer or a vibrating orifice because these require the source material be dissolved in some kind of solvent. Marple and coworkers developed a dust generator in which the powder is fed by a bead-chain conveyor into a fluidized bed where it is deagglomerated and aerosolized (Ref. 5.10). This kind of dust generator is available from TSI Incorporated of St. Paul, Minnesota (Model 3400). But with our set up for the generator and the test chamber we were unable to obtain a steady, uniform dust atmosphere.
Considering the dusty nature of the analytes, an electrically conductive carbon-filled polypropylene 3-piece sampling cassette with a 51-mm extension, containing a support pad and a 0.8 µm membrane filter made of mixed esters of cellulose was selected for the sampling medium. The test samples were prepared by weighing maneb or zineb directly onto the filter. This would mean that numbers such as the reliable quantitation limit can only be as good as the accuracy of the balance. Mixtures of maneb or zineb with sucrose (10.0% maneb or 11.0% zineb by weight) were used as the test materials in order to extend the reference materials and to improve precision. Sucrose was selected because it was sometimes used as a wetting powder in the field. The mixtures were prepared by using a freezer mill, where maneb (or zineb) and sucrose in a tube are pounded rapidly with a stainless steel ball while submerged in liquid nitrogen.
1.1.2 Toxic effects (This section is for information only and should not be taken as the basis of OSHA policy.)
Maneb can cause irritation of eyes, nose, and throat. Under
normal use conditions, maneb is generally regarded as harmless,
except for occasional signs of local irritation. However, it
reportedly caused acute renal failure and ECG abnormalities in a
Zineb can cause irritation to eyes, nose, and throat and is harmful if inhaled. Zineb produced an increased incidence of lung tumors after its oral administration in one strain of mice. Systemic reticulum-cell sarcomas were observed in mice and a variety of sarcomas in rats after its subcutaneous administration. No increases in tumor incidence were observed in two other strains of mice and in two limited studies in rats following oral administration. The available data do not allow an evaluation of the carcinogenicity of zineb to be made. (Ref. 5.2)
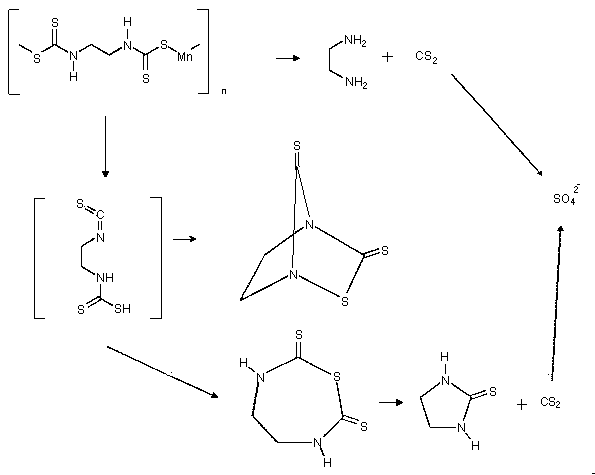
- In rats, 55% of an oral dose of maneb was excreted in the urine
and feces within three days. After 24 hours, the body organs
contained 1.2% of the dose as metabolizes, and on day 5, less than
0.18% Ethylenediamine, ethylenebisthiuram monosulfide and ethylene
thiourea were present in the urine and feces. Ethylene thiourea is a
known animal carcinogen. The above metabolic pathways had been
suggested for maneb and zineb in rats. (Ref. 5.2).
1.1.3 Workplace exposure
Maneb is used exclusively as a broad spectrum contact fungicide and is registered for use on more than 46 crops in the United States. The principal diseases controlled by maneb are early and late blight of potato and tomato, downy mildew and anthracnose on a number of vegetables and the so-called `rot' diseases of fruits such as apricots, peaches and grapes. It is also used for seed treatment of small grains such as wheat. (Ref. 5.2) Workers handling various formulations of maneb in the applications mentioned above may be exposed.
Zineb is a fungicide registered for use in the United States on more than 50 crops, including fruits, vegetables, ornamental plants, and for treatment of many seeds. Zineb is also registered for use as a fungicide in paints and for mold control on fabrics, leather, paper, plastic and wood surfaces. (Ref. 5.2) Workers handling zineb in its various formulations in the applications mentioned above may be exposed.
An acceptable daily intake for man of 0-0.005 mg per kilogram
body weight for all
1.1.4 Physical properties and other descriptive information (Ref. 5.2)
Maneb
| CAS no.: | 12427-38-2 |
| synonyms: | 1,2-ethanediylbis(carbamodithioato)(2-)-manganese;
|
| structural formula: | 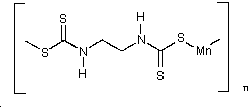 |
| formula wt: | 265.29 |
| melting point | decomposes before melting |
| appearance: | yellow-brownish powder |
| specific gravity: | 1.92 |
| vapor pressure: | less than 1×10⁻⁵ Pa at 20°C |
| volubility: | insoluble in most solvents; "soluble in chloroform, pyridine; moderately soluble in water" - (Merck Index. Probably for monomeric maneb.) |
| Zineb | |
| CAS no.: | 12122-67-7 |
| synonyms: | 1,2-ethanediylbis(carbamodithioato) |
| structural formula: | 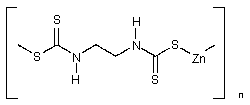 |
| formula wt. | 275.75 |
| appearance: | light tan powder |
| melting point | decomposes on heating |
| specific gravity: | 1.92 |
| vapor pressure: | negligible at 25°C |
| solubility: | insoluble in most solvents; "soluble in carbon disulfide, chloroform, pyridine; practically insoluble in water" - (Merck Index, probably for monomeric zineb.) |
The analyte air concentrations throughout this method are based on the recommended sampling and analytical parameters.
1.2 Limit defining parameters
- 1.2.1 Detection limit of the analytical procedure
The detection limits of the analytical procedure are 0.84 and 0.86 ng on column for maneb and zineb, respectively. These are the amounts of analytes that will give responses that are significantly different from the background responses of reagent blanks. (Sections 4.1 and 4.2)
1.2.2 Detection limit of the overall procedure
The detection limits of the overall procedure are 33 and 15 µg per sample (66 and 30 µg/m3) for maneb and zineb, respectively. These are the amounts of analyte spiked on the sampler that will give responses that are significantly different from the background responses of sampler blanks. (Sections 4.1 and 4.3)
1.2.3 Reliable quantitation limit
The reliable quantitation limits are 110 and 51 µg per sample (220 and 103 µg/m3) for maneb and zineb, respectively. These are the amounts of analyte spiked on a sampler that will give signals that are considered the lower limits for precise quantitative measurements. (Section 4.4)
1.2.4 Precision (analytical procedure)
The precision of the analytical procedure, measured as the pooled relative standard deviations over a concentration range equivalent to 0.5 to 2 times the target concentration, are 0.64% and 0.34% for maneb and zineb, respectively. (Section 4.5)
1.2.5 Precision (overall procedure)
The precision of the overall procedure at the 95% confidence level for the ambient temperature 15-day storage tests (at the target concentration) are ±19.8% and ±19.4% for maneb and zineb, respectively (Section 4.6). These include additional 5% for sampling error.
1.2.6 Recovery
The recovery of ethylenebisdithiocarbamate from samples used in 15-day storage tests remained above 93.1% and 96.5% for maneb and zineb, respectively, when the samples were stored at ambient temperature. (Section 4.7)
1.2.7 Reproducibility
Twelve samples, prepared by weighing, were submitted to an SLTC organic service branch for analysis, using a draft copy of this procedure. The samples were analyzed after 2 days of storage at ambient temperature. No individual sample result deviated from its theoretical value by more than the precision reported in Section 1.2.5. (Section 4.8)
2. Sampling Procedure
- 2.1 Apparatus
- 2.1.1 A personal sampling pump, calibrated to ±5% of the
recommended flow rate with the sampling device attached.
2.1.2 A conductive 3-piece sampling cassette with a 51-mm extension, containing a support pad (25-mm diameter) and a 0.8 µm membrane filter made of mixed esters of cellulose. The sampling media used in this study were obtained from Gelman (catalog number 4375). It contained a GN-4 filter made of mixed esters of cellulose.
2.2 Reagents
None required.
2.3 Technique
- 2.3.1 Remove the top piece of the cassette for open-face
sampling.
2.3.2 Attach the sampler to the sampling pump with a piece of flexible tubing and place it in the worker's breathing zone.
2.3.3 Air should not pass through any hose or tubing before entering the sampling cassette.
2.3.4 After sampling replace the top piece and cap both ends. Wrap each sample with a Form OSHA-21 seal.
2.3.5 Record air volume for each sample.
2.3.6 Submit at least one blank with each set of samples. Blanks should be handled in the same manner as samples, except no air is drawn through them.
2.3.7 List any compounds that could be considered potential interferences.
2.4 Sampler capacity
Sampling capacity was not tested. Generally dusts of such low vapor pressure as maneb or zineb are not expected to show significant loss due to evaporation or sublimation. Retention efficiencies were tested, with the recoveries of 97.0% and 102.8% for maneb and zineb, respectively (Section 4.9).
2.5 Extraction efficiency
- 2.5.1 The average extraction efficiencies for
ethylenebisdithiocarbamate from mixed cellulose ester membrane
filters spiked with maneb/sucrose or zineb/sucrose mixture, over the
range of 0.5 to 2.0 times the target concentration, were 100.4% and
98.5% for maneb and zineb, respectively. (Section 4.10.1)
2.5.2 The extraction efficiencies at 0.05, 0.1, and 0.2 times the target concentration (TC) are listed below. (Section 4.10.1 )
| Table 2.5.2 Extraction Efficiencies (%) at 0.05, 0.1, and 0.2 Times the Target Concentration | ||
| maneb | zineb | |
|
| ||
| 0.05× TC | 96.9 | 96.5 |
| 0.1× TC | 100.6 | 102.7 |
| 0.2× TC | 92.3 | 100.6 |
|
| ||
2.5.3 Extracted samples remain stable for at least 24 h. (Section 4. 10.2)
2.6 Recommended air volume and sampling rate
- 2.6.1 The recommended air volume is 500 L at 2.0 L/min.
2.6.2 For short-term sampling the recommended air volume is 30 L at 2.0 L/min.
2.6.3 When short-term samples are collected, the air concentrations equivalent to the reliable quantitation limits become larger. For example, the reliable quantitation limit is 3.7 mg/m3 for maneb when 30 L is collected.
2.7 Interferences (sampling)
None.
2.8 Safety precautions (sampling)
- 2.8.1 The sampling equipment should be attached to the worker in
such a manner that it will not interfere with work performance or
safety.
2.8.2 All safety practices that apply to the work area being sampled should be followed.
3. Analytical Procedure
- 3.1 Apparatus
- 3.1.1 An LC equipped with a UV detector. A BAS 200 HPLC
(Bioanalytical Systems, Inc., West Lafayette, Indiana) equipped with
a UV detector and a Waters 712 autosampler were used in this
evaluation.
3.1.2 An anion-exchange column capable of separating ethylenebisdithiocarbamate from any interferences. A Hamilton PRP-X100 column (4.1 mm × 150 mm) column was used in this evaluation.
3.1.3 An electronic integrator or other suitable means of measuring detector response. A Waters 860 Networking Computer System was used in this evaluation.
3.1.4 Glass vials, 20-mL, with
3.1.5 A dispenser capable of delivering 4.0 mL of extraction solution.
3.2 Reagents
- 3.2.1 Maneb. Maneb, 95%, was obtained from Chem Services.
3.2.2 Zineb. Zineb, Tech grade, was obtained from Chem Services.
3.2.3 Ethylenediaminetetraacetic acid, tetrasodium salt hydrate. Ethylenediaminetetraacetic acid, tetrasodium salt hydrate, 98%, was obtained from Aldrich.
3.2.4 L-Cysteine hydrochloride hydrate. L-Cysteine hydrochloride hydrate, 99%, was obtained from Aldrich.
3.2.5 Sodium perchlorate. Sodium perchlorate, HPLC grade, was obtained from Fisher.
3.2.6 Sodium hydroxide. Sodium hydroxide, reagent grade, was obtained from VWR.
3.2.7 Extraction solution. Dissolve 50 g of ethylenediaminetetraacetic acid tetrasodium salt hydrate and 50 g of L-cysteine hydrochloride hydrate in 800 mL of water. Adjust to pH 9.6 with 12 N sodium hydroxide. Make the final volume to 1000 mL with water. Store in a brown bottle and use within a month.
3.2.8 LC mobile phase. Dissolve 3.8 g of ethylenediaminetetraacetic acid tetrasodium salt hydrate and 8.4 g of sodium perchlorate in 1000 mL of water.
3.3 Standard preparation
- 3.3.1 Prepare stock standards by dissolving weighed amounts of
maneb or zineb in the extraction solvent and sonicating for 60 min.
3.3.2 Prepare analytical standards by diluting the stock standards with the extraction solvent. For maneb or zineb, a 625 µg/mL standard solution corresponds to the target concentration.
3.3.3 Prepare a sufficient number of analytical standards to generate a calibration curve. Analytical standard concentrations must bracket sample concentrations.
3.4 Sample preparation
- 3.4.1 Transfer the filter with its collected dust to a glass
vial. Discard the supporting pad.
3.4.2 Add 4.0 mL of the extraction solvent to each vial.
3.4.3 Cap the vials and shake them on a mechanical shaker for 60 min.
3.5 Analysis
- 3.5.1 HPLC conditions
| column: | Hamilton PRP-X1OO (150 mm, 4.1-mm id., 10-µm particle size) 0.01 M ethylenediaminetetraacetic acid, tetrasodium salt, 0.06 sodium perchlorate |
| mobile phase: | 1.0 mL/min |
| flow rate: | 1.0 mL/min |
| UV detector | 286 nm |
| injection size: | 10 µL |
| retention time: | ethylenebisdithiocarbamate 5.0 min |
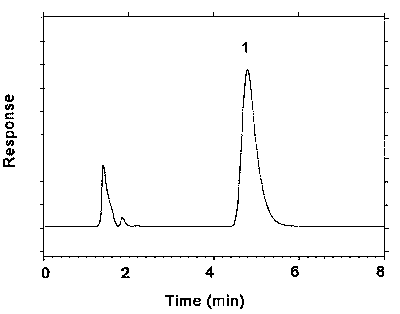
Figure 3.5.1. Chromatogram at target concentration.
Key: 1 = ethylenebisdithiocarbamate.
3.5.2 Measure peak areas by an electronic integrator or other suitable means.
3.5.3 Prepare a calibration curve by plotting micrograms per milliliter versus peak areas of standards. Bracket the samples with analytical standards.
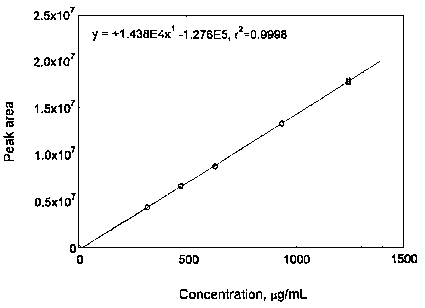
Figure 3.5.3.1. Calibration curve of maneb.
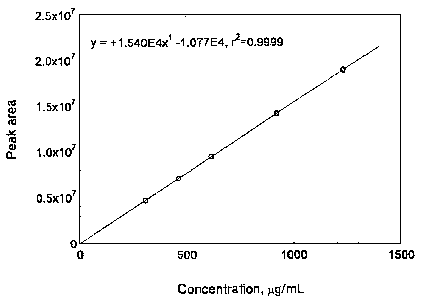
Figure 3.5.3.2. Calibration curve of zineb.
3.6 Interferences (analytical)
- 3.6.1 Nabam and mancozeb (a coordination complex of zinc ion
with manganese ethylenebis-dithiocarbamate) cause positive
interferences because they produce ethylenebisdithio-carbamate when
dissolved in the extraction solvent.
3.6.2 Any other compound that absorbs at 286 nm and has a similar retention time as ethylene-bisdithiocarbamate is a potential interference. If any potential interferences were reported, they should be considered before samples are extracted. Generally, chromatographic conditions can be altered to separate an interference from the analyte.
3.6.3 When necessary, the identity or purity of an analyte peak may be confirmed with additional analytical data (Section 4.1 1).
3.7 Calculations
The amount (in micrograms) of maneb or zineb per milliliter is obtained from the appropriate calibration curve. This amount is corrected by subtracting the amount (if any) found in the blank. The air concentration is calculated using the following formula.
| mg/m3 = | (micrograms per mL) × (extraction
volume, mL)
(liters of air sampled) × (extraction efficiency) |
Where: Extraction volume = 4 mL
Extraction efficiency = 1.004 for maneb, or 0.985 for zineb
3.8 Safety precautions (analytical)
- 3.8.1 Adhere to the rules set down in your Chemical Hygiene
Plan.
3.8.2 Avoid skin contact and inhalation of all chemicals.
3.8.3 Wear safety glasses and a lab coat at all times while in the lab area.
3.8.4 Sodium perchlorate is a strong oxidizer.
4. Backup Data
- 4.1 Determination of detection limits
Detection limits (DL), in general, are defined as the amount (or concentration) of analyte that gives a response (YDL) that is significantly different (three standard deviations (SDBR)) from the background response (YBR).
The direct measurement of YBR and SDBR in chromatographic methods is typically inconvenient and difficult because YBR is usually extremely low. Estimates of these parameters can be made with data obtained from the analysis of a series of analytical standards or samples whose responses are in the vicinity of the background response. The regression curve obtained for a plot of instrument response versus concentration of analyte will usually be linear. Assuming SDBR and the precision of data about the curve are similar, the standard error of estimate (SEE) for the regression curve can be substituted for SDBR in the above equation. The following calculations derive a formula for DL:

| Yobs | = | observed response |
| Yest | = | estimated response from regression curve |
| n | = | total no. of data points |
| k | = | 2 for a linear regression curve |
At point YDL on the regression curve
| YDL = A(DL) + YBR | A = analytical sensitivity (slope) |
therefore
| DL = | (YDL - YBR)
A |
Substituting 3(SEE) + YBR for YDL gives
| DL = | 3(SEE)
A |
4.2 Detection limit of the analytical procedure (DLAP)
The DLAP is measured as the mass of analyte actually introduced into the chromatographic column. Ten analytical standards whose concentrations were equally spaced from 0 to 0.45 µg/mL were prepared. The standard containing 0.45 µg/mL represented approximately 10 times the baseline noise for both analytes. These solutions were analyzed with the recommended analytical parameters (10 µL injection). The data obtained were used to determine the required parameters (A and SEE) for the calculation of the DLAP. These parameters and the calculated DLAP's are listed below.
| Table 4.2.1 Summary of the Calculated A, SEE, and DLAP | ||
| maneb | zineb | |
|
| ||
| A (ng-1) | 292800 | 244900 |
| SEE | 82145.4 | 69878 |
| DLAP (ng) | 0.84 | 0.86 |
|
| ||
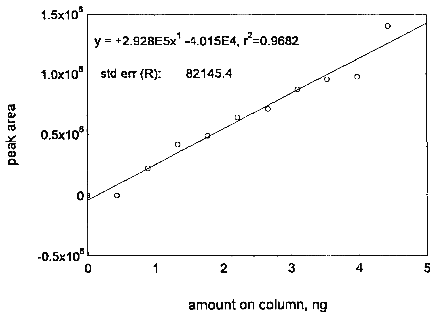
Figure 4.2.1. Plot of the data for determining the DLAP of maneb.
| Table 4.2.2 Detection Limit of the Analytical Procedure for maneb | ||
| concentration | mass on column | peak |
| (µg/mL) | (ng) | area |
|
| ||
| 0.000 | 0.00 | 0 |
| 0.044 | 0.44 | 0 |
| 0.089 | 0.89 | 223710 |
| 0.133 | 1.33 | 418238 |
| 0.177 | 1.77 | 487615 |
| 0.221 | 2.21 | 639389 |
| 0.266 | 2.66 | 710103 |
| 0.310 | 3.10 | 871326 |
| 0.354 | 3.54 | 958243 |
| 0.398 | 3.98 | 977354 |
| 0.443 | 4.43 | 1402564 |
|
| ||
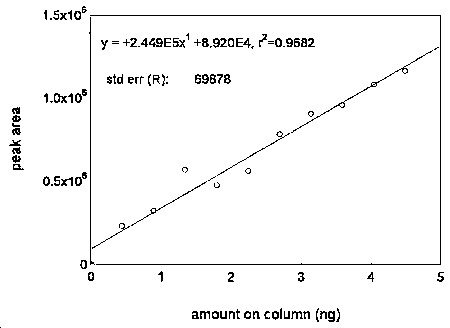
Figure 4.2.2. Plot of the data used for determining the DLAP of zineb.
| Table 4.2.3 Detection Limit of the Analytical Procedure for zineb | ||
| concentration | mass on column | peak |
| (µg/mL) | (ng) | area |
|
| ||
| 0.000 | 0.00 | 0 |
| 0.045 | 0.45 | 229343 |
| 0.090 | 0.90 | 320101 |
| 0.135 | 1.35 | 567710 |
| 0.180 | 1.80 | 476021 |
| 0.225 | 2.25 | 560070 |
| 0.270 | 2.70 | 782160 |
| 0.315 | 3.15 | 904095 |
| 0.360 | 3.60 | 956743 |
| 0.405 | 4.05 | 1081438 |
| 0.450 | 4.53 | 1165261 |
|
| ||
4.3 Detection limit of the overall procedure (DLOP)
The DLOP is measured as mass per sample and expressed as equivalent
air concentration, based on the recommended sampling parameters. Ten
samples of maneb/sucrose mixture, ranging in weight from 0.23 to 1.45
mg, were weighed in glass vials containing a
| Table 4.3.1 Summary of the Calculated A, SEE, and DLOP | ||
| maneb | zineb | |
|
| ||
| A (mg-1) | 6188000 | 7635000 |
| SEE | 679058 | 355819 |
| DLOP (mg, sucrose mixture) | 0.33 | 0.14 |
| DLOP (µg) | 33 | 15 |
|
| ||
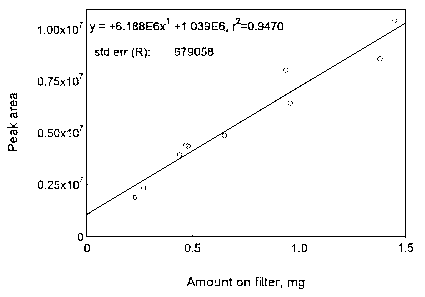
Figure 4.3.1. Plot of data used to determine the DLOP and RQL of maneb/sucrose mixture.
| Table 4.3.2 Detection Limit of the Overall Procedure for maneb/sucrose mixture | |
| mass per sample | peak |
| (mg) | area |
|
| |
| 0.23 | 1909944 |
| 0.27 | 2352685 |
| 0.44 | 3947111 |
| 0.47 | 4418639 |
| 0.48 | 4357205 |
| 0.65 | 4872006 |
| 0.94 | 8026909 |
| 0.96 | 6433869 |
| 1.38 | 8594458 |
| 1.45 | 10464932 |
|
| |
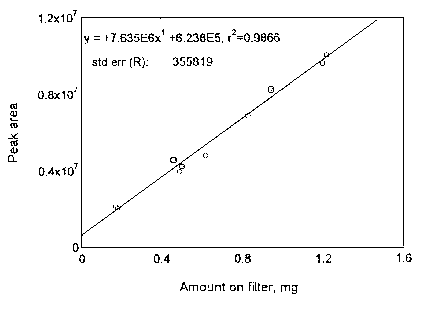
Figure 4.3.2. Plot of data used to determine the DLOP and RQL of zineb/sucrose mixture.
| Table 4.3.3 Detection Limit of the Overall Procedure for zineb/sucrose mixture | |
| mass per sample | peak |
| (mg) | area |
|
| |
| 0.17 | 2120284 |
| 0.18 | 2057153 |
| 0.46 | 4588090 |
| 0.49 | 3962535 |
| 0.50 | 4285499 |
| 0.62 | 4826301 |
| 0.83 | 6896308 |
| 0.94 | 8300629 |
| 1.20 | 9614353 |
| 1.22 | 10055146 |
|
| |
4.4 Reliable quantitation limit
The RQL is considered the lower limit for precise quantitative measurements. It is determined from the regression line data obtained for the calculation of the DLOP (Section 4.3), providing at least 75%. of the analyte is recovered. The RQL is defined as the amount of analyte that gives a response (YRQL) such that
therefore
| RQL = | 10(SEE)
A |
The calculated RQL's for maneb and zineb, together with the recoveries at these levels, are listed below. The recoveries are above 75%.
| Table 4.4.1 Summary of the RQL's and the Recoveries | ||
| maneb | zineb | |
|
| ||
| RQL (mg, sucrose mixture) | 1.10 | 0.47 |
| RQL (mg/sample) | 0.110 | 0.051 |
| RQL (µg/m3) | 220 | 103 |
| Recovery (%) | 110.1 | 89.5 |
|
| ||
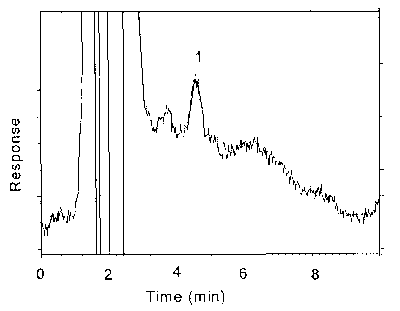
Figure 4.4.1. Chromatogram of the RQL for maneb.
Key: 1 = ethylenebisdithiocarbamate.
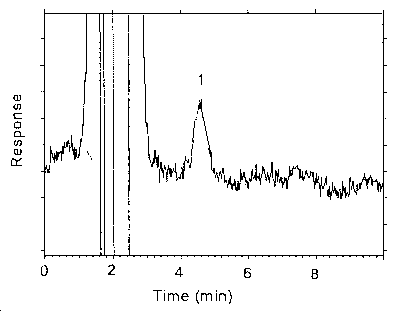
Figure 4.4.2. Chromatogram of the RQL for zineb.
Key: 1 = ethylenebisdithiocarbamate.
4.5 Precision (analytical method)
The precision of the analytical procedure is defined as the pooled relative standard deviation (RSDP). Relative standard deviations were determined from six replicate injections of analytical standards at 0.5, 0.75, 1, 1.5, and 2 times the target concentration. After assuring that the RSDS satisfy the Cochran test for homogeneity at the 95% confidence level, RSDP was calculated.
| Table 4.5.1 Instrument Response to Maneb | |||||
| × target concn | 0.5 × | 0.75 × | 1 × | 1.5 × | 2 × |
| µg/mL | 312 | 468 | 624 | 936 | 1248 |
|
| |||||
| peak area | 4371777 | 6643953 | 8844201 | 13407652 | 17642445 |
| 4324183 | 6578654 | 8825217 | 13334192 | 17818428 | |
| 4347347 | 6572769 | 8795840 | 13405380 | 17738352 | |
| 4395817 | 6676754 | 8850448 | 13380629 | 17884526 | |
| 4339860 | 6694122 | 8762309 | 13357394 | 18026538 | |
| 4368155 | 6622952 | 8695560 | 13279650 | 17753190 | |
| avg | 4357857 | 6631534 | 8795596 | 13360816 | 17810580 |
| std dev | 25726 | 49879 | 58930 | 48745 | 133377 |
| RSD % | 0.59 | 0.75 | 0.67 | 0.36 | 0.75 |
|
| |||||
| Table 4.5.2 Instrument Response to Zineb | |||||
| × target concn | 0.5 × | 0.75 × | 1 × | 1.5 × | 2 × |
| µg/mL | 308 | 462 | 616 | 924 | 1234 |
|
| |||||
| peak area | 4727680 | 7073563 | 9507486 | 14260604 | 19078820 |
| 4716993 | 7090721 | 9517335 | 14116518 | 18976644 | |
| 4714717 | 7133576 | 9486356 | 14279337 | 19006479 | |
| 4676611 | 7114085 | 9522567 | 14773887 | 18964245 | |
| 4714064 | 7094464 | 9529695 | 14212995 | 18900652 | |
| 4713370 | 7114914 | 9553841 | 14251726 | 19009588 | |
| avg | 4710573 | 7103554 | 9519547 | 14215845 | 18989405 |
| std dev | 17461 | 21392 | 22540 | 61574 | 58935 |
| RSD % | 0.37 | 0.30 | 0.24 | 0.43 | 0.31 |
|
| |||||
The Cochran test for homogeneity requires the calculation of the g statistics according to the following formula:

The g statistics obtained were: 0.2741 and 0.3269 for maneb and zineb, respectively. Since these g statistics do not exceed the critical value of 0.5065, the RSDs within each level can be considered equal and they can be pooled (RSDP) to give an estimated RSD for the concentration range studied.

The pooled relative standard deviations are 0.64% and 0.34% for maneb and zineb, respectively.
4.6 Precision (overall procedure)
The precision of the overall procedure is determined from the storage data in Section 4.7. The determination of the standard error of estimate (SEER) for a regression line plotted through the graphed storage data allows the inclusion of storage time as one of the factors affecting overall precision. The SEER is similar to the standard deviation, except it is a measure of dispersion of data about a regression line instead of about a mean. it is determined with the following equation:

| n | = | total no. of data points |
| k | = | 2 for linear regression |
| k | = | 3 for quadratic regression |
| Yobs | = | observed % recovery at a given time |
| Yest | = | estimated % recovery from the regression line at the same given time |
An additional 5% for pump error (SP) is added to the SEER by the addition of variances to obtain the total standard error of estimate.

The precision at the 95% confidence level is obtained by multiplying the standard error of estimate (with pump error included) by 1.96 (the z-statistic from the standard normal distribution at the 95% confidence level). The 95% confidence intervals are drawn about their respective regression lines in the storage graphs, as shown in Figures 4.7.1.1 to 4.7.2.2. The precision of the overall procedure are ±19.8% and ±19.4% for maneb and zineb, respectively.
4.7 Storage test
Storage samples were prepared by weighing the maneb/sucrose (at a level of around 27 mg, or maneb content of 2.5 mg) or zineb/sucrose mixture (at a level of around 24 mg or zineb content of 2.5 mg) in a vial. Thirty-six samples were prepared for each analyte. Six samples were analyzed on the day of preparation. The rest of the samples were,divided into two groups: 15 were stored at 5°C, and the other 15 were stored at ambient temperature (about 22°C) in a closed drawer. At 2-4 day intervals, three samples were selected from each of the two storage sets and analyzed.
| Table 4.7.1 Storage Test for Maneb | ||||||
| time | percent recovery | percent recovery | ||||
| (days) | (ambient) | (refrigerated) | ||||
|
| ||||||
| 0 | 103.0 | 102.3 | 96.2 | 103.0 | 102.3 | 96.2 |
| 0 | 98.8 | 99.6 | 100.1 | 98.8 | 99.6 | 100.1 |
| 4 | 118.3 | 103.0 | 114.1 | 100.6 | 99.3 | 103.2 |
| 6 | 102.6 | 102.7 | 101.5 | 91.3 | 89.8 | 93.0 |
| 8 | 87.2 | 99.6 | 70.8* | 81.2 | 94.1 | 106.6 |
| 12 | 82.3 | 77.9 | 95.5 | 70.8 | 96.9 | 57.7* |
| 15 | 91.1 | 103.1 | 101.4 | 89.9 | 91.6 | 85.9 |
|
| ||||||
| * Outliers, not used | ||||||
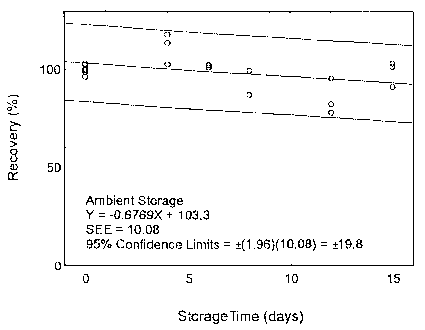
Figure 4.7.1.1. Ambient storage test for maneb.
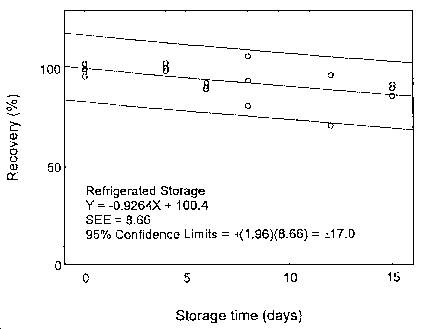
Figure 4.7.1.2. Refrigerated storage test for maneb.
| Table 4.7.2 Storage Test for Zineb | ||||||
| time | percent recovery | percent recovery | ||||
| (days) | (ambient) | (refrigerated) | ||||
|
| ||||||
| 0 | 102.1 | 102.2 | 103.5 | 102.1 | 102.2 | 103.5 |
| 0 | 102.7 | 103.7 | 85.9 | 102.7 | 103.7 | 85.9 |
| 4 | 102.1 | 100.8 | 98.0 | 103.2 | 100.7 | 89.4 |
| 6 | 90.0 | 92.5 | 83.1 | 90.7 | 91.5 | 87.3 |
| 8 | 129.9* | 117.4 | 92.9 | 77.4 | 104.4 | 79.9 |
| 12 | 90.5 | 104.4 | 109.4 | 76.0 | 101.6 | 98.4 |
| 15 | 88.9 | 99.1 | 93.2 | 94.6 | 96.8 | 94.6 |
|
| ||||||
| *outlier, not used | ||||||
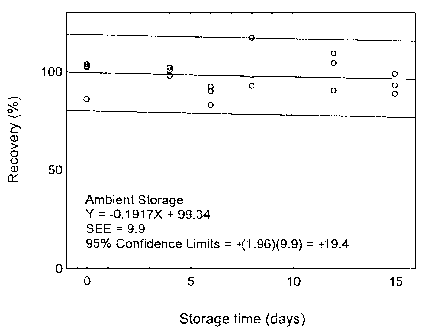
Figure 4.7.2.1. Ambient storage test for zineb.
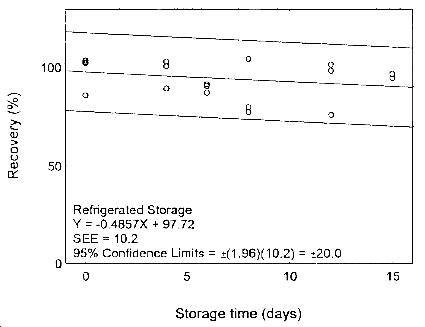
Figure 4.7.2.2. Refrigerated storage test for zineb.
4.8 Reproducibility
Reproducibility samples were prepared by weighing maneb or zineb/sucrose mixtures in a scintillation vials containing a GN-4 filter (membrane filter made from mixed esters of cellulose). The samples were submitted to an SLTC service branch for analysis. The samples were analyzed after being stored for 2 days at ambient temperature. No sample result had a deviation greater than the precision of the overall procedure determined in Section 4.7, which are ±19.8% and ±19.4% for maneb and zineb, respectively.
| Table 4.8.1 Reproducibility Data for Maneb | |||
| mg expected | mg found | percent found | percent deviation |
|
| |||
| 1.355 | 1.34 | 98.9 | -1.1 |
| 1.150 | 1.05 | 91.3 | -8.7 |
| 1.755 | 1.74 | 99.1 | -0.9 |
| 2.370 | 1.97 | 83.1 | -16.9 |
| 1.564 | 1.47 | 94.0 | -6.0 |
| 2.494 | 2.28 | 91.4 | -8.6 |
|
| |||
| Table 4.8.2 Reproducibility Data for Zineb | |||
| mg expected | mg found | percent found | percent deviation |
|
| |||
| 2.627 | 2.70 | 102.8 | +2.8 |
| 1.310 | 1.25 | 95.4 | -4.6 |
| 1.935 | 1.66 | 85.8 | -14.2 |
| 2.193 | 2.21 | 100.8 | +0.8 |
| 1.827 | 1.48 | 81.0 | -19.0 |
| 1.535 | 1.41 | 91.8 | -8.2 |
|
| |||
4.9 Sampler capacity
Sampling capacity was not tested. Maneb and zineb have very low vapor pressure and are not expected to vaporize or sublime significantly at ambient temperature. Generally one would not expect dust particles to break through a membrane filter. Retention efficiencies were tested by pulling 500 L of 80%-RH air through cassettes containing about 12 to 18 mg of maneb/sucrose or zineb/sucrose mixture (containing about 1.2 to 1.8 mg of maneb or zineb). The recoveries were 97.0% and 102.8% for maneb and zineb, respectively.
| Table 4.9.1 Retention Efficiency of Maneb | |||||
| Treated with 500 L of humid air | Control group | ||||
| mg spiked* | peak area | area/mg | mg spiked* | peak area | area/mg |
|
| |||||
| 13.27 | 4714261 | 355257 | 13.43 | 4865505 | 362286 |
| 17.87 | 6473108 | 362233 | 16.26 | 5520337 | 339504 |
| 12.82 | 4077903 | 318089 | 13.94 | 5024973 | 360472 |
| 15.68 | 5545443 | 353663 | 13.45 | 4654504 | 346060 |
| 13.56 | 4833093 | 356423 | 17.52 | Lost | --- |
| 16.37 | 5162170 | 315343 | 14.90 | 5409830 | 363076 |
| average = | 343501 | average = | 354280 | ||
| Retention efficiency = 343501/354280= 97.0% | |||||
|
| |||||
| *Amount of maneb/sucrose mixture. Maneb content = 10.1%, by weight. | |||||
| Table 4.9.2 Retention Efficiency of Zineb | |||||
| Treated with 500 L of humid air | Control group | ||||
| mg spiked* | peak area | area/mg | mg spiked* | peak area | area/mg |
|
| |||||
| 16.32 | 5137892 | 314822 | 17.04 | 5905005 | 346538 |
| 17.08 | 6340746 | 371238 | 17.96 | 6559759 | 365243 |
| 17.83 | 6824216 | 382738 | 16.76 | 6171506 | 368228 |
| 17.23 | 6558921 | 380669 | 16.73 | 6021564 | 359926 |
| 17.67 | 7121568 | 403032 | 16.69 | 5983878 | 358531 |
| 18.01 | 7100030 | 394782 | 16.24 | 6304134 | 388186 |
| average = | 374547 | average = | 364442 | ||
| Retention efficiency = 374547/364442 = 102.8% | |||||
|
| |||||
| * Amount of zineb/sucrose mixture. Zineb content = 11.0%. | |||||
4.10 Extraction efficiency and stability of extracted samples
- 4.10.1 Extraction efficiency
Samples for the extraction efficiencies (EE) of maneb and zineb were prepared by weighing, at 0.05 to 2 times the target concentrations, the maneb or zineb-sucrose mixture in a scintillation vial containing a GN-4 filter. These samples were stored overnight at ambient temperature and then extracted and analyzed. The average extraction efficiencies over the working range of 0.5 to 2 times the target concentration were 100.4% and 98.5% for maneb and zineb, respectively.
| Table 4.10.1.1 Extraction Efficiency for Maneb(%) | |||||||||||
| 0.05×TC | 0.1×TC | 0.2×TC | 0.5×TC | 1×TC | 2×TC | ||||||
| mg* | EE | mg* | EE | mg* | EE | mg* | EE | mg* | EE | mg* | EE |
|
| |||||||||||
| 1.45 | 89.7 | 2.56 | 90.2 | 5.26 | 112.0 | 13.11 | 109.2 | 25.61 | 104.1 | 51.67 | 100.4 |
| 1.30 | 122.0 | 2.29 | 100.9 | 5.23 | 79.9 | 12.77 | 102.0 | 24.48 | 105.5 | 50.43 | 102.8 |
| 1.29 | 83.6 | 2.27 | 104.1 | 5.13 | 65.2 | 12.71 | 96.3 | 25.46 | 110.1 | 50.21 | 97.6 |
| 1.21 | 92.4 | 2.19 | 87.3 | 4.72 | 95.8 | 12.13 | 95.4 | 24.96 | 98.4 | 49.99 | 97.9 |
| 1.13 | 96.7 | 2.14 | 115.1 | 4.55 | 94.4 | 11.75 | 97.2 | 23.73 | 104.9 | 48.26 | 95.5 |
| 1.07 | 97.2 | 2.05 | 106.0 | 4.29 | 106.8 | 11.62 | 97.7 | 23.61 | 94.4 | 47.69 | 99.0 |
| 96.9 | 100.6 | 92.3 | 99.6 | 102.9 | 98.9 | ||||||
|
| |||||||||||
| * Amount of maneb/sucrose mixture. Maneb content = 10.1 %. | |||||||||||
| Table 4.10.1.2 Extraction Efficiency (%) for Zineb | |||||||||||
| 0.05×TC | 0.1×TC | 0.2×TC | 0.5×TC | 1×TC | 2×TC | ||||||
| mg* | EE | mg* | EE | mg* | EE | mg* | EE | mg* | EE | mg* | EE |
|
| |||||||||||
| 1.30 | 88.2 | 2.73 | 82.3 | 5.47 | 97.1 | 13.03 | 100.3 | 25.60 | 98.9 | 51.16 | 100.3 |
| 1.29 | 87.7 | 2.69 | 104.3 | 5.11 | 99.0 | 12.79 | 101.8 | 25.35 | 96.0 | 50.35 | 94.9 |
| 1.29 | 106.8 | 2.64 | 108.2 | 5.01 | 110.6 | 12.67 | 101.6 | 25.17 | 99.2 | 50.12 | 99.3 |
| 1.21 | 98.1 | 2.33 | 95.8 | 4.82 | 102.4 | 12.47 | 96.1 | 24.43 | 92.9 | 49.79 | 99.8 |
| 1.18 | 101.0 | 2.25 | 117.4 | 4.57 | 88.6 | 12.46 | 99.5 | 24.31 | 93.8 | 49.51 | 101.9 |
| 1.05 | 97.0 | 2.22 | 108.5 | 4.52 | 106.0 | 12.43 | 98.3 | 24.24 | 97.9 | 49.08 | 100.3 |
| 96.5 | 102.7 | 100.6 | 99.6 | 96.4 | 99.4 | ||||||
|
| |||||||||||
| *Amount of zineb/sucrose mixture. Zineb content = 11.0%. | |||||||||||
4.10.2 Stability of extracted samples
The stability of the extracted samples was investigated by reanalyzing the target concentration samples 24 h after initial analysis. After the original analysis was performed, three vials were recapped with new septa while the remaining three retained their punctured septa. The samples were reanalyzed with fresh standards.
| Table 4.10.2.1 Stability of extracted samples for maneb | |||||
| punctured septa replaced | punctured septa retained | ||||
|
| |||||
| initial | EE after | initial | EE after | ||
| EE | one day | difference | EE | one day | difference |
| (%) | (%) | (%) | (%) | ||
|
| |||||
| 104.1 | 103.0 | -1.1 | 98.4 | 98.5 | +0.1 |
| 105.5 | 104.0 | -1.5 | 104.9 | 103.8 | -1.1 |
| 110.1 | 111.6 | +1.5 | 94.4 | 97.8 | +3.4 |
| averages | averages | ||||
| 106.6 | 106.2 | -0.4 | 99.2 | 100.0 | +0.8 |
|
| |||||
| Table 4.10.2.2 Stability of extracted samples for zineb | |||||
| punctured septa replaced | punctured septa retained | ||||
| initial | EE after | initial | EE after | ||
| EE | one day | difference | EE | one day | difference |
| (%) | (%) | (%) | (%) | ||
|
| |||||
| 98.9 | 97.7 | -1.2 | 92.9 | 92.5 | -0.4 |
| 96.0 | 94.8 | -1.2 | 93.8 | 94.2 | +0.4 |
| 99.2 | 99.4 | +0.2 | 97.9 | 96.5 | -1.4 |
| averages | averages | ||||
| 98.0 | 97.3 | -0.7 | 94.9 | 94.4 | -0.5 |
|
| |||||
4.11 Qualitative analysis
As an alternative analytical procedure, samples of maneb or zineb
can be analyzed by atomic absorption spectrometry (AA), if the samples
are well digested in acid. The chelated metals do not give
Afsar and Demirata (Ref. 5.12) reported a method of differentiating
maneb, zineb, and mancozeb on the basis of colors produced after
treatment of saturated solutions of the fungicides in
One can also analyze by gas chromatography the released carbon
disulfide after the
4.12 Stability of the EBDTC in the extraction solvent
Three sets of stock solutions were prepared in the extraction solvents of various freshness: 1-, 27-, and 49-day old. Their instrument responses were followed periodically for 5 days after the preparation. The results are plotted in the following graphs. The instrument responses remained essentially constant during this period.
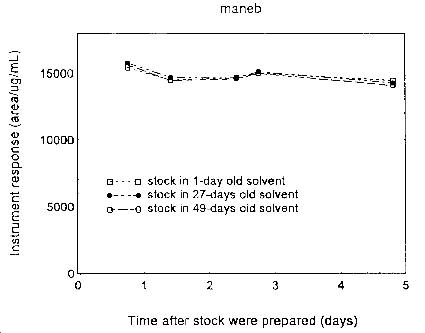
Figure 4.12.1. Stability of maneb stock solutions
prepared in the extraction solvents of various age.
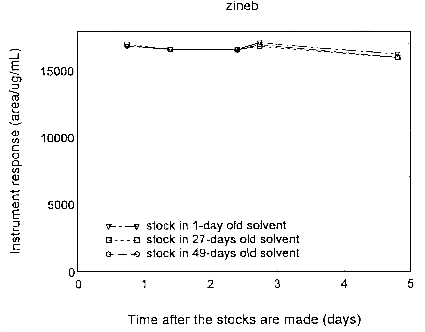
Figure 4.12.2. Stability of zineb stock solutions
prepared in the extraction solvents of various age.
5. References
- 5.1. Thiocarbarnate Pesticides: A General Introduction,
Environmental Health Criteria 76, World Health Organization,
Geneva, 1988.
5.2. IARC Monographs on the Evaluation of Carcinogenic Risk of Chemicals to Man. Geneva: World Health Organization, International Agency for Research on Cancer, 1972-1985.
5.3. Newsome, W.H., "Ethylenebisdithiocarbamates and Their Degradation Products", in Analytical Methods for Pesticide; and Plant Growth Regulators, Vol. XI, Academic Press, NY, 1980.
5.4. Merck Index, Windholz, M., Ed., 10th ed., Merck & Co., Rahway, NJ, 1983.
5.5. Merck Index, Budavari, S., Ed., 11th ed., Merck & Co., Rahway, NJ, 1989.
5.6. Bardarov, V. and C. Zaikov, J. Chromatogr., 1989, 479, 97-105.
5.7. Miles, C.J. and M. Zhou, J. Assoc. Off. Anal. Chem., 1991, 74(2), 384-8.
5.8. Kunugi, Y., Shiryo Kenkyu Hokoku (Tokyo Hishiryo Kensasho), 1994, 19, 56-57.
5.9. Jongen, M.J.M., J.S. Ravensberg, R. Engel, and L.H. Leenheers, J. Chromatogr. Sci., 1991, 29(7), 292-7.
5.10. Marple, V.A., B.Y.H. Liu, and K.L. Rubow, Am. Ind. Hyg. Assoc. J., 1978, 39, 26-32.
5.11. Gosselin, R.E., R.P. Smith, H.C. Hodge. Clinical Toxicology of Commercial Products., 5th ed. Baltimore: Williams and Wilkins, 1984.
5.12. Afsar, H. And B Demirata, J. Assoc. Off. Arial. Chem., 1987, 70(5), 923-4.