![]()
| Method number: | 109 | |
| Matrix: | Air | |
| Target concentration: | 400 ppm (983 mg/m3) | |
| OSHA PEL: | 400 ppm (983 mg/m3) TWA | |
| ACGIH TLV: | 400 ppm (983 mg/m3) TWA | |
| 500 ppm (1230 mg/m3) ceiling | ||
| Procedure: | Samples are collected by drawing a known volume of
air through two 8-mm o.d. (6-mm i.d.) Anasorb® 747 tubes in series.
The front tube contains 400 mg of adsorbent, and the back tube 200
mg. Samples are desorbed with a 60/40
| |
| Recommended air volume and sampling rate: |
18 L at 0.05 to 0.2 L/min | |
| Reliable quantitation limit: | 44.4 ppb (108.9 µg/m3) | |
| Standard error of estimate at the target concentration: |
5.15% | |
| Special requirement: | The air sampler must be separated into its component sampling tubes as soon as possible after sampling. This will prevent post-sampling migration. | |
| Status of method: | Evaluated method. This method has been subjected to the established evaluation procedures of the Organic Methods Evaluation Branch. | |
| Date: June 1997 | Chemist: Mary Eide |
OSHA Salt Lake Technical Center
Salt Lake City, UT 84115-1802
1. General Discussion
- 1.1 Background
- 1.1.1 History
The previous method used by OSHA for the collection and analysis
of isopropyl alcohol was based on NIOSH Method 1400 (Ref. 5.1). It
required collection of isopropyl alcohol on coconut shell charcoal
tubes, sample refrigeration for shipment and storage, and analysis
to be performed as soon as possible. The samples were desorbed with
99/1 carbon disulfide/2-butanol, and analyzed by GC/FID. Because
2-butanol is often present in many formulations with isopropyl
alcohol, SLTC developed a different desorbing solution consisting of
99/1 carbon
The sampling procedures of OSHA Methods 91 and 100 for methyl and ethyl alcohols respectively require collection on two Anasorb® 747 tubes in series (Refs. 5.3 and 5.4). The front tube contains 400 mg of adsorbent and the back tube contains 200 mg. The recommended sampling rate for both procedures is 0.05 L/min, with recommended air volumes of 3 L for methyl alcohol and 12 L for ethyl alcohol. Because isopropyl alcohol is often found in formulations with either methyl alcohol or ethyl alcohol or both alcohols, this collection procedure was explored for isopropyl alcohol. Capacity studies indicated that isopropyl alcohol can be collected at the 0.05 L/min sampling rate or at a higher sampling rate of 0.2 L/min for a recommended sample volume of 18 L. Because methyl alcohol and ethyl alcohol were previously evaluated at 0.05 L/min, additional capacity tests with these analytes were performed at 0.2 L/min. These tests indicate maximum air volumes of 2 L for methyl alcohol and 11 L for ethyl alcohol, which are lower than those previously obtained at 0.05 L/min and these lower maximum air volumes should be used if the higher flow rate of 0.2 L/min is used. (Section 4.12)
In OSHA Methods 91 and 100, Anasorb® 747 tubes are desorbed with
60/40
As in Methods 91 and 100, due to migration problems, it is necessary to sample for isopropyl alcohol using the two tube sampling train of a 400-mg tube followed by a 200-mg tube. These tubes need to be separated, capped, and sealed immediately after sampling to avoid migration of the analyte from the front (400 mg) tube to the back (200 mg) tube. A migration study at ambient and refrigerated temperatures, and low (11% RH) and high (80% RH) humidity, using a 400/200 mg tube was performed at the 405-ppm level, for 23 days. The highest amount of migration, 8.7%, occurred with the tubes collected at low humidity and were stored at ambient temperature. (Section 4.7.2)
1.1.2. Toxic effects (This section is for information only and should not be taken as the basis of OSHA policy.) (Ref. 5.5)
The OSHA PEL for isopropyl alcohol is 400 ppm based on an 8-h TWA. Workers exposed to 400 ppm reported mild irritation of the eyes, nose, and throat, with an increase in the intensity of these symptoms when the exposure level increased to 800 ppm. Isopropyl alcohol is readily absorbed through mucous membranes and through ingestion, but less through skin absorption. In rabbits, an eye exposure of 0.1 mL of 70% isopropyl alcohol in water (the formulation of rubbing alcohol) caused conjunctivitis, iritis, and cornea1 opacity. In animal studies, isopropyl alcohol was found to be 2-3 times more potent than ethyl alcohol as a CNS depressant, and its metabolite, acetone, was also a CNS depressant. Isopropyl alcohol is metabolized by the liver to acetone, which can be smelled on the breath, and found in the urine. An exposure of 12,000 ppm isopropyl alcohol for 8 hours killed half of the rats tested. The oral lethal dose of isopropyl alcohol in humans is 240 mL, with poisoning occurring at 20 mL. Most fatalities from isopropyl alcohol are due to alcoholics drinking rubbing alcohol, mistaking it for ethyl alcohol. Isopropyl alcohol has moderate narcotic properties, similar to ethyl alcohol. Symptoms of isopropyl alcohol ingestion manifest themselves within 30 minutes of ingestion, and include pain in the GI tract, vomiting, diarrhea, headache, muscular incoordination, ataxia, confusion, and in high doses coma and death.
1.1.3. Workplace exposure
Isopropyl alcohol was ranked number 50 in the list of the top 50 chemicals produced in the United States for 1994, with 1.39 billion pounds produced. (Ref. 5.6). Isopropyl alcohol is used in the synthesis of acetone, glycerin, glycerol, and isopropyl acetate, and as a solvent for gums, shellac, essential oils, creosote, and resins. It is used in anti-freeze formulations, quick-drying inks and oils, as a denaturant for ethyl alcohol, cosmetics, after shaves, hand lotions, and hair care products. A 70% solution in water is known as rubbing alcohol, and is used as a body rub and disinfectant. (Refs. 5.5 and 5.7)
1.1.4. Physical properties and other descriptive information (Refs. 5.7 and 5.8)
| CAS number: | 67-63-0 |
| molecular weight: | 60.09 |
| boiling point, °: | 82.5 |
| melting point, °: | -88.5 |
| color: | clear |
| specific gravity: | 0.78505204 |
| molecular formula: | C3H8O |
| vapor pressure (@25°): | 6.02 kPa (33 mmHg) |
| vapor density: | 2.1 |
| odor: | like ethyl alcohol and acetone mixture |
| flash point: | 11.7° (CC) |
| autoignition temperature: | 455.6° (852°) |
| explosive limits: | upper: 12.7%; lower: 2.5% (v/v) |
| solubility: | soluble in water, alcohol, ether, chloroform, acetone, benzene, toluene, carbon disulfide, and many other organic solvents |
| synonyms: | dimethyl carbinol; isopropanol; Petrohol; 2-propanol |
| structural formula: |  |
The analyte air concentrations throughout this method are based on the recommended sampling and analytical parameters. Air concentrations listed in ppm and ppb are referenced to 25° and 101.3 kPa (760 mmHg).
- 1.2 Limit defining parameters
- 1.2.1 Detection limit of the analytical procedure
The detection limit of the analytical procedure is 7.05 pg. This is the amount of analyte that will give a response that is significantly different from the background response of a reagent blank. (Sections 4.1 and 4.2)
1.2.2 Detection limit of the overall procedure
The detection limit of the overall procedure is 0.587 µg per sample (13.3 ppb or 32.6 µg/m3). This is the amount of analyte spiked on the sampler that will give a response that is significantly different from the background response of a sampler blank. (Sections 4.1 and 4.3)
1.2.3 Reliable quantitation limit
The reliable quantitation limit is 1.96 µg per sample (44.4 ppb or 108.9 µg/m3). This is the amount of analyte spiked on a sampler that will give a signal that is considered the lower limit for precise quantitative measurements. (Section 4.4)
1.2.4 Precision (analytical procedure)
The precision of the analytical procedure, measured as the pooled relative standard deviation over a concentration range equivalent to the range of 0.5 to 2 times the target concentration is 0.61% for 18 L sample loadings. (Section 4.5)
1.2.5 Precision (overall procedure)
The precision of the overall procedure at the 95% confidence level for the ambient temperature 19-day storage test (at the target concentration) is ±10.1%. This includes an additional 5% for sampling error. (Section 4.6)
1.2.6 Recovery
The recovery of isopropyl alcohol from samples used in the 19-day storage test remained above 100.2%. (Section 4.7)
1.2.7 Reproducibility
Six samples collected from a test atmosphere with a draft copy of this procedure, were submitted for analysis to one of the OSHA Salt Lake Technical Center's service branch laboratories. The samples were analyzed after 3 days of storage at 4°. No individual sample result deviated from its theoretical value by more than the precision reported in Section 1.2.5. (Section 4.8)
2. Sampling Procedure
- 2.1 Apparatus
- 2.1.1 Samples are collected using a personal sampling pump
calibrated, with the sampling device attached, to within 25± at the
recommended flow rate.
2.1.2 Samples are collected using a 400-mg and a 200-mg Anasorb® 747 sampling tube. The sampling tubes (11-cm × 8-mm o.d. × 6-mm i.d.) are connected in series with silicone tubing prior to sampling. The adsorbent beds are held in place with a glass wool plug at the front, and a foam plug at the rear of the adsorbent bed. For this evaluation, commercially prepared sampling tube sets were purchased from SKC, Inc. (catalog no. 226-82).
2.2 Reagents
None required.
2.3 Technique
- 2.3.1 Break off both ends of the sampling tubes immediately
before sampling. The holes on the broken ends of the sampling tubes
should be approximately one-half the i.d. of the sampling tube. All
tubes should be from the same lot. Connect the outlet end of a
400-mg sampling tube to the inlet end of a 200-mg tube with a 1-in.
length of 1/4-in. i.d. silicone rubber tubing. The inlet end of a
sampling tube is the end with the glass wool plug. Insure that the
connection is secure and that the broken ends of the tubes just
touch each other. Be careful not to cut the silicone tubing with the
sharp ends of the sampling tubes.
2.3.2 Attach the sampling tube to the sampling pump with flexible, non-crimpable tubing. It is desirable to utilize sampling tube holders which have a protective cover to shield the employee from the sharp, jagged end of the sampling tube. Position the tube so that the sampled air first passes through the inlet of the larger 400-mg tube.
2.3.3 Sampled air should not pass through any hose or tubing before entering the sampling tube.
2.3.4 Attach the sampler vertically with the larger, 400-mg tube, pointing downward in the worker's breathing zone to avoid channeling. Position the sampler so it does not impede work performance or safety.
2.3.5 Remove the sampling tubes after sampling for the appropriate time. Separate the two sampling tubes and cap the tube ends with plastic end caps. Wrap each sample end-to-end with a Form OSHA-21 seal. The silicone tubing used to connect the tubes is susceptible to cuts from the sharp ends of the sampling tubes and should be discarded after one use.
2.3.6 Submit at least one blank sample with each set of samples. Handle the blank sampling tube in the same manner as the other samples, except draw no air through it.
2.3.7 Record sample air volumes (in liters) for each sample, along with any potential interferences.
2.3.8 Ship any bulk sample(s) in a container separate from the air samples.
2.3.9 Submit the samples to the laboratory for analysis as soon as possible after sampling. If delay is unavoidable, store the samples at reduced temperature in a refrigerator or freezer.
2.4 Sampler capacity
Sampler capacity is determined by measuring how much air can be sampled before the analyte breaks through the sampler, i.e., the sampler capacity is exceeded. Breakthrough is considered to occur when the effluent from the sampler contains a concentration of analyte that is 5% of the upstream concentration (5% breakthrough). Testing for breakthrough was performed by using an FID to monitor the effluent from 400 mg Anasorb® 747 tubes. Dynamically generated test atmospheres, which were about two times the target concentration, were used for the capacity tests. The samples were collected at 0.05 and 0.2 L/min and the relative humidity was about 80% at 22°. The 5% breakthrough air volume was calculated from the data of duplicate determinations at 0.05 and 0.2 L/min and differing humidities. The breakthrough determinations at high humidity are 22.6 L for 0.2 L/min at 84% RH and 29.0 L for 0.05 L/min at 77% RH. The breakthrough determinations at low humidity are 29.8 L for 0.2 L/min at 12% RH and 37.6 L for 0.05 L/min at 13% RH. (Section 4.9)
2.5 Desorption efficiency
- 2.5.1 The average desorption efficiency for isopropyl alcohol
from Anasorb® 747 over the range of 0.5 to 2.0 times the target
concentrations was 103.6%. (Section 4.10)
2.5.2 The average desorption efficiency for isopropyl alcohol from Anasorb® 747 for 0.05, 0.1 and 0.2 times the target concentration were 100.2%, 102.9%, and 103.6% respectively. (Section 4.10)
2.5.3 Desorbed samples remain stable for at least 64 h. (Section 4.10)
2.5.4 Desorption efficiencies should be confirmed periodically because differences may occur due to variations between sampling media lots, desorption solvent, and operator technique.
2.6 Recommended air volume and sampling rate
- 2.6.1 For long-term samples, collect 18 L at 0.05 to 0.2 L/min.
The 18-L maximum air volume is based on sampler capacity studies,
which indicate that at 0.2 L/min the maximum air volume is 18 L, and
that at the lower flow rate of 0.05 L/min the maximum air volume is
23.8 L.
2.6.2 For short-term samples, collect 3 L at 0.2 L/min.
2.6.3 When short-term samples are collected, the air concentration equivalent to the reliable quantitation limit becomes larger. For example, the reliable quantitation limit is 0.266 ppm (0.653 mg/m3) when 3 L is sampled.
2.6.4 When sampling for methyl alcohol and/or ethyl alcohol in conjunction with isopropyl alcohol, the sampling rate and air volumes recommended in Methods 91 and 100 should be used. Samples collected for methyl alcohol, in conjunction with ethyl alcohol and/or isopropyl alcohol should be sampled at 0.05 L/min for 3 L. Samples collected for ethyl alcohol, in conjunction with isopropyl alcohol should be sampled at 0.05 L/min for 12 L.
2.7 Interferences (sampling)
- 2.7.1 There are no known compounds that will severely interfere
with the collection of isopropyl alcohol on Anasorb® 747. In
general, the presence of other contaminant vapors in the air will
reduce the capacity of Anasorb® 747 to collect isopropyl alcohol.
2.7.2 Suspected interferences should be reported to the laboratory with submitted samples.
2.8 Safety precautions (sampling)
- 2.8.1 The sampling equipment should be attached to the worker in
such a manner that it will not interfere with work performance or
safety.
2.8.2 All safety practices that apply to the work area being sampled should be followed.
2.8.3 Protective eyewear should be worn when breaking the ends of the glass sampling tubes.
3. Analytical Procedure
- 3.1 Apparatus
- 3.1.1 A gas chromatograph equipped with an FID. For this
evaluation, a Hewlett-Packard 5890A Series II Gas Chromatograph
equipped with a 7673A Automatic Sampler was used.
3.1.2 A GC column capable of separating isopropyl alcohol from the desorption solvent, internal standard and any potential interferences. A 60-m × 0.32-mm i.d. capillary DB-5 with a 1.0-µm df (J&W Scientific, Folsom, CA) was used in the evaluation.
3.1.3 An electronic integrator or some other suitable means of measuring peak areas. A Waters 860 Networking Computer System was used in this evaluation.
3.1.4 Glass vials with poly(tetrafluoroethylene)-lined caps. For this evaluation 4-mL vials were used to hold the samples for desorption, and 2-mL vials were used in the autosampler for analysis.
3.1.5 A dispenser capable of delivering 3.0 mL of desorbing solvent to prepare standards and samples. If a dispenser is not available, a 3.0-mL volumetric pipet may be used.
3.1.6 Disposable pipets, Pasteur-type, for the transfer of samples and standards from the 4-mL vials to the 2-mL GC autosampler vials for analysis.
3.2 Reagents
- 3.2.1 Isopropyl alcohol, reagent grade or better. EM OMNISOLV
isopropyl alcohol (Lot 9051) was used in this evaluation.
3.2.2 Desorbing solution, 60/40 (v/v)
3.2.3 GC grade nitrogen, air, and hydrogen.
3.3 Standard preparation
- 3.3.1 Prepare working analytical standards by injecting
microliter amounts of isopropyl alcohol into 4-mL vials containing 3
mL of desorption solvent delivered from the same dispenser used to
desorb samples. An analytical standard equivalent to a 391-ppm air
sample, with the recommended air volume of 18 L, was prepared by
placing 22 µL of isopropyl alcohol into a sealed vial
containing 3.0 mL of desorbing solution. An analytical standard
equivalent to a 426-ppm air sample, at the recommended air volume of
3 L, was prepared by placing 4µL of isopropyl alcohol into a
sealed vial containing 3.0 mL of desorbing solution for a
concentration of 1.05 mg/mL.
3.3.2 Bracket sample concentrations with working standard concentrations. If sample concentrations are higher than the concentration range of prepared standards, prepare and analyze additional standards, at least as high a concentration as the highest sample, to ascertain the linearity of response, or dilute the sample with the desorbing solvent to obtain a concentration within the existing standard range.
3.4 Sample preparation
- 3.4.1 Remove the plastic end caps from the sample tubes and
carefully transfer the adsorbent to separate 4-mL vials. Discard the
glass tube, urethane foam plug and glass wool plug.
3.4.2 Add 3.0 mL of desorption solvent to each vial using the same dispenser as used for preparation of standards.
3.4.3 Immediately seal the vials with poly(tetrafluoroethylene)-lined caps.
3.4.4 Shake the vials vigorously several times during the next 1 hour.
3.5 Analysis
- 3.5.1 Transfer an aliquot of each of the standards and samples
into separate GC autosampler vials if necessary.
3.5.2 Analytical conditions
| GC conditions | |
| zone | |
| temperatures: | 60° (column), hold 4 min, ramp at 10°/min to
160°, hold 4 min 210° (injector) 225° (detector) |
| run time: | 18 min |
| column gas flow: | 2.9 mL/min (hydrogren) |
| septum purge: | 1.9 mL/min (hydrogen) |
| injection size: | 1.0 µL (19:1 split) |
| column: | 60-m x 0.32-mm i.d. capillary DB-5 (1.0 µm df) |
| retention times: | 4.4 min (isopropyl alcohol) 16.6 min (p-cymene) |
| FID conditions | |
| hydrogen flow: | 38 mL/min |
| air flow: | 450 mL/min |
| makeup flow: | 30 mL/min (nitrogen) |
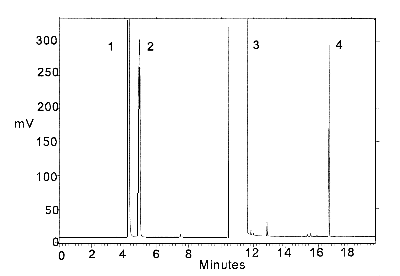
Figure 3.5.2. Chromatogram of a standard.
Peak identification:
(1) isopropyl alcohol, (2) carbon disulfide, (3) DMF,
3.5.3 An internal standard (ISTD) calibration method is used. A calibration curve can be constructed by plotting ISTD-corrected response of standard injections versus milligrams of analyte per sample. Bracket the samples with freshly prepared analytical standards over a range of concentrations.
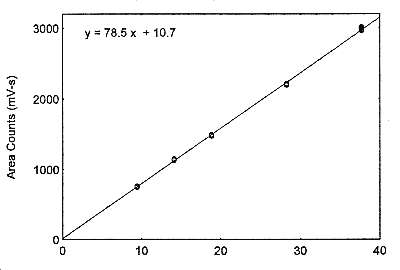
Figure 3.5.3. The calibration curve at the target concentration with a 18-L air volume, made from data of Table 4.5.2.
3.6 Interferences (analytical)
- 3.6.1 Any compound that produces an FID response and has a
similar retention time as the analyte or internal standard is a
potential interference. If any potential interferences were
reported, they should be considered before the samples are desorbed.
Generally, chromatographic conditions can be altered to separate an
interference from the analyte.
3.6.2 When necessary, the identity or purity of an analyte peak may be confirmed with additional analytical data, such as identification by GC/mass spectrometry (Section 4.11).
3.7 Calculations
The amount of isopropyl alcohol per sample is obtained from the appropriate calibration curve in terms of milligrams per sample, uncorrected for desorption efficiency. The back (200-mg) tube is analyzed primarily to determine if there was any breakthrough from the front (400-mg) tube during sampling. If a significant amount of analyte is found on the back tube (e.g., greater than 25% of the amount found on the front section), this fact should be reported with the sample results. If any analyte is found on the back tube, it is added to the amount on the front tube. This amount is then corrected by subtracting the total amount (if any) found on the blank. The air concentration is calculated using the following formulae.
| mg/m3 = | milligrams of analyte per sample
liters of air sampled × desorption efficiency × m3/1000 L |
| ppm = | 24.46 × mg/m3
molecular weight of analyte |
| where | 24.46 is the molar volume at 25° and 101.3 kPa
(760 mmHg) 60.09 = molecular weight of isopropyl alcohol |
3.8 Safety precautions (analytical)
- 3.8.1 Adhere to the rules set down in your Chemical Hygiene
Plan.
3.8.2 Avoid skin contact and inhalation of all chemicals.
3.8.3 Wear safety glasses, gloves and a lab coat while in the laboratory areas and working with chemicals.
4. Backup Data
- 4.1 Determination of detection limit
Detection limits, in general, are defined as the amount (or
concentration) of analyte that gives a response
(
The measurement of YBR and SDBR in chromatographic methods is typically inconvenient and difficult because YBR is usually extremely low. Estimates of these parameters can be made with data obtained from the analysis of a series of analytical standards or samples whose responses are in the vicinity of the background response. The regression curve obtained for a plot of instrument response versus concentration of analyte will usually be linear. Assuming SDBR and the precision of the data about curve are similar, the standard error of estimate (SEE) for the regression curve can be substituted for SDBR in the above equation. The following calculations derive a formula for DL:

| Yobs | = | observed response |
| Yest | = | estimated response from regression curve |
| n | = | total number of data points |
| k | = | 2 for linear regression curve |
At point YDL on the regression curve
| YDL = A(DL) + YBR | A = analytical sensitivity (slope) |
therefore
| DL = (YDL -
YBR)
A |
Substituting 3(SEE) + YBR for YDL gives
| DL = | 3(SEE)
A |
4.2 Detection limit of the analytical procedure (DLAP)
The DLAP is measured as the mass of analyte actually introduced into the chromatographic column. Ten analytical standards were prepared in equal descending increments with the highest standard containing 3.4 µg/mL of isopropyl alcohol. This is the concentration that would produce a peak approximately 10 times the background noise of a reagent blank near the elution time of the analyte. These standards, and the reagent blank, were analyzed with the recommended analytical parameters (1-µL injection with a 19:l split), and the data obtained were used to determine the required parameters (A and SEE) for the calculation of the DLAP. Values of 46.59 and 109.5 were obtained for A and SEE respectively. The DLAP was calculated to be 7.05 pg.
Detection Limit of the Analytical Procedure
|
| ||
| concentration | mass on column | area counts |
| (µg/mL) | (pg) | (µV-s) |
|
| ||
| 0.34 | 17.89 | 1232 |
| 0.68 | 35.79 | 1917 |
| 1.02 | 53.68 | 2796 |
| 1.36 | 71.58 | 3633 |
| 1.70 | 89.47 | 4335 |
| 2.04 | 107.4 | 5206 |
| 2.38 | 125.3 | 6283 |
| 2.72 | 143.2 | 7001 |
| 3.06 | 161.1 | 7946 |
| 3.40 | 178.9 | 8514 |
|
| ||
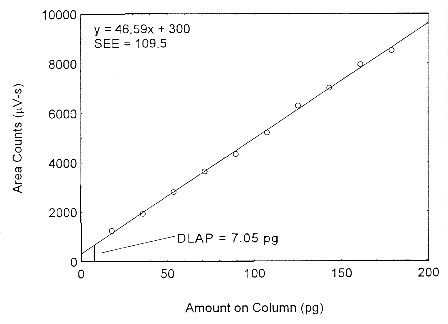
Figure 4.2. Plot of the data from Table 4.2 to determine the DLAP of isopropyl alcohol.
4.3 Detection limit of the overall procedure (DLOP)
The DLOP is measured as mass per sample and expressed as equivalent air concentration, based on the recommended sampling parameters. Ten samplers were spiked with equal descending increments of analyte, such that the highest sampler loading was 10.2 µg/sample. This is the amount spiked on a sampler that would produce a peak approximately 10 times the background response for a sample blank. These spiked samplers, and a sample blank, were analyzed with the recommended analytical parameters, and the data obtained used to calculate the required parameters (A and SEE) for the calculation of the DLOP. Values of 844.1 and 165.1 were obtained for A and SEE, respectively. The DLOP was calculated to be 0.587 µg/sample (13.3 ppb or 32.6 µg/m3).
Detection Limit of the Overall Procedure
|
| ||
| mass per | area counts | |
| sample | (µV-s) | |
| (µg) | ||
|
| ||
| 1.02 | 1228 | |
| 2.04 | 2083 | |
| 3.06 | 3036 | |
| 4.08 | 3783 | |
| 5.10 | 4809 | |
| 6.12 | 5505 | |
| 7.14 | 6268 | |
| 8.16 | 7635 | |
| 9.18 | 8199 | |
| 10.2 | 8795 | |
|
| ||
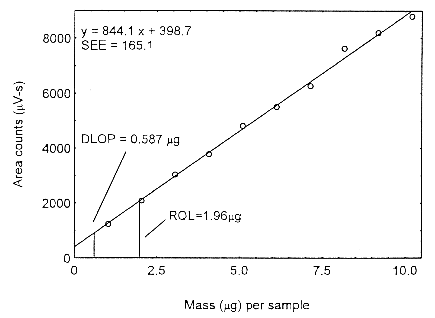
Figure 4.3. Plot of the data to determine the DLOP.
4.4 Reliable quantitation limit (RQL)
The RQL is considered the lower limit for precise quantitative
measurements. It is determined from the regression line parameters
obtained for the calculations of the DLOP (Section 4.3), providing at
least 75% of the analyte is recovered. The RQL is defined as the
amount of analyte that gives a response
therefore
| RQL = | 10(SEE)
A |
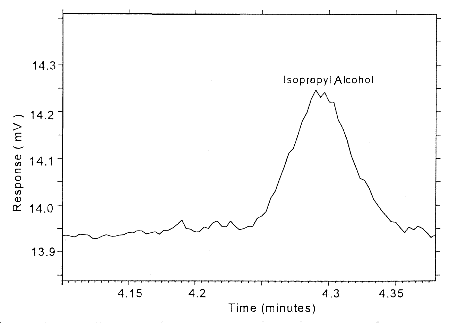
Figure 4.4. Chromatogram of the RQL for isopropyl alcohol.
The RQL for Isopropyl alcohol was calculated to be 1.96 µg/sample (44.4 ppb or 108.9 µg/m3). The recovery at this concentration is 98.9%.
4.5 Precision (analytical method)
The precision of the analytical procedure is measured as the pooled
relative standard deviation (RSDP). Relative
standard deviations are determined from six replicate injections of
isopropyl alcohol standards at 0.5, 0.75, 1, 1.5 and 2 times the
target concentrations. After assuring that the RSDs satisfy the
Cochran test for homogeneity at the 95% confidence level, the
Instrument Response to Isopropyl Alcohol at Target Concentration with
3-L Air Volume
|
| |||||
| × target concn | 0.5× | 0.75× | 1× | 1.5× | 2× |
| (mg/sample) | 0.50 | 0.74 | 0.99 | 1.48 | 1.98 |
|
| |||||
| area counts | 121.99 | 178.51 | 245.88 | 364.21 | 483.80 |
| (mV-s) | 121.26 | 181.68 | 245.15 | 364.87 | 487.07 |
| 120.41 | 177.93 | 248.78 | 365.39 | 480.73 | |
| 120.65 | 177.72 | 246.55 | 364.89 | 487.10 | |
| 121.23 | 178.73 | 246.43 | 363.01 | 485.35 | |
| 120.36 | 182.93 | 244.52 | 362.02 | 481.28 | |
| 120.98 | 179.58 | 246.22 | 364.06 | 484.22 | |
| SD | 0.63 | 2.17 | 1.47 | 1.30 | 2.78 |
| RSD (%) | 0.52 | 1.21 | 0.60 | 0.36 | 0.57 |
|
| |||||
Instrument Response to Isopropyl Alcohol at Target Concentration with
18-L Air Volume
|
| |||||
| × target concn | 0.5× | 0.75× | 1× | 1.5× | 2× |
| (mg/sample) | 3.14 | 4.71 | 6.28 | 9.42 | 12.56 |
|
| |||||
| area counts | 743.30 | 1149.75 | 1488.82 | 2208.53 | 2962.57 |
| (mV-s) | 754.60 | 1126.90 | 1484.71 | 2212.38 | 2981.80 |
| 752.61 | 1132.79 | 1478.24 | 2195.77 | 2975.65 | |
| 759.51 | 1134.72 | 1473.01 | 2196.31 | 2982.96 | |
| 747.94 | 1133.04 | 1490.48 | 2203.07 | 3001.76 | |
| 752.42 | 1135.35 | 1470.78 | 2191.86 | 3014.54 | |
| 751.73 | 1135.43 | 1481.0l | 2201.32 | 2986.55 | |
| SD | 5.57 | 7.63 | 8.25 | 8.04 | 18.68 |
| RSD (%) | 0.74 | 0.67 | 0.56 | 0.37 | 0.63 |
|
| |||||
The Cochran test for homogeneity:

The critical value of the g-statistic, at the 95% confidence
level, for five variances, each associated with six observations is
0.5065. The g-statistics are 0.3915 and 0.3773 for the low and
high target concentrations respectively. Because the
g-statistic does not exceed this value, the RSDs can be
considered equal and they can be pooled

The
4.6 Precision (overall procedure)
The precision of the overall procedure is determined from the
storage data in Section 4.7. The determination of the standard error
of estimate

| Yobs | = | observed % recovery at a given time |
| Yest | = | estimated % recovery from the regression line at the same given time |
| n | = | total number of data points |
| k | = | 2 for linear regression |
| k | = | 3 for quadratic regression |
An additional 5% for pump error (SP) is added to the

The precision at the 95% confidence level is obtained by multiplying the standard error of estimate (with pump error included) by 1.96 (the z-statistic from the standard normal distribution at the 95% confidence level). The 95% confidence intervals are drawn about their respective regression lines in the storage graphs, as shown in Figures 4.7.1.1 through 4.7.1.2. The precisions of the overall procedure are 10.1% and 10.4% for the ambient and refrigerated samples, respectively.
4.7 Storage test
- 4.7.1 Storage test at target concentration with 400-mg tube and
18 L
Storage samples for isopropyl alcohol were prepared by drawing samples from a controlled test atmosphere of 405 ppm at 0.2 L/min for 90 minutes, to obtain an 18 L air volume. The relative humidity was approximately 80% at 22°. Thirty-six storage samples were prepared. Six samples were analyzed immediately after generation, fifteen tubes were stored at reduced temperature (4°) and the other fifteen were stored in the dark at ambient temperature (about 22°). At 3-5 day intervals, three samples were selected from each of the two sets and analyzed.
Storage Test with 400-mg Tubes
|
| ||||||
| time | ambient storage | refrigerated storage | ||||
| (days) | recovery (%) | recovery (%) | ||||
|
| ||||||
| 0 | 103.6 | 104.6 | 105.0 | 103.6 | 104.6 | 105.0 |
| 0 | 103.1 | 104.3 | 103.2 | 103.1 | 104.3 | 103.2 |
| 3 | 105.8 | 105.7 | 104.9 | 104.0 | 104.3 | 103.8 |
| 7 | 103.0 | 102.3 | 102.8 | 107.8 | 108.5 | 106.6 |
| 10 | 104.9 | 105.2 | 104.6 | 103.9 | 104.2 | 102.0 |
| 14 | 102.4 | 102.4 | 102.3 | 102.5 | 102.7 | 103.5 |
| 19 | 102.1 | 100.3 | 100.2 | 100.9 | 100.3 | 101.8 |
|
| ||||||
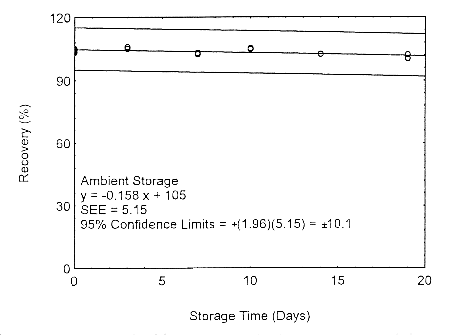
Figure 4.7.1.1. Ambient storage test using 400-mg
tubes at the target concentration.
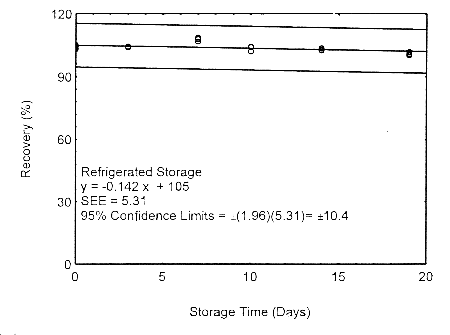
Figure 4.7.1.2. Refrigerated storage test using 400-mg
tubes at the target concentration.
4.7.2 Storage and migration test with 400/200 mg Anasorb® 747 tubes
Migration samples for isopropyl alcohol were prepared by drawing samples from a controlled test atmosphere of 405 ppm at 0.2 L/min for 90 minutes onto 400/200 mg Anasorb® 747 tubes (Lot 263). Samples were generated at both a relative humidity of approximately 80% at 22° and 11% at 22°. Forty-eight storage samples were prepared at each relative humidity. For each relative humidity, 11% or 80%, six samples were analyzed immediately after generation, eighteen tubes were stored at reduced temperature (4°) and the other fifteen were stored in the dark at ambient temperature (about 22°). At 3-5 day intervals, three samples were selected from each of the four sets and analyzed.
| Table 4.7.2 | ||||||||
| Storage and Migration Test on 400/200 mg Anasorb® 747 Tubes | ||||||||
|
| ||||||||
| 11% RH | 80% RH | |||||||
| time | ambient storage | refrigerated storage | ambient storage | refrigerated storage | ||||
| (days) | recovery (%) | recovery (%) | recovery (%) | recovery (%) | ||||
| front | back | front | back | front | back | front | back | |
| section | section | section | section | section | section | section | section | |
|
| ||||||||
| 0 | 104.5 | 0.0 | 104.5 | 0.0 | 104.5 | 0.0 | 104.5 | 0.0 |
| 0 | 103.6 | 0.0 | 103.6 | 0.0 | 103.6 | 0.0 | 103.6 | 0.0 |
| 0 | 103.8 | 0.0 | 103.8 | 0.0 | 103.8 | 0.0 | 103.8 | 0.0 |
| 0 | 104.6 | 0.0 | 104.6 | 0.0 | 104.6 | 0.0 | 104.6 | 0.0 |
| 0 | 105.6 | 0.0 | 105.6 | 0.0 | 105.6 | 0.0 | 105.6 | 0.0 |
| 0 | 104.1 | 0.0 | 104.1 | 0.0 | 104.1 | 0.0 | 104.1 | 0.0 |
| 5 | 102.1 | 1.1 | 103.0 | 0.0 | 102.9 | 0.0 | 103.5 | 0.0 |
| 5 | 103.1 | 0.0 | 102.8 | 0.0 | 102.6 | 0.0 | 102.8 | 0.0 |
| 5 | 102.1 | 1.2 | 103.6 | 0.0 | 100.3 | 0.0 | 103.9 | 0.0 |
| 8 | 98.1 | 2.4 | 105.0 | 0.0 | 103.7 | 0.0 | 103.4 | 0.0 |
| 8 | 100.0 | 3.7 | 103.6 | 0.0 | 104.0 | 0.0 | 102.1 | 0.0 |
| 8 | 101.4 | 1.0 | 102.3 | 0.0 | 104.0 | 0.0 | 102.5 | 0.0 |
| 12 | 101.5 | 2.5 | 103.9 | 0.5 | 103.9 | 0.1 | 105.3 | 0.0 |
| 12 | 100.6 | 4.6 | 103.3 | 1.0 | 102.2 | 0.0 | 103.8 | 0.0 |
| 12 | 98.6 | 3.7 | 104.2 | 1.2 | 104.2 | 0.0 | 103.3 | 0.0 |
| 15 | 100.4 | 4.5 | 103.7 | 0.2 | 103.4 | 0.0 | 103.1 | 0.0 |
| 15 | 101.2 | 3.1 | 104.8 | 0.8 | 104.1 | 0.0 | 102.8 | 0.0 |
| 15 | 101.3 | 3.1 | 102.3 | 0.0 | 102.2 | 0.0 | 103.1 | 0.0 |
| 20 | 98.7 | 7.4 | 104.5 | 2.2 | 103.6 | 0.0 | 103.9 | 0.0 |
| 20 | 96.0 | 9.0 | 104.3 | 0.1 | 101.9 | 0.3 | 100.8 | 0.0 |
| 20 | 95.6 | 9.3 | 102.8 | 3.0 | 103.6 | 0.0 | 101.6 | 0.0 |
| 23 | 94.7 | 8.1 | 104.2 | 2.2 | 103.8 | 0.3 | 102.2 | 0.0 |
| 23 | 95.9 | 10.0 | 101.4 | 4.3 | 101.5 | 0.2 | 103.6 | 0.0 |
| 23 | 94.4 | 8.1 | 105.3 | 0.4 | 101.8 | 0.1 | 103.4 | 0.0 |
|
| ||||||||
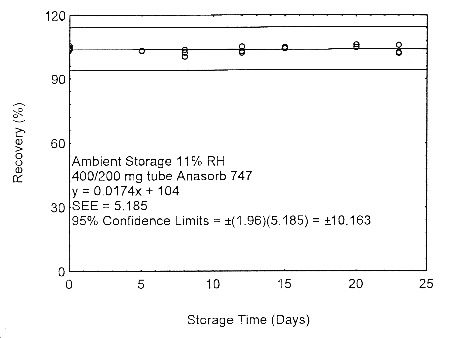
Figure 4.7.2.1. Ambient storage test of 400/200 mg Anasorb® 747 tube generated with 11% RH air.
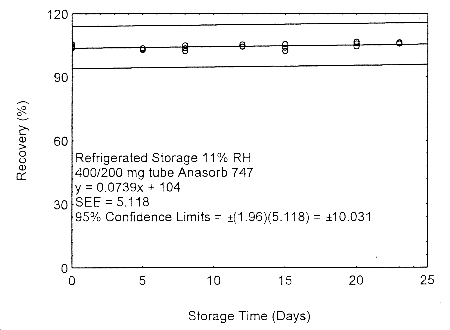
Figure 4.7.2.2. Refrigerated storage test of 400/200 mg Anasorb® 747 tube generated with 11% RH air.
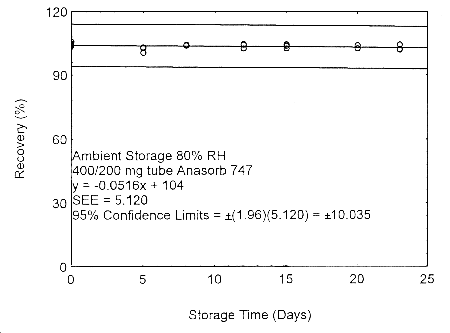
Figure 4.7.2.3. Ambient storage test of 400/200 mg Anasorb® 747 tube generated with 80% RH air.
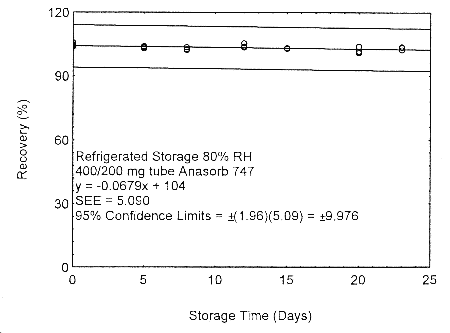
Figure 4.7.2.4. Refrigerated storage test of 400/200 mg Anasorb® 747 tube generated with 80% RH air..
These migration studies indicate that isopropyl alcohol migrates upon storage, especially at ambient temperature, but overall storage is stable at ambient and refrigerated temperatures. To avoid migration after sampling, isopropyl alcohol samples should be collected on two Anasorb® 747 tubes in series, a 400 mg and a 200 mg. The tubes are separated, capped, and sealed immediately after sampling.
4.8 Reproducibility
Six samples were collected from a test atmosphere using two Anasorb® 747 tubes, 400 mg and 200 mg, in series. The isopropyl alcohol concentration of the test atmosphere was 405 ppm. They were sampled at 0.2 L/min for 90 minutes. The relative humidity was 80% at 22°. The samples were submitted to an OSHA Salt Lake Technical Center service branch, along with a draft copy of this method. The samples were analyzed after being stored for 3 days at 4°. Sample results were corrected for desorption efficiency. No sample result for isopropyl alcohol had a deviation greater than the precision of the overall procedure determined in Section 4.6.
Reproducibility Data
|
| ||||
| sample | expected | reported | recovery | deviation |
| (mg) | (mg) | (%) | (%) | |
|
| ||||
| 1 | 19.47 | 19.69 | 101.1 | 1.1 |
| 2 | 19.83 | 20.36 | 102.7 | 2.7 |
| 3 | 19.84 | 20.15 | 101.6 | 1.6 |
| 4 | 19.81 | 20.18 | 101.9 | 1.9 |
| 5 | 19.47 | 20.22 | 103.9 | 3.9 |
| 6 | 19.81 | 19.85 | 100.2 | 0.2 |
|
| ||||
4.9 Sampler capacity
The sampling capacity of the 400-mg Anasorb® 747 sampling tube, Lot 645, was tested by sampling from a dynamically generated test atmosphere of isopropyl alcohol of 808 ppm. The samples were collected at 0.05 L/min and at 0.2 L/min. The relative humidities were approximately 12% and 80% at 22°. A GC with a gas sampling valve was placed in-line behind the 400-mg front test section. The valve was rotated to measure the amount of isopropyl alcohol passing through the sampler at the time of rotation. The 5% breakthrough air volume at 84% RH and 22° was determined to be 22.6 L.
| Table 4.9 | |||||||
| Capacity Tests for Isopropyl Alcohol on 400-mg Anasorb® 747 Tubes | |||||||
|
| |||||||
| 13% RH at 0.05 L/min | 12% RH at 0.2 L/min | 84% RH at 0.2 L/min | 77% RH at 0.05 L/min | ||||
| air volume | (BT) | air volume | (BT) | air volume | (BT) | air volume | (BT) |
| (L) | (%) | (L) | (%) | (L) | (%) | (L) | (%) |
|
| |||||||
| 32.11 | 0.0 | 29.01 | 0.0 | 19.78 | 0.0 | 27.39 | 0.0 |
| 34.32 | 0.44 | 29.37 | 2.15 | 22.08 | 2.85 | 28.83 | 4.23 |
| 36.57 | 1.23 | 29.76 | 2.98 | 22.13 | 0.58 | 28.94 | 4.70 |
| 37.18 | 5.24 | 29.78 | 4.13 | 24.61 | 19.51 | 29.53 | 11.31 |
| 38.80 | 5.44 | 30.20 | 6.21 | 24.74 | 6.63 | 30.07 | 10.40 |
| 39.38 | 14.83 | 30.55 | 8.03 | 26.47 | 19.84 | 30.29 | 21.82 |
| 41.26 | 18.29 | 30.65 | 13.47 | ||||
| 31.01 | 10.60 | ||||||
| 31.14 | 22.08 | ||||||
|
| |||||||
| BT = breakthrough | |||||||
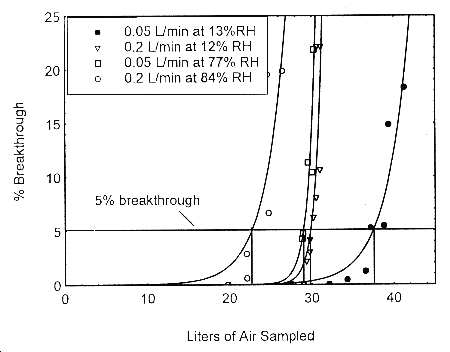
Figure 4.9. Five percent breakthrough air volume for isopropyl alcohol on Anasorb® 747. The breakthrough air volumes are: 22.6 L for 0.2 L/min at 84% RH, 29.0 L for 0.05 L/min at 77% RH, 29.8 L for 0.2 L/min at 12% RH, and 37.6 L for 0.05 L/min at 13% RH.
4.10 Desorption efficiency and stability of desorbed samples
- 4.10.1 The desorption efficiency from dry Anasorb® 747
The desorption efficiencies (DE) of isopropyl alcohol were
determined by liquid-spiking 400-mg portions of Anasorb® 747 with
amounts equivalent to 0.05 to 2 times the target concentration. These
samples were stored overnight at ambient temperature and then desorbed
with 3-mL of 60/40
| Table 4.10.1.1 | ||||||
| Desorption Efficiency of Isopropyl Alcohol | ||||||
|
| ||||||
| × target concn | 0.05× | 0.1× | 0.2× | 0.5× | 1.0× | 2.0× |
| (mg/sample) | 0.942 | 1.884 | 3.768 | 9.421 | 18.84 | 37.68 |
|
| ||||||
| DE (%) | 99.2 | 102.4 | 102.9 | 102.5 | 103.6 | 103.8 |
| 101.0 | 102.2 | 104.9 | 104.4 | 103.2 | 104.1 | |
| 99.9 | 104.2 | 102.7 | 102.4 | 104.3 | 102.6 | |
| 99.2 | 102.0 | 103.3 | 102.8 | 103.8 | 104.2 | |
| 100.6 | 102.8 | 104.9 | 104.8 | 103.6 | 103.3 | |
| 101.0 | 103.6 | 102.8 | 102.1 | 103.7 | 104.6 | |
| 100.2 | 102.9 | 103.6 | 103.2 | 103.7 | 103.8 | |
|
| ||||||
The stability of desorbed samples was investigated by reanalyzing the target concentration samples 64 h after initial analysis. After the original analysis was performed, three vials were recapped with new septa while the remaining three retained their punctured septa. The samples were reanalyzed with fresh standards. The average percent change was -0.2% for samples that were resealed with new septa and -0.3% for those that retained their punctured septa.
| Table 4.10.1.2 | |||||
| Stability of Desorbed Samples from Anasorb® 747 | |||||
|
| |||||
| punctured septa replaced | punctured septa retained | ||||
| initial | DE after | initial | DE after | ||
| DE | 64 hours | difference | DE | one day | difference |
| (%) | (%) | (%) | (%) | ||
|
| |||||
| 103.6 | 103.6 | 0.0 | 103.8 | 103.5 | -0.3 |
| 103.2 | 104.1 | +0.9 | 103.6 | 102.6 | -1.0 |
| 104.3 | 102.8 | -1.5 | 103.7 | 104.2 | +0.5 |
| averages | averages | ||||
| 103.7 | 103.5 | -0.2 | 103.7 | 103.4 | -0.3 |
|
| |||||
4.10.2 Desorption efficiency with wet Anasorb® 747
The possible interference of collected water vapor was studied by
determining the desorption efficiencies (DE) of isopropyl alcohol
after drawing humid air through previously spiked tubes. The
desorption efficiencies were determined by liquid-spiking 400-mg
portions of Anasorb® 747 with amounts equivalent to 0.05 to 2 times
the target concentration. These samples were stored for 4 hours at
ambient temperature and then had 20 L of humid air (80% RH at 21°)
drawn through them at 0.2 L/min. These samples were immediately
desorbed with 3-mL of 60/40
| Table 4.10.2 | ||||||
| Desorption Efficiency of Isopropyl Alcohol with Wet Anasorb® 747 | ||||||
|
| ||||||
| × target concn | 0.05× | 0.1× | 0.2× | 0.5× | 1.0× | 2.0× |
| (mg/sample) | 0.942 | 1.88 | 3.77 | 9.42 | 18.8 | 37.7 |
|
| ||||||
| DE (%) | 101.4 | 102.3 | 103.0 | 104.2 | 104.7 | 107.2 |
| 102.5 | 103.2 | 102.5 | 104.0 | 103.3 | 106.1 | |
| 103.2 | 104.5 | 103.8 | 104.7 | 104.3 | 107.3 | |
| 103.2 | 104.1 | 104.4 | 106.1 | 104.4 | 106.1 | |
| 103.4 | 102.9 | 102.8 | 104.4 | 105.2 | 106.1 | |
| 101.1 | 102.5 | 103.9 | 105.4 | 105.3 | 103.8 | |
| 102.5 | 103.3 | 103.4 | 104.8 | 104.5 | 106.1 | |
|
| ||||||
4.10.3 Desorption efficiency with 99/1
The desorption efficiencies (DE) of isopropyl alcohol were
determined by liquid-spiking 400-mg portions of Anasorb® 747 with
amounts equivalent to 0.05 to 2 times the target concentration. These
samples were stored overnight at ambient temperature. The samples were
desorbed with 3 mL of 99/1
| Table 4.10.3.1 | ||||||
| Desorption Efficiency of Dry Anasorb® 747 Desorbed with 99/1 CS2/DMF | ||||||
|
| ||||||
| × target concn | 0.05× | 0.1× | 0.2× | 0.5× | 1.0× | 2.0× |
| (mg/sample) | 0.942 | 1.88 | 3.77 | 9.42 | 18.8 | 37.7 |
|
| ||||||
| DE(%) | 92.1 | 93.9 | 94.0 | 95.2 | 98.6 | 98.6 |
| 92.0 | 92.0 | 93.9 | 97.2 | 99.2 | 99.5 | |
| 91.5 | 93.7 | 94.9 | 96.6 | 97.3 | 98.6 | |
| 92.0 | 94.3 | 94.3 | 95.7 | 97.1 | 100.0 | |
| 92.9 | 95.4 | 96.3 | 94.7 | 96.3 | 99.0 | |
| 93.4 | 94.2 | 95.6 | 95.0 | 96.5 | 99.8 | |
| 92.3 | 93.9 | 94.8 | 95.7 | 97.5 | 99.3 | |
|
| ||||||
| Table 4.10.3.2 | |||
| Desorption Efficiency of Wet Anasorb® 747 (18 L 80% RH at 22° drawn through them) Desorbed with 99/1 CS2/DMF | |||
|
| |||
| × target concn | 0.5× | 1.0× | 2.0× |
| (mg/sample) | 9.42 | 18.84 | 37.68 |
|
| |||
| DE (%) | 85.4 | 87.6 | 90.2 |
| 86.4 | 88.5 | 89.7 | |
| 87.5 | 89.7 | 88.1 | |
| 85.7 | 90.4 | 87.3 | |
| 86.1 | 88.1 | 90.4 | |
| 84.9 | 90.3 | 89.9 | |
| 86.0 | 89.1 | 89.3 | |
|
| |||
The apparent desorption efficiency of isopropyl alcohol with 99/1
4.11 Qualitative analysis
The mass spectrum for isopropyl alcohol was obtained from an HP5988A Mass Spec interfaced to a Hewlett-Packard 5890 Series II GC.
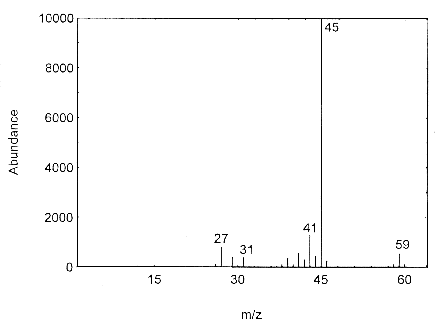
Figure 4.11. Mass spectra of isopropyl alcohol.
4.12 Capacity studies for ethyl and methyl alcohol at 0.2 L/min
The sampling capacity of Anasorb® 747 tubes at 0.2 L/min for methyl alcohol and ethyl alcohol was tested to determine if the higher flow rate could be used to sample for these analytes in conjunction with isopropyl alcohol. The sampling capacity of the 400-mg Anasorb® 747 sampling tube, Lot 645, was tested by sampling from a dynamically generated test atmosphere of either ethyl alcohol at 1987 ppm, or methyl alcohol at 402 ppm. The samples were collected at 0.2 L/min. The relative humidity in the ethyl alcohol tests was 13% and 80% at 23°. The relative humidity in the methyl alcohol tests was 11% and 80% at 22°. A GC with a gas sampling valve was placed in-line behind the 400-mg tube. The valve was rotated to measure the amount of compound, either ethyl alcohol or methyl alcohol, passing through the sampler at the time of rotation. The 5% breakthrough air volume for ethyl alcohol was 14.1 L at 13% RH and 15.7 L for 80% RH. The 5% breakthrough air volume for methyl alcohol was 2.38 L at 11% RH and 2.84 L at 80% RH. These breakthrough determinations indicate that methyl alcohol should not be sampled at 0.2 L/min.
| Table 4.12.1 | |||
| Capacity Tests for Ethyl Alcohol on 400-mg Anasorb® 747 Tubes at 0.2 L/min | |||
|
| |||
| 13% RH at 0.2 L/min | 80% RH at 0.2 L/min | ||
| air volume (L) | breakthrough (%) | air volume (L) | breakthrounh (%) |
|
| |||
| 10.60 | 0.00 | 10.16 | 0.00 |
| 12.06 | 0.49 | 10.76 | 0.00 |
| 13.51 | 0.81 | 11.88 | 0.12 |
| 14.22 | 0.00 | 12.19 | 0.38 |
| 14.97 | 2.38 | 13.30 | 0.45 |
| 15.64 | 1.37 | 13.61 | 1.97 |
| 16.42 | 8.33 | 14.68 | 3.89 |
| 17.16 | 7.18 | 15.03 | 10.42 |
| 17.88 | 18.64 | 16.15 | 22.34 |
| 19.33 | 34.19 | 16.45 | 40.30 |
| 20.01 | 40.46 | 17.57 | 77.04 |
|
| |||
| Table 4.12.2 | |||
| Capacity Tests for Methyl Alcohol on 400-mg Anasorb® 747 Tubes at 0.2 L/min | |||
|
| |||
| 11% RH at 0.2 L/min | 80% RH at 0.2 L/min | ||
| air volume (L) | breakthrough (%) | air volume (L) | breakthrough (%) |
|
| |||
| 1.66 | 0 | 1.61 | 0 |
| 2.34 | 0 | 2.34 | 0 |
| 3.12 | 14.56 | 2.98 | 3.994 |
| 3.72 | 13.87 | 3.96 | 12.22 |
| 4.68 | 49.40 | 4.47 | 16.50 |
| 5.18 | 44.77 | 5.59 | 23.00 |
| 6.24 | 76.64 | 5.93 | 30.36 |
| 6.56 | 69.97 | 7.01 | 39.35 |
| 7.38 | 39.31 | ||
|
| |||
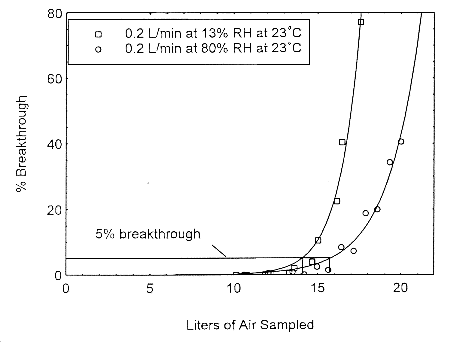
Figure 4.12.1. Five percent breakthrough air volume for ethyl alcohol on Anasorb® 747. The breakthrough air volumes at 0.2 L/min were 14.1 L and 15.7 L for 13% and 80% RH respectively.
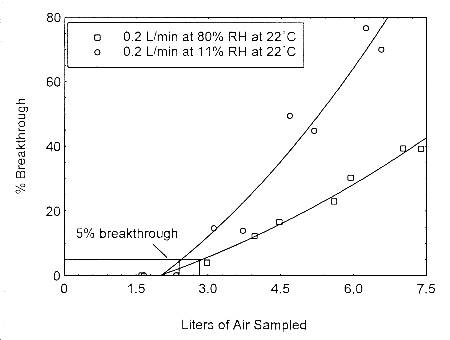
Figure 4.12.2. Five percent breakthrough air volume for methyl alcohol on Anasorb® 747. The breakthrough air volumes at 0.2 L/min were 2.38 L and 2.84 L for 11% and 80% RH respectively.
5. References
- 5.1 NIOSH Manual of Analytical Methods, Eller, P.M., Ed,
4th ed., U.S. Department of Health and Human Services, Public Health
Service, Centers for Disease Control, National Institute for
Occupational Safety and Health, Division of Physical Sciences and
Engineering, Cincinnati, OH, DHHS (NIOSH) Publication No. 94-l 13,
1994; Method 1400.
5.2 Eide, M., A Study of the Desorption, Retention, and Storage Efficiencies of Isopropyl Alcohol from Charcoal tubes Lot 120, OSHA Salt Lake Technical Center, unpublished, Salt Lake City, UT 84165, October 1996.
5.3 OSHA Analytical Methods Manual, 2nd ed., U.S. Department of Labor, Occupational Safety and Health Administration, Directorate for Technical Support, OSHA Salt Lake Technical Center, Salt Lake City, UT 84165, October 1993, Part 1, Volume 4, Method 91, ACGIH publication #4542.
5.4 OSHA Analytical Methods Manual, 2nd ed., U.S. Department of Labor, Occupational Safety and Health Administration, Directorate for Technical Support, OSHA Salt Lake Technical Center, Salt Lake City, UT 84165, October 1993, Part 1, Volume 4, Method 100, ACGIH publication #4542.
5.5 Documentation of the Threshold Limit Values and Biological Exposure Indices, 6th ed.; American Conference of Governmental Industrial Hygienists, Inc.: Cincinnati, OH, 1991, Vol. II, p. 828.
5.6 Chem. Eng. News, 1995, 73(26), p. 40.
5.7 Merck Index, Budavari, S., Ed., 12th ed., Merck & Co., Whitehouse Station NJ, 1996, p. 889.
5.8 Hawley's Condensed Chemical Dictionary, Lewis, R., Ed., 12th ed., Van Nostrand Reinhold Co., New York, 1993, p. 660.