Estradiol
Estriol
Estrone
17-a-Methyltestosterone
Progesterone
Testosterone
| Method number: | PV2001 | |
| Target concentration: | 0.1 mg/m3 | |
| Procedure: | Samples are collected open face by drawing
workplace air through glass fiber filters. Samples are extracted
with | |
| Recommended sampling time and sampling rate: |
240 min at 1.0 L/min (240 L) | |
| Reliable quantitation limit: | estradiol: estriol: estrone: 17-a-methyltestosterone: progestrone testosterone |
5.4 µg/m3 7.1 µg/m3 4.6 µg/m3 1.2 µg/m3 3.1 µg/m3 2.5 µg/m3 |
| Status of method: | Partially evaluated method. This method has been subjected to established evaluation procedures of the Methods Development Team and is presented for information and trial use. | |
| October 1999 | Mary E. Eide | |
Methods Development Team
Industrial Hygiene Chemistry
Division
OSHA Salt Lake Technical Center
Salt Lake City UT
84115-1802
1. General Discussion
1.1 Background
1.1.1 History
Air samples were received at SLTC collected on glass fiber
filters requesting analysis for estradiol, estrone, estriol,
In 1984, NIOSH published an evaluation of exposure to estradiol
benzoate, progesterone, testosterone, b-estradiol, estrone, and testosterone
propionate, in which they collected the air samples on glass fiber
filters with analysis by LC with UV detection.1
Workplace exposure monitoring for
testosterone, and progesterone at Pharmacia & Upjohn uses
collection of samples on glass fiber filters and analysis LC with
ultraviolet detection at 242 nm.2,3
Other air bourne steroids and hormones have been
collected on glass fiber filters and analyzed by LC at SLTC.4
Based on these studies, collection on glass fiber filters and
analysis by LC with an ultraviolet detector at two wavelengths, 240
and 280 nm, was chosen for estradiol, estrone, estriol,
1.1.2 Toxic effects (This section is for information only and should not be taken as the basis of OSHA policy.)
While these hormones are naturally occurring in the human body
and, at the proper levels, are necessary for normal functioning. At
elevated levels there can be toxic and carcinogenic effects because
they are growth promoters. Estradiol, estrone, and
estriol can be absorbed through skin, mucous membrane, and
gastrointestinal tract.5
Estrogens, testosterones, and progesterone are used in
varying amounts and combinations to treat menopausal symptoms.
Estrogens can cause loss of libido and impotence in males and
menstrual disorders in females.6
Estradiol, estrone, progesterone, and
testoterone are confirmed animal carcinogens with neoplastigenic,
tumorigenic, and teratogenic effects.7,8,9,10
Estradiol causes human and animal mutations.
Estradiol has developmental reproductive effects.11
Estriol is a suspected carcinogen with animal
carcinogenic, neoplastigenic, tumorigenic, and teratogenic
effects.12
Estrone is a poison by intraperitoneal and subcutaneous routes. Estrone reproductive effects include inhibition of egg
implantation, supression of spermatogenesis, and impotence.13
1.1.3 Workplace exposure17
Workers in the pharmaceutical industry are exposed to hormones in the production and formulation processes.
1.1.4 Physical properties and other descriptive
information
| Estradiol18,19,20 | |||
| CAS number: | 50-28-2 | IMIS number: | E319 |
| RTECS number: | KG2975000 | molecular weight: | 272.39 |
| melting point: | 178-179 °C | odor: | odorless |
| appearance: | white to pale yellow | lmax: | 280 nm |
| crystals | molecular formula: | C18H24O2 | |
| synonyms: | Dihydrofollicular hormone;
Dihydrofolliculin; Dihydroxestrin; Dihydrotheelin;
Dimenformon; Diogyn; Estrace; Estraderm; (17b)-Estra-1,3,5(10)-triene-3,17-diol;
| ||
| solubility: | alcohol, acetone, dioxane, fixed alkali hydroxides, sparingly soluble in vegetable oils | ||
| structural formula: | 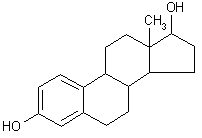 | ||
| Estriol21,22,23 | |||
| CAS number: | 50-27-1 | IMIS: | E321 |
| RTECS number: | KG8225000 | molecular weight: | 288.39 |
| melting point: | 282 °C | lmax: | 280 nm |
| appearance: | white crystals | molecular formula: | C18H24O3 |
| odor: | odorless | ||
| synonyms: | Aacifemine; Colpogyn; Destriol;
(16a,17b)-Estra-1,3,5(10)-triene-3,16,17-triol;
| ||
| solubility: | alcohol, dioxane, chloroform, ether, vegetable oils, pyridine, fixed alkali hydroxide solutions | ||
| structural formula: | 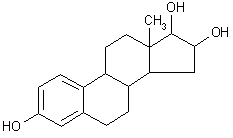 | ||
| Estrone24, 25, 26 | |||
| CAS number: | 53-16-7 | IMIS: | E320 |
| RTECS number: | KG8225000 | molecular weight: | 270.37 |
| melting point: | 254-256 °C | lmax: | 283-285 nm |
| appearance: | white crystals | molecular formula: | C18H22O2 |
| odor: | odorless | ||
| synonyms: | Crinovaryl; Cristallovar; Destrone;
Disynformon; Endofolliculina;
| ||
| solubility: | water, alcohol, acetone, chloroform, benzene, dioxane, pyridine, fixed alkali hydroxide solutions, slightly soluble in ether, vegetable oils | ||
| structural formula: | 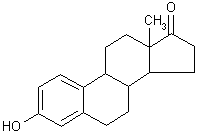 | ||
| 17-a-Methyltestosterone27,28,29 | |||
| CAS number: | 58-18-4 | IMIS: | M350 |
| RTECS number: | BV8400000 | molecular weight: | 302.46 |
| melting point: | 161-166 °C | lmax: | 242 nm |
| appearance: | white crystals | molecular formula: | C20H30O2 |
| odor: | odorless | ||
| synonyms: | Android;
| ||
| solubility: | alcohol, methanol, ether and in other organic solvents, sparingly soluble in vegetable oils | ||
| structural formula: | 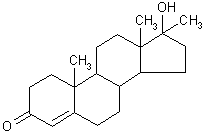 | ||
| Progesterone30,31,32 | |||
| CAS number: | 57-83-0 | IMIS: | P446 |
| RTECS number: | TW0175000 | molecular weight: | 314.47 |
| melting point: | 129-130 °C | lmax: | 240 nm |
| appearance: | white crystals | molecular formula: | C21H30O2 |
| odor: | odorless | ||
| synonyms: | Corlutina; Corluvite; Corpus luteum
hormone; Cyclogest; Gestiron; Gestone;
| ||
| solubility: | alcohol, acetone, dioxane, conc H2SO4, sparingly soluble in vegetable oils | ||
| structural formula: | 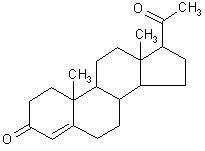 | ||
| Testosterone33,34,35 | |||
| CAS number: | 58-22-0 | IMIS: | T413 |
| RTECS number: | XA3030000 | molecular weight: | 288.39 |
| melting point: | 155 °C | lmax: | 238 nm |
| appearance: | white crystals | molecular formula: | C19H28O2 |
| odor: | odorless | ||
| synonyms: | Andro; D4-Androsten-17b-ol-3-one; (17b)-17-Hydroxyandrost-4-en-3-one; Mertestate: Oreton; Testoderm; Testolin; Testro AQ; Virosterone | ||
| solubility: | alcohol, ether, and other organic solvents | ||
| structural formula: | 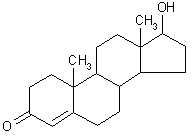 | ||
This method was evaluated according to the OSHA SLTC "EVALUATION GUIDELINES FOR AIR SAMPLING METHODS UTILIZING CHROMATOGRAPHIC ANALYSIS"36. The Guidelines define analytical parameters, specify required laboratory tests, statistical calculations and acceptance criteria. The analyte air concentrations throughout this method are based on the recommended sampling and analytical parameters.
1.2 Detection limit of the overall procedure (DLOP) and reliable quantitation limit (RQL)
The DLOP is measured as mass per sample and expressed as equivalent
air concentrations, based on the recommended sampling parameters. Ten
samplers were spiked with equal descending increments of analyte, such
that the highest sampler loading was 4.8 µg/sample for estradiol,
estriol, and estrone, and 4.0 µg/sample for
| Compound | Slope | SEE | DLOP µg/sample |
DLOP µg/m3 |
RQL µg/sample |
RQL µg/m3 |
Recovery % |
| Estradiol Estriol Estrone 17-a-Methyltestosterone Progesterone Testosterone |
29814 28813 25564 165192 133882 191771 |
3889 4927 2780 4763 9931 11471 |
0.34 0.51 0.33 0.087 0.22 0.18 |
1.4 2.1 1.4 0.36 0.93 0.75 |
1.3 1.7 1.1 0.29 0.74 0.60 |
5.4 7.1 4.6 1.2 3.1 2.5 |
98.2 97.2 99.1 97.9 98.9 98.8 |
|
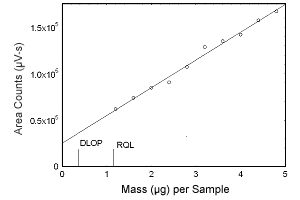 Figure 1.2.1 Plot of data to determine the DLOP/RQL for estradiol. (Y = 29814X + 25280) | |||||||||||
| | ||||||||||||
|
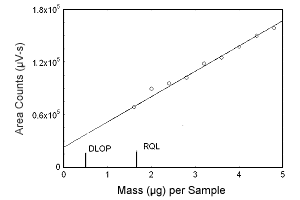 Figure 1.2.2 Plot of data to determine the DLOP/RQL for estriol. (Y = 28813X + 22963) | |||||||||||
| | ||||||||||||
|
 Figure 1.2.3 Plot of data to determine the DLOP/RQL for estrone. (Y = 25564X + 25007) | |||||||||||
| | ||||||||||||
|
 Figure 1.2.4 Plot of data to determine the DLOP/RQL for 17-a-methyltestosterone. (Y = 165192X + 34184) | |||||||||||
| | ||||||||||||
|
 Figure 1.2.5 Plot of data to determine the DLOP/RQL for progesterone. (Y = 133882X + 35281) | |||||||||||
| | ||||||||||||
|
 Figure 1.2.6 Plot of data to determine the DLOP/RQL for testosterone. (Y = 191771X + 42669) | |||||||||||
| | ||||||||||||
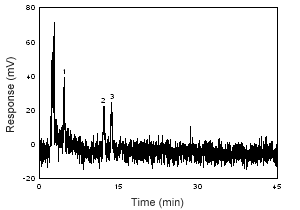 Figure 1.2.7 Chromatogram of the RQL of estradiol, estrone, and estriol at 280 nm. (1 = estriol; 2 = estrone; 3 = estradiol) |
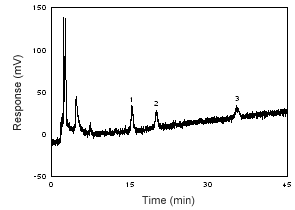 Figure 1.2.8 Chromatogram of the RQL of 17-a-methyltestosterone, progesterone, and testosterone at 240 nm. (1 = testosterone; 2 = | |||||||||||
2. Sampling Procedure
All safety practices that apply to the work area being sampled should be followed. The sampling equipment should be attached to the worker in such a manner that it will not interfere with work performance or safety.
2.1 Apparatus
2.1.1 Samples are collected using a personal sampling pump calibrated, with the sampling device attached, to within ±5% of the recommended flow rate.
2.1.2 Samples are collected on
2.2 Reagents
None required
2.3 Technique
2.3.1 Immediately before sampling, remove the top piece and the end plug from the cassette.
2.3.2 Attach the cassette to the sampling pump so that it is in an approximately vertical position with the inlet facing up during sampling. Position the sampling pump, cassette and tubing so it does not impede work performance or safety.
2.3.3 Air being sampled should not pass through any hose or tubing before entering the cassette.
2.3.4 After sampling for the appropriate time, remove the sample,
and replace the top piece and the end plug. Wrap each sample
2.3.5 Submit at least one blank sample with each set of samples. Handle the blank sampler in the same manner as the other samples except draw no air through it.
2.3.6 Record sample volumes (in liters of air) for each sample, along with any potential interferences.
2.3.7 Ship any bulk samples separate from the air samples.
2.3.8 Submit the samples to the laboratory for analysis as soon as possible after sampling. If delay is unavoidable, store the samples in a refrigerator.
2.4 Extraction efficiency
The extraction efficiencies of estradiol, estriol, estrone,
|
| ||||||||
| level
|
sample number
| |||||||
| × target concn |
µg per sample |
1 | 2 | 3 | 4 | 5 | 6 | mean |
|
| ||||||||
| 0.1 0.5 1.0 2.0 1.0 (wet) |
2.66 13.3 26.6 53.2 26.6 |
98.5 99.6 99.2 99.4 99.6 |
101.1 101.2 99.6 99.0 99.5 |
100.2 100.1 99.9 98.7 99.1 |
101.0 101.0 101.3 101.1 100.2 |
98.0 101.1 101.0 101.3 99.9 |
98.6 100.1 101.1 100.2 99.8 |
99.6 100.5 100.4 100.0 99.7 |
|
| ||||||||
|
| ||||||||
| level
|
sample number
| |||||||
| × target concn |
µg per sample |
1 | 2 | 3 | 4 | 5 | 6 | mean |
|
| ||||||||
| 0.1 0.5 1.0 2.0 1.0 (wet) |
2.48 12.4 24.8 49.6 24.8 |
101.1 98.4 100.1 99.3 99.3 |
99.8 101.3 101.1 99.1 99.2 |
95.8 100.2 101.1 98.3 100.1 |
101.2 99.5 101.1 98.2 98.9 |
98.2 99.0 100.2 101.0 100.0 |
100.0 99.4 100.2 99.9 99.2 |
99.4 99.6 100.6 99.3 99.5 |
|
| ||||||||
|
| ||||||||
| level
|
sample number
| |||||||
| × target concn |
µg per sample |
1 | 2 | 3 | 4 | 5 | 6 | mean |
|
| ||||||||
| 0.1 0.5 1.0 2.0 1.0 (wet) |
2.64 13.2 26.4 52.8 26.4 |
98.6 101.1 99.7 99.7 99.6 |
100.1 100.3 100.0 99.0 99.7 |
98.9 99.5 100.1 99.1 100.2 |
101.1 100.2 99.9 99.1 99.3 |
101.0 100.1 100.3 101.3 99.9 |
101.1 98.9 101.0 100.3 99.8 |
100.1 100.0 100.2 99.8 99.8 |
|
| ||||||||
|
| ||||||||
| level
|
sample number
| |||||||
| × target concn |
µg per sample |
1 | 2 | 3 | 4 | 5 | 6 | mean |
|
| ||||||||
| 0.1 0.5 1.0 2.0 1.0 (wet) |
2.5 12.5 25.0 50.0 25.0 |
100.5 100.7 99.8 100.3 99.9 |
98.9 99.7 99.5 100.5 100.1 |
99.5 99.4 99.3 100.8 99.2 |
101.4 100.3 99.1 100.3 99.5 |
99.9 100.2 99.0 100.1 99.3 |
99.4 100.2 99.0 100.1 98.6 |
99.9 100.1 99.3 100.4 99.4 |
|
| ||||||||
|
| ||||||||
| level
|
sample number
| |||||||
| × target concn |
µg per sample |
1 | 2 | 3 | 4 | 5 | 6 | mean |
|
| ||||||||
| 0.1 0.5 1.0 2.0 1.0 (wet) |
2.6 13.0 26.0 52 26.0 |
98.1 99.8 100.2 99.7 99.6 |
100.2 99.8 99.9 99.3 99.2 |
101.1 99.6 100.2 99.3 99.5 |
101.1 100.2 100.1 99.4 99.8 |
100.0 99.9 99.9 99.4 99.9 |
100.2 100.1 99.7 99.9 99.7 |
100.1 99.9 100.0 99.5 99.6 |
|
| ||||||||
|
| ||||||||
| level
|
sample number
| |||||||
| × target concn |
µg per sample |
1 | 2 | 3 | 4 | 5 | 6 | mean |
|
| ||||||||
| 0.1 0.5 1.0 2.0 1.0 (wet) |
2.32 11.6 23.2 46.4 23.2 |
98.3 100.1 101.3 99.9 99.6 |
101.0 100.3 100.1 101.2 99.9 |
101.2 100.2 100.0 99.7 99.4 |
100.2 100.1 100.3 99.2 99.8 |
100.0 100.1 100.4 99.8 99.5 |
100.1 100.2 100.0 100.3 100.4 |
100.1 100.2 100.4 100.0 99.8 |
|
| ||||||||
2.5 Retention efficiency
Six glass fiber filters were spiked with one of the analytes,
allowed to equilibrate for 6 h, and then were placed into a
|
| |||||||
| sample number
|
|||||||
| section | 1 | 2 | 3 | 4 | 5 | 6 | mean |
|
| |||||||
| front rear total |
96.7 0.0 96.7 |
98.5 0.0 98.5 |
98.7 0.0 98.7 |
99.1 0.0 99.1 |
100.1 0.0 100.1 |
101.0 0.0 101.0 |
99.0 0.0 99.0 |
|
| |||||||
|
| |||||||
| sample number
|
|||||||
| section | 1 | 2 | 3 | 4 | 5 | 6 | mean |
|
| |||||||
| front rear total |
99.2 0.0 99.2 |
102.1 0.0 102.1 |
101.0 0.0 101.0 |
98.3 0.0 98.3 |
98.0 0.0 98.0 |
99.1 0.0 99.1 |
99.6 0.0 99.6 |
|
| |||||||
|
| |||||||
| sample number
|
|||||||
| section | 1 | 2 | 3 | 4 | 5 | 6 | mean |
|
| |||||||
| front rear total |
96.4 0.0 96.4 |
101.1 0.0 101.1 |
100.0 0.0 100.0 |
100.2 0.0 100.2 |
96.2 0.0 96.2 |
96.0 0.0 96.0 |
98.3 0.0 98.3 |
|
| |||||||
|
| |||||||
| sample number
|
|||||||
| section | 1 | 2 | 3 | 4 | 5 | 6 | mean |
|
| |||||||
| front rear total |
98.8 0.0 98.8 |
101.6 0.0 101.6 |
98.6 0.0 98.6 |
99.0 0.0 99.0 |
98.8 0.0 98.8 |
100.3 0.0 100.3 |
99.5 0.0 99.5 |
|
| |||||||
|
| |||||||
| sample number
|
|||||||
| section | 1 | 2 | 3 | 4 | 5 | 6 | mean |
|
| |||||||
| front rear total |
99.7 0.0 99.7 |
99.3 0.0 99.3 |
101.1 0.0 101.1 |
99.8 0.0 99.8 |
98.4 0.0 98.4 |
98.0 0.0 98.0 |
99.4 0.0 99.4 |
|
| |||||||
|
| |||||||
| sample number
|
|||||||
| section | 1 | 2 | 3 | 4 | 5 | 6 | mean |
|
| |||||||
| front rear total |
98.5 0.0 98.5 |
98.3 0.0 98.3 |
99.5 0.0 99.5 |
98.7 0.0 98.7 |
97.4 0.0 97.4 |
97.6 0.0 97.6 |
98.3 0.0 98.3 |
|
| |||||||
2.6 Sample storage
Nine glass fiber filters were each spiked with 26.6 µg (0.111
mg/m3) of estradiol, 24.8 µg (0.103
mg/m3) of estriol, 26.4 µg (0.110
mg/m3) of estrone, 25.0 µg (0.100
mg/m3) of
|
| |||||||||||||||||||||||||||||||||||||||||||||||||||||||||||||
| | ||||||||||||||||||||||||||||||||||||||||||||||||||||||||||||||
|
| |||||||||||||||||||||||||||||||||||||||||||||||||||||||||||||
| | ||||||||||||||||||||||||||||||||||||||||||||||||||||||||||||||
|
| |||||||||||||||||||||||||||||||||||||||||||||||||||||||||||||
2.7 Recommended air volume and sampling rate.
Based on the data collected in this evaluation,
2.8 Interferences (sampling)
2.8.1 It is not known if any compounds will severely interfere
with the collection of estradiol, estriol, estrone,
2.8.2 Suspected interferences should be reported to the laboratory with submitted samples.
3. Analytical Procedure
Adhere to the rules set down in your Chemical Hygiene Plan. Avoid skin contact and inhalation of all chemicals and review all appropriate MSDSs.
3.1 Apparatus
3.1.1 A liquid chromatograph equipped with an ultraviolet detector. A Waters 600E controller, 490E ultraviolet detector, and 717 autosampler was used in this evaluation.
3.1.2 An LC column capable of separating the analyte from any
interferences. The column used in this study was a Bakerbond C18,
3.1.3 An electronic integrator or some suitable method of measuring peak areas. A Waters Millennium32 data system was used in this evaluation.
3.1.4 Four milliliter glass vials with
3.1.5 A
3.1.6 Pipets for dispensing the extracting solvent.
3.1.7 Volumetric flasks -
3.2 Reagents
3.2.1 Methyl alcohol, HPLC grade. Fisher Optima methyl alcohol, 99.9% min (lot 992075) was used in this evaluation.
3.2.2 Deionized water. A Millipore
3.2.3 Phosphoric acid. JT Baker Bakeranalyzed phosphoric acid 85.9%, (lot D25821) was used in this evaluation.
3.2.4 b-Estradiol, reagent grade. Sigma b-estradiol, 99% min (lot 98H0953)was used in this evaluation.
3.2.5 Estriol, reagent grade. Sigma estriol, 99% min (lot 18H0385) was used in this evaluation.
3.2.6 Estrone, reagent grade. Acros estrone, 99%+ (lot A002906801) was used in this evaluation.
3.2.7 17-a-Methyl testosterone, reagent
grade. Sigma
3.2.8 Progesterone, reagent grade. Sigma progesterone, 99% min (lot 128H0456), was used in this evaluation.
3.2.9 Testosterone, reagent grade. Sigma testosterone, 99% min (lot 67H0276), was used in this evaluation.
3.2.10 The LC mobile phase was 65:35:0.2 methyl alcohol:water:H3PO4.
3.3 Standard preparation
3.3.1 At least two separate stock standards are prepared by
diluting a known quantity of estradiol, estriol, estrone,
3.3.2 Dilutions of these stock standards were prepared to bracket sample concentrations. The range of the standards used in this study was approximately from 0.1 to 50 µg/mL for each hormone.
3.4 Sample preparation
3.4.1 Sample cassettes are opened and the glass fiber filter is
placed in a
3.4.2 The filter is extracted with 4 mL of methyl alcohol.
3.4.3 The vials are sealed immediately and extracted for 30 minutes using a laboratory shaker.
3.5 Analysis
3.5.1 Liquid chromatograph conditions.
| Injection size: | 20 µL |
| Column: | Bakerbond |
| Mobile phase: | 1 mL/min 65:35:0.2 methyl alcohol:water:H3PO4 |
| Detector: | UV at 240 and 280 nm |
3.5.2 Peak areas are measured by an integrator or other suitable
means.
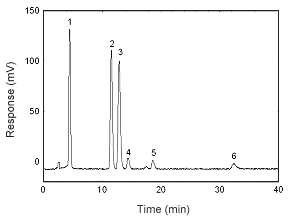 Figure 3.5.1 A chromatogram at 280 nm of 13.3 µg/mL estradiol, 12.4 .0g/mL estriol, 13.2 µg/mL estrone, 12.5 µg/mL 17-a-methyl testosterone, 13.0 µg/mL progesterone, and 11.6 µg/mL testosterone. Key: (1) estriol, (2) estrone, (3) estradiol, (4) testosterone, (5) |
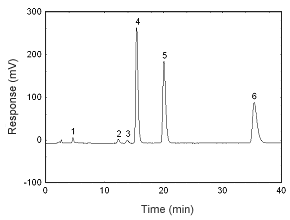 Figure 3.5.2 A chromatogram at 240 nm of 13.3 µg/mL estradiol, 12.4 µg/mL estriol, 13.2 .µg/mL estrone, 12.5 µg/mL 17-a-methyl testosterone, 13.0 µg/mL progesterone, and 11.6 µg/mL testosterone. Key: (1) estriol, (2) estrone, (3) estradiol, (4) testosterone, (5) | |
| | ||
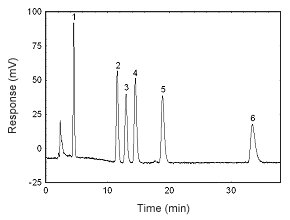 Figure 3.5.3 A chromatogram at 270 nm of 13.3 µg/mL estradiol, 12.4 µg/mL estriol, 13.2 µg/mL estrone, 12.5 µg/mL 17-a-methyltestosterone, 13.0 µg/mL progesterone, and 11.6 µg/mL testosterone in methanol. Key: (1) estriol, (2) estrone, (3) estradiol, (4) testosterone, (5) |
3.5.3 An external standard calibration method is used. A
calibration curve can be constructed by plotting the response of the
injections versus micrograms of analyte per standard. Bracket the
samples with freshly prepared analytical standards over the range of
concentrations.
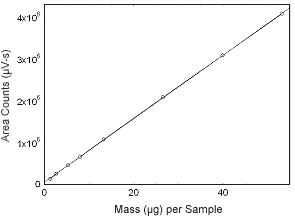 Figure 3.5.4 Calibration curve of estradiol. (Y = 7.59E4x + 5.15E4.) |
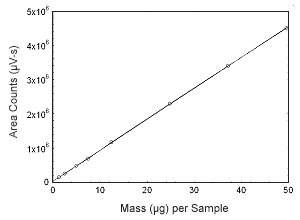 Figure 3.5.5 Calibration curve of estriol. (Y = 9.03E4x + 3.53 E4.) |
| | |
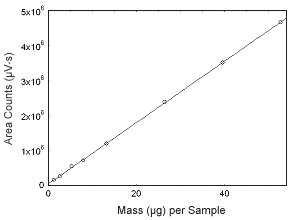 Figure 3.5.6 Calibration curve of estrone. (Y = 8.78E4x + 4.35E4.) |
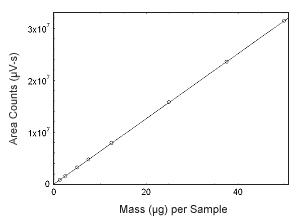 Figure 3.5.7 Calibration curve of 17-a-methyltestosterone. (Y = 6.27E5x; + 5.70E4.) |
| | |
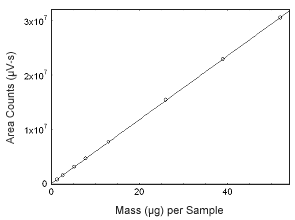 Figure 3.5.8 Calibration curve of progesterone. (Y = 5.86E5x + 7.64E4.) |
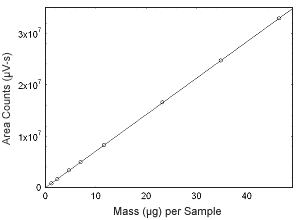 Figure 3.5.9 Calibration curve of testosterone. (Y = 7.08E5x + 6.88E4.) |
3.6 Interferences (analytical)
3.6.1 Any compound that produces a LC response and has a similar retention time as the analyte is a potential interference. If any potential interferences were reported, they should be considered before samples are extracted. Generally, chromatographic conditions can be altered to separate an interference from the analyte.
3.6.2 When necessary, the identity or purity of an analyte peak
may be confirmed by mass spectrometry or by another analytical
procedure. The mass spectra in Figures 3.6.1 through 3.6.6 were from
the NIST spectral library. The air and bulk samples received at SLTC
were compared to this NIST library when they were confirmed. The
instrument used was an HP 5973 Mass Selective Detector on an HP 6890
GC. The column used was a
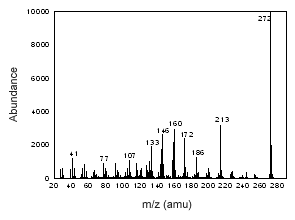 Figure 3.6.1 The mass spectrum of estradiol. |
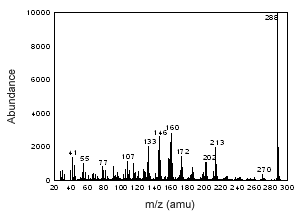 Figure 3.6.2 The mass spectrum of estriol. |
| | |
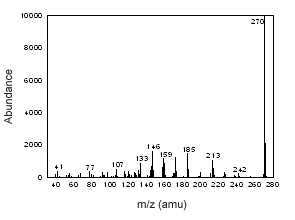 Figure 3.6.3 The mass spectrum of estrone. |
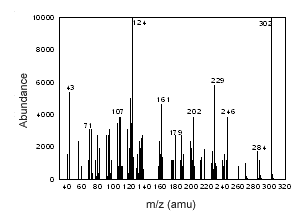 Figure 3.6.4 The mass spectrum of 17-a-methyltestosterone |
| | |
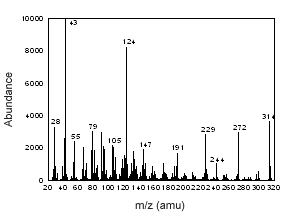 Figure 3.6.5 The mass spectrum of progesterone. |
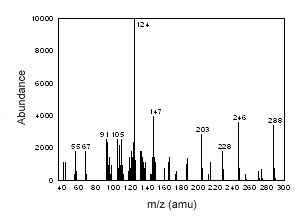 Figure 3.6.6 The mass spectrum of testosterone. |
3.7 Calculations
The amount of each analyte per sampler is obtained from the appropriate calibration curve in terms of micrograms per sample, uncorrected for extraction efficiency. This total amount is then corrected by subtracting the total amount (if any) found on the blank. The air concentration is calculated using the following formulas.
| CM = | M
VEE |
| where | CM is
concentration by weight
(mg/m3) M is micrograms per sample (µg/mL corrected for blank × V is liters of air sampled EE is extraction efficiency, in decimal form |
4. Recommendations for Further Study
Collection and reproducibility studies need to be performed to make this a validated method.
1. Lucas, A., Health Hazard Evaluation Report HETA
2. Portis, E., Progesterone in Air, Pharmacia & Upjohn, Kalamazoo, MI, unpublished work, 1994. Back to text
3. Portis, E., Testosterone in Air, Pharmacia & Upjohn, Kalamazoo, MI, unpublished work, 1994. Back to text
4. Eide, M., A Study of Melegestrol Acetate, Sulfamethazine, and Carbodox Extraction and Retention on Glass Fiber Filters and AA filters and the Extraction from Whatman 41 Filters, OSHA Salt Lake Technical Center: Salt Lake City, UT. Unpublished work, 1985. Back to text
5. Arky, R. Physicians' Desk Reference, 51 ed.: Montvale, NJ, 1997, p752. Back to text
6. Harrington, J.M., Occupational Exposure to Synthetic Estrogens, Scand j Work Envirrn Health, 8(1982), suppl 1, p167-171. Back to text
7. Lewis, R.J., Carcinogenically Active Chemicals, Van Nostrand Reinhold: New York, 1991, p131. Back to text
8. Lewis, R.J., Carcinogenically Active Chemicals, Van Nostrand Reinhold: New York, 1991, p133. Back to text
9. Lewis, R.J., Carcinogenically Active Chemicals, Van Nostrand Reinhold: New York, 1991, p189. Back to text
10. Lewis, R.J., Carcinogenically Active Chemicals, Van Nostrand Reinhold: New York, 1991, p202. Back to text
11. Lewis, R.J., Carcinogenically Active Chemicals, Van Nostrand Reinhold: New York, 1991, p131. Back to text
12. Lewis, R.J., Carcinogenically Active Chemicals, Van Nostrand Reinhold: New York, 1991, p267. Back to text
13. Lewis, R.J., Carcinogenically Active Chemicals, Van Nostrand Reinhold: New York, 1991, p133. Back to text
14. Lewis, R.J., Carcinogenically Active Chemicals, Van Nostrand Reinhold: New York, 1991, p732. Back to text
15. Lewis, R.J., Carcinogenically Active Chemicals, Van Nostrand Reinhold: New York, 1991, p189. Back to text
16. Lewis, R.J., Carcinogenically Active Chemicals, Van Nostrand Reinhold: New York, 1991, p202. Back to text
17. Paul, M., Occupational and Enviromental Reproductive Hazards: A Guide for Clinicians, Williams & Wilkins: Baltimore, MD, 1993, p290. Back to text
18. Lewis, R., J., Hawley's Condensed Chemical Dictionary, 12th ed., Van Nostrand Reinhold Co.: New York, 1993, p 473. Back to text
19. Budavari, S., The Merck Index, 12 th ed., Merck & Co. Inc.: Whitehouse Station, NJ, 1996, p 630. Back to text
20. Lide, D., R., CRC Handbook of Chemistry and Physics, CRC Press: Boca Raton, FL, 1992, p 7-15. Back to text
21. Lewis, R., J., Hawley's Condensed Chemical Dictionary, 12th ed., Van Nostrand Reinhold Co.: New York, 1993, p 474. Back to text
22. Budavari, S., The Merck Index, 12th ed., Merck & Co. Inc.: Whitehouse Station, NJ, 1996, p 631. Back to text
23. Lide, D., R., CRC Handbook of Chemistry and
Physics, CRC Press: Boca Raton, FL, 1992, p
24. Lewis, R., J., Hawley's Condensed Chemical Dictionary, 12th ed., Van Nostrand Reinhold Co.: New York, 1993, p 474. Back to text
25. Budavari, S., The Merck Index, 12th ed., Merck & Co. Inc: Whitehouse Station, NJ, 1996, p 632. Back to text
26. Lide, D., R., CRC Handbook of Chemistry and Physics, CRC Press: Boca Raton, FL, 1992, p 7-16 Back to text
27. Lewis, R., J., Hawley's Condensed Chemical Dictionary, 12th ed., Van Nostrand Reinhold Co.: New York, 1993, p 781. Back to text
28. Budavari, S., The Merck Index, 12th ed., Merck & Co. inc.: Whitehouse Station, NJ, 1996, p 1045. Back to text
29. Lide, D., R., CRC Handbook of Chemistry and Physics, CRC Press: Boca Raton, FL, 1992, p 7-13. Back to text
30. Lewis, R., J., Hawley's Condensed Chemical Dictionary, 12th ed., Van Nostrand Reinhold Co.: New York, 1993, p 965. Back to text
31. Budavari, S., The Merck Index, 12th ed., Merck & Co. inc.: Whitehouse Station, NJ, 1996, p 1335. Back to text
32. Lide, D., R., CRC Handbook of Chemistry and Physics, CRC Press: Boca Raton, FL, 1992, p 7-21. Back to text
33. Lewis, R., J., Hawley's Condensed Chemical Dictionary, 12th ed., Van Nostrand Reinhold Co.: New York, 1993, p 1125. Back to text
34. Budavari, S., The Merck Index, 12th ed., Merck & Co. inc.: Whitehouse Station, NJ, 1996, p 1569. Back to text
35. Lide, D., R., CRC Handbook of Chemistry and Physics, CRC Press: Boca Raton, FL, 1992, p 7-14. Back to text
36. Burright, D.; Chan, Y.; Eide, M.; Elskamp, C.; Hendricks, W.; Rose, M. C. EVALUATION GUIDELINES FOR AIR SAMPLING METHODS UTILIZING CHROMATOGRAPHIC ANALYSIS; OSHA Salt Lake Technical Center, U.S. Department of Labor: Salt Lake City, UT, 1999. Back to text
Appendix 1
Samples were taken in the field following the sampling protocol for nuisance dust, 2 L/min for 960 liters. A retention study for the hormones was performed at this higher flow rate and air volume to see if there was any loss of sample.
Retention efficiency at 2 L/min and 960 liters
Six glass fiber filters were spiked with one of the analytes, allowed to equilibrate for 4 h, and then were placed into a three-piece cassette with another glass fiber filter, and with a spacer in-between the filters. The amounts spiked on the filters were 51.6 µg estradiol, 53.0 µg estriol, 55.5 µg estrone, 53.2 µg 17-a-methyltestosterone, 45.2 µg progesterone, and 52.2 µg testosterone. The cassettes had 960 L humid air (absolute humidity of 15.9 mg/L of water, about 80% relative humidity at 22.2°C) pulled through them at 2 L/min. The samples were extracted with methanol and analyzed by LC using the same column and conditions used for the other tests in this method. The mean retention efficiency was 98.8% estradiol, 95.3% estriol, 97.5% estrone, 98.5% 17-a-methyltestosterone, 97.8% progesterone, and 96.4% testosterone. There was 0% found on the backup glass fiber filter for all analytes.
|
Table A1 | |||||||
|
sample number | |||||||
|
section |
1 |
2 | 3 | 4 | 5 | 6 |
mean |
|
front |
98.1 |
99.1 |
98.7 |
97.7 |
99.2 |
99.8 |
98.8 |
|
Table A2 | |||||||
|
sample number | |||||||
|
section |
1 |
2 | 3 | 4 | 5 | 6 |
mean |
|
front |
94.1 |
94.4 |
95.9 |
95.8 |
95.9 |
95.7 |
95.3 |
|
Table A3 | |||||||
|
sample number | |||||||
|
section |
1 |
2 | 3 | 4 | 5 | 6 |
mean |
|
front |
94.6 |
96.8 |
97.2 |
98.9 |
97.8 |
99.6 |
97.5 |
|
Table A4 | |||||||
|
sample number | |||||||
|
section |
1 |
2 | 3 | 4 | 5 | 6 |
mean |
|
front |
99.8 |
96.7 |
96.6 |
99.7 |
99.6 |
98.7 |
98.5 |
|
Table A5 | |||||||
|
sample number | |||||||
|
section |
1 |
2 | 3 | 4 | 5 | 6 |
mean |
|
front |
97.4 |
97.9 |
96.8 |
97.8 |
99.4 |
97.6 |
97.8 |
|
Table A6 | |||||||
|
sample number | |||||||
|
section |
1 |
2 | 3 | 4 | 5 | 6 |
mean |
|
front |
96.3 |
95.2 |
96.9 |
97.5 |
97.1 |
95.4 |
96.4 |