| Method no.: | 66 |
| Matrix: | Air |
| Target concentration: | 10 ppm (30 mg/m3) (OSHA PEL) |
| Procedure: | Air samples are collected by drawing known volumes of air through sampling tubes containing coconut shell charcoal. Samples are desorbed with acetone and analyzed by gas chromatography using a nitrogen/phosphorus detector. |
| Recommended air volume and sampling rate: |
10 L at 0.2 L/min |
| Reliable quantitation limit: | 0.02 ppm (0.045 mg/m3) |
| Standard error of estimate at the target concentration: (Section 4.5.) |
7.4% |
| Status of method: | Evaluated method. This method has been subjected to the established evaluation procedures of the Organic Methods Evaluation Branch. |
| Date: August 1987 | Chemist: Michael Shulsky Laura Martin |
OSHA Analytical Laboratory
Salt Lake City, Utah
1. General Discussion
- 1.1. Background
- 1.1.1. History
This procedure was evaluated in order to overcome shortcomings in
the dimethylformamide (DMF) sampling and analytical method
previously used by OSHA. The previous method required the collection
of samples on silica gel, desorption with methanol, and analysis by
gas chromatography (GC) using a flame ionization detector (FID).
(Ref. 5.1.) The desorption efficiency of DMF from silica gel was low
and not constant for low sampler loadings. A
A procedure which required the collection of samples with charcoal, desorption with acetone and analysis by GC using a nitrogen/phosphorus detector (NPD) (Refs. 5.2 and 5.3.) was evaluated. Since the desorption efficiency of DMF from charcoal with acetone was 91% over the range of 0.02 to 2 times the PEL, valid analyses of lower sampler loadings are more easily attainable with this procedure.
1.1.2. Toxic effects (This section is for information only and should not be taken as the basis of OSHA policy.)
DMF is a moderately toxic compound which can cause liver damage. Occupational exposure normally results from inhalation or skin absorption. Symptoms of short-term exposure to DMF are abdominal distress, colicky abdominal pain, loss of appetite, nausea, vomiting, constipation, diarrhea, facial flushing (particularly after alcohol ingestion), agitation and increased blood pressure. Skin contact may cause irritation with the possibility of a rash upon prolonged or repeated contact (Ref. 5.4.). Eye contact produces temporary conjunctivitis and transient corneal damage in animals (Ref. 5.5.). The oral LD50 for rats is 3500 mg/kg, and the estimated lethal dose for humans is 10 g (Ref. 5.6.).
- Thirteen workers exposed to concentrations below 20 ppm and
occasionally to higher levels for up to 32 weeks complained of
nausea, vomiting, and colic; some cases of hepatomegaly were
detected. A worker who was splashed with the liquid over 20% of
his body surface initially suffered only dermal irritation and
hyperemia; abdominal pain began 62 hours after the exposure and
became progressively more severe with vomiting; the blood pressure
was elevated to 190/100; the effects gradually subsided and were
entirely abated by the seventh day after the exposure. (Ref.
5.4.)
1.1.3. Workplace exposure
In 1979, world production of DMF was 225,000 metric tons with nearly half of the total being produced in Europe. Approximately 48,000 tons were produced in the United States (Ref. 5.5.). No estimate vas found as to the number of workers exposed annually.
The physical and chemical properties of DMF allow it to be widely used as a solvent in many industrial, electrolytic and petroleum processes. It is used in the manufacture of resins, polymers, acrylic fibers and synthetic leathers. Salt solutions of DMF are used in electrolytic capacitors and electroplating baths. DMF, either pure or in solution, is used to extract aromatics from petroleum mixtures. DMF also finds uses as a paint stripper and cleaner for machinery, moldings, and gas pipelines. (Ref. 5.5.)
1.1.4. Physical properties (Ref. 5.4., unless otherwise stated)
| CAS no.: | 75-44-5 |
| molecular weight: | 73.1 |
| appearance: | colorless liquid |
| odor: | faint amine-like |
| melting point: | -61°C |
| boiling point at 1 atm: | 153°C |
| specific gravity: | 0.94 |
| vapor pressure at 20°C: | 360 Pa (2.7 mm Hg) |
| flash point: | 58°C (closed cup) |
| lower flammable limit: | 2.2% in air by volume |
| molecular formula: | C3H7NO |
| odor threshold: | 100 ppm |
| solubility: | miscible with water and most common organic solvents (Ref. 5.7.) |
| synonyms: | DMF, DMFA |
| incompatibilities: | oxidizers, alkylaluminums |
| molecular structure: | 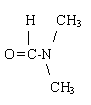 |
1.2. Limit defining parameters (The DMF air concentrations listed throughout this method are based on an air volume of 10 L and a solvent desorption volume of 1.0 mL. Air concentrations listed in ppm are referenced to 25°C and 760 mm Hg.)
- 1.2.1. Detection limit of the analytical procedure
The detection limit of the analytical procedure is 0.16 ng/injection. This is the amount of analyte which gave a peak whose height was about 5 times the baseline noise. (Section 4.1.)
1.2.2. Detection limit of the overall procedure
The detection limit of the overall procedure is 0.45 µg per sample (0.045 mg/m3, 0.02 ppm). This is the amount of analyte spiked on the sampling device which allows recovery of an amount equivalent to the detection limit of the analytical procedure. (Section 4.2.)
1.2.3. Reliable quantitation limit
The reliable quantitation limit is 0.45 µg per sample (0.045 mg/m3 or 0.02 ppm). This is the smallest amount of analyte which can be quantitated within the requirements of a recovery of at least 75% and a precision (±1.96 SD) of ±25% or better. (Section 4.3.)
| The reliable quantitation limit and detection limits reported in the method are based upon optimization of the instrument for the smallest possible amount of analyte. When the target concentration of an analyte is exceptionally higher than these limits, they may not be attainable at the routine operating parameters. |
1.2.4. Instrument response to the analyte
The instrument response over the concentration range of 0.5 to 2 times the target concentration is linear. (Section 4.4.)
1.2.5. Recovery
The recovery of DMF from charcoal tubes used in a 15-day storage test remained above 91% when the samples were stored at ambient temperatures. (Section 4.5.) The recovery of the analyte from the collection medium during storage must be 75% or greater.
1.2.6. Precision (analytical procedure)
The pooled coefficient of variation obtained from replicate determinations of analytical standards at 0.5, 1 and 2 times the target concentration is 0.030. (Section 4.6.)
1.2.7. Precision (overall procedure)
The precision at the 95% confidence level for the 15-day storage test at ambient temperature is ±14.5% (Section 4.7.). This includes an additional ±5% for sampling error. The overall procedure must provide results at the target concentration that are ±25% or better at the 95% confidence level.
1.2.8. Reproducibility
Six samples spiked by liquid injection and a draft copy of this procedure were given to a chemist unassociated with the evaluation. The samples were analyzed after 1 day of storage at ambient temperature. No individual sample result deviated from its theoretical value by more than the precision reported in Section 1.2.7. (Section 4.8.)
1.3. Advantages
- 1.3.1. The method provides high and constant desorption
efficiencies at low sampler loadings.
1.3.2. The samples may be analyzed more than once if necessary.
1.3.3. The NPD is selective and sensitive.
1.4. Disadvantage
The desorbing solvent and detector may preclude the simultaneous analysis of other analytes from the charcoal tubes without additional evaluation work.
2. Sampling Procedure
- 2.1. Apparatus
- 2.1.1. Samples are collected using a personal sampling pump that
can be calibrated to within ±5% of the recommended flow rate with
the sampling device in line.
2.1.2. The samples are collected with 20/40 mesh coconut shell
charcoal tubes, each containing a
2.2. Reagents
No sampling reagents are required.
2.3. Sampling technique
- 2.3.1. Open the charcoal tube immediately before sampling by
breaking off the ends. The openings should be at least one half the
diameter (i.d.) of the tube.
2.3.2. Connect the charcoal tube to the sampling pump with flexible tubing.
2.3.3. Place the charcoal tube in a vertical position to minimize channeling, with the backup section towards the pump.
2.3.4. Seal the charcoal tubes with plastic caps immediately after sampling. Seal each sample lengthwise with OSHA Form 21.
2.3.5. Submit at least one blank charcoal tube with each batch of samples. This charcoal tube should be subjected to exactly the same handling as the samples (break ends, seal, transport), except that no air should be drawn through it.
2.3.6. List potential interferences on the sample data sheet.
2.3.7. Transport the samples and corresponding paperwork to the lab.
2.3.8. Submit bulk samples in a separate container to prevent contamination of charcoal tube samples.
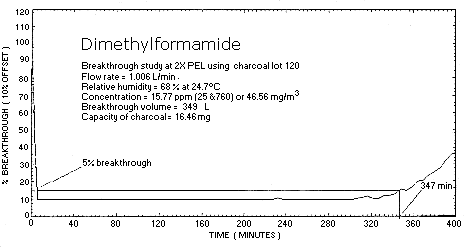
2.4. Sampler capacity
A breakthrough study was performed with a DMF test atmosphere at
approximately 46 mg/m3. The test atmosphere
had a relative humidity of 68% and was at ambient temperature. A
sampling rate of 1 L/min was used. The air volume sampled before 5%
breakthrough occurred was 349 L. The loading on the
2.5. Desorption efficiency
The average DE over the range of 0.5 to 2 times the target concentration is 91.7%. (Section 4.10.)
2.6. Recommended air volume and sampling rate
- 2.6.1. The recommended air volume is 10 L and the recommended
sampling rate is 0.2 L/min.
2.6.2. Although breakthrough data indicate a large air volume can
be sampled, a
2.6.3. When short-term (15 min) samples are required the
recommended sampling rate is 0.2 L/min. The reliable quantitation
limit (0.45 µg/sample) is equivalent to 0.05 ppm (0.15
mg/m3) for a
2.7. Interferences (sampling)
Suspected interferences should be reported to the laboratory with submitted samples.
2.8. Safety precautions
- 2.8.1. Wear eye protection when breaking off the ends of the
charcoal tubes.
2.8.2. Position the sampling device on the worker so as not to interfere with his/her work or safety.
2.8.3. Observe all safety regulations of the area in which sampling is performed.
3. Analytical Procedure
- 3.1. Apparatus
- 3.1.1. A gas chromatograph (GC) equipped with a
nitrogen/phosphorus detector (NPD). A
3.1.2. A GC column capable of separating the DMF from the
solvent, the internal standard and any listed interferences. A
3.1.3. An electronic integrator or other suitable means of
measuring detector response. A
3.1.4. Two-milliliter vials with Teflon-lined caps were used for sample desorption and standard preparation.
3.2. Reagents
- 3.2.1. DMF, reagent grade
3.2.2. Acetone, reagent grade
3.2.3. Propionitrile, reagent grade
3.2.4. Desorbing solution: Acetone containing 1 µL/mL propionitrile was used in this evaluation.
3.2.5. Hydrogen, GC grade
3.2.6. Air, GC grade
3.2.7. Helium or nitrogen, GC grade
3.3. Standard preparation
Prepare DMF standards in the desorbing solution. Standards should
be prepared in the range of from 0.015 to 0.3 µL/mL when sample air
volumes are 10 L. Sample concentrations should be bracketed with
standards because of possible
3.4. Sample preparation
- 3.4.1. Place the 100-mg portion of charcoal in one vial and the
3.4.2. Dispense 1.0 mL of the desorbing solution into each vial.
3.4.3. Immediately seal the vials with Teflon-lined caps and allow them to desorb for 1 h. Shake the vials by hand several times during the desorption period.
3.5. Analysis
- 3.5.1. GC conditions
| column temperature: | 170°C |
| injector temperature: | 200°C |
| detector temperature: | 250°C |
| nitrogen flow rate: | 26 mL/min |
| hydrogen flow rate: | 3 mL/min |
| air flow rate: | 65 mL/min |
| injection volume: | 0.40 µL |
| retention time: | 6.20 min |
3.5.2. Chromatogram See Figure 4.
3.5.3. An internal standard calibration method is preferable, since it corrects for injection size and slight changes in the NPD response.
3.5.4. Use a suitable method to measure detector response, such as electronic integration.
3.5.5. Bracket sample concentrations with standards.
3.6. Interferences
- 3.6.1. Any compound having a similar retention time as DMF or
the internal standard which gives an NPD response is a potential
interference.
3.6.2. GC parameters (temperature, column, etc.) may be changed to circumvent interferences.
3.7. Calculations
- 3.7.1. Prepare a calibration curve from the analytical standards
by plotting detector response versus the analytical standard
concentrations (in µg/mL).
3.7.2. Determine the concentration of DMF in the samples by using the calibration curve.
3.7.3. Add the amount of DMF found in the backup section of the tube to that found in the front section and subtract the amount found in the blank. The air concentration of DMF may then be calculated using the following equation:
mg/m3 = (A)(B) / (C)(D)
| where | A = µg DMF/mL desorption solvent B = desorption volume (1 mL) C = sample air volume (L) D = desorption efficiency (decimal form) |
The air concentration may also be expressed in ppm by volume at 760 mm Hg and 25°C with the following equation:
ppm = (E)(F) / (G)
| where | E = DMF concentration in
mg/m3 F = 24.46, the molar volume of an ideal gas at 760 mm Hg and 25°C G = 73.10, the molecular weight of DMF |
3.8. Safety precautions
- 3.8.1. Avoid skin contact and inhalation of all chemicals.
3.8.2. Restrict the use of all chemicals to a fume hood.
3.8.3. Wear safety glasses and a lab coat in all laboratory areas.
4. Backup Data
- 4.1. Detection limit of the analytical procedure
The detection limit of the analytical procedure was determined by injecting 0.40 µL of an analytical standard of 0.40 µg/mL (0.40 µg/mL × 0.40 µL = 0.16 ng/injection). This gave a peak whose height was approximately five times the baseline noise (Figure 4.1.).
4.2. Detection limit of the overall procedure
The detection limit of the overall procedure is 0.45 µg/sample (0.045 mg/m3 or 0.02 ppm). This is the amount of DMF which, when spiked on the sampling device, will allow recovery of an amount approximately equivalent to the detection limit of the analytical procedure (0.16 ng/injection or 0.40 µg/sample).
|
| ||
| sample number |
theoretical amount (µg) |
amount recovered (µg) |
|
| ||
| 1 | 0.4528 | 0.4528 |
| 2 | 0.4528 | 0.4057 |
| 3 | 0.4528 | 0.4333 |
| 4 | 0.4528 | 0.4664 |
| 5 | 0.4528 | 0.4338 |
| 6 | 0.4528 | 0.4247 |
|
| ||
4.3. Reliable quantitation limit
The reliable quantitation limit is that amount of DMF which, when spiked onto the sampling device, will allow recovery of at least 75% and have a precision (1.96 SD) of ±25% or better. The reliable quantitation limit is the same as the detection limit of the overall procedure in this evaluation (using the recommended injection size of 0.40 µL). The front sections of six SKC Lot 120 charcoal tubes were spiked with 8 µL of a 56.6 µg/mL solution of DMF in acetone, and stored in a laboratory refrigerator overnight. The tubes were desorbed with 1.0 mL of acetone containing 1 µL/mL propionitrile as an internal standard and analyzed.
|
| |||
| sample number |
percent recovered |
statistics | |
|
| |||
| 1 | 100. | 96.3% | |
| 2 | 89.6 | ||
| 3 | 95.7 | ||
| 4 | 103. | SD = | 4.7% |
| 5 | 95.8 | Precision = | (1.96)(±4.7%) |
| 6 | 93.8 | = | ±9.2% |
|
| |||
4.4. Instrument response to the analyte
The instrument response to the analyte over the range of 0.5 to 2 times the PEL is linear with a sensitivity of 3800 area counts per (µg/mL). (Table 4.4., Figure. 4.4.)
|
| |||
| × target conc. µg/mL |
0.5× 142 |
1× 283 |
2× 566 |
|
| |||
| area | 458500 | 1104000 | 2114000 |
| counts | 469400 | 1105000 | 2130000 |
| 482500 | 1105000 | 2140000 | |
| 497300 | 1100000 | 2150000 | |
| 507800 | 1103000 | 2159000 | |
| 514200 | 2159000 | ||
| 488283 | 1103400 | 2142000 | |
|
| |||
4.5. Storage Data
Thirty-three charcoal tubes were liquid spiked with a loading
equivalent to the PEL based on a
|
| ||||||||
| storage time | % recovery | |||||||
| (days) | (refrigerated) | (ambient) | ||||||
|
| ||||||||
| 0 | 93.2 | 90.9 | 96.4 | 93.2 | 90.9 | 96.4 | ||
| 4 | 91.0 | 95.1 | 93.6 | 92.4 | 92.4 | 93.0 | ||
| 6 | 92.2 | 92.2 | 85.0 | 91.2 | 91.9 | 91.2 | ||
| 9 | 89.3 | 99.7 | 94.7 | 89.2 | 91.1 | 93.3 | ||
| 13 | 89.0 | 94.7 | 92.4 | 89.6 | 90.9 | 90.9 | ||
| 16 | 84.0 | 89.7 | 86.1 | 92.7 | 91.6 | 92.7 | ||
|
| ||||||||
Storage samples were also collected from a dynamically generated
atmosphere of DMF at 71% relative humidity and 23°C. Thirty-six
charcoal tubes were used to sample this atmosphere.
Analysis of six vapor-generated samples on day zero yielded a
recovery of 65%, rather than 92% which would have been expected if the
only bias present was the desorption efficiency. The additional bias
was attributed to DMF loss in the vapor generating system; NIOSH
reported a similar finding (Ref. 5.8.). Therefore the theoretical
concentration of the DMF test atmosphere was considered to be
approximately 70% of the PEL. Since the
The precision of the overall procedure must be ±25% or better at
the 95% confidence level for samples collected at the target
concentration. The precision at the 95% confidence level for the
|
| |||||||
| storage time | % recovery | ||||||
| (days) | (refrigerated) | (ambient) | |||||
|
| |||||||
| 0 | 94 | 95 | 93 | 94 | 95 | 93 | |
| 90 | 93 | 91 | 90 | 93 | 91 | ||
| 3 | 99 | 108 | -- | 95 | -- | 93 | |
| 6 | 99 | 99 | 98 | 97 | 97 | 97 | |
| 9 | 94 | 94 | 91 | 85 | 77 | 90 | |
| 12 | 101 | 104 | 101 | 97 | 94 | 95 | |
| 15 | 116 | 99 | 99 | 95 | -- | 95 | |
|
| |||||||
4.6. Precision (analytical method only)
The precision of the analytical procedure is defined as the pooled
coefficient of variation determined from replicate injections of
analytical standards at 0.5, 1 and 2 times the target concentration.
Based on the data of Table 4.4., coefficients of variation (CV) for
the three levels and the pooled coefficient of variation (![]() ) are given in Table 4.6.
) are given in Table 4.6.
|
| |||
| × target conc. µg/sample |
0.5× 142 |
1× 283 |
2× 566 |
|
| |||
| SD (area counts) | 2.196 × 10⁴ | 2.074 × 10³ | 1.774 × 10⁴ |
| CV | 0.0450 | 0.0019 | 0.0083 |
|
| |||
4.7. Precision (overall procedure)
The precision of the overall procedure is determined from the storage data. The determination of the standard error of estimate for a regression line plotted through the graphed storage data, as in Figure 4.5.4., allows the inclusion of storage time as one of the factors affecting overall precision. The standard error of estimate (SEE) is similar to the standard deviation, except it is a measure of dispersion of data about a regression line instead of about a mean. It is determined with the following equation:
| where | |
| n = k = k = |
total no. of data points 2 for linear regression 3 for quadratic regression |
| Yobs = | observed % recovery at a given time |
| Yest = | estimated % recovery from the regression line at the same given time |
An additional 5% for pump error is added to the standard error of
estimate by the addition of variances. The precision at the 95%
confidence level is obtained by multiplying the standard error of
estimate (with pump error included) by 1.96 (the
4.8. Reproducibility
Six liquid-spiked samples and a draft copy of this procedure were given to a chemist unassociated with this evaluation. The samples were analyzed after 1 day of storage at ambient temperature.
|
| ||||
| sample no. |
theoretical amount (µg) |
amount found (µg) |
% found |
% deviation |
|
| ||||
| 1 | 302.2 | 294.0 | 97.3 | -2.7 |
| 2 | 234.2 | 235.3 | 100.5 | +0.5 |
| 3 | 136.0 | 134.7 | 99.0 | -1.0 |
| 4 | 302.2 | 295.5 | 97.8 | -2.2 |
| 5 | 136.0 | 127.6 | 93.8 | -6.2 |
| 6 | 234.2 | 225.6 | 96.3 | -3.7 |
|
Precision of the overall procedure (from Section 1.2.7.) is ±14.5%. DE for charcoal = 91.7% | ||||
4.9. Sampler Capacity
Analyte breakthrough in this evaluation was determined by sampling a dynamically generated test atmosphere at approximately twice the target level using only the front section of the sorbent tube.
Breakthrough is defined as the point at which the concentration of DMF in the atmosphere which has passed through the sorbent tube is 5% of the upstream concentration of the test atmosphere.
This initial study using the vapor generator indicated a discrepancy between the theoretical concentration of DMF and the experimentally determined concentration. This discrepancy was found when a charcoal tube that had been used to sample the atmosphere was analyzed. The experimentally determined concentration was only 70% of the theoretical concentration (Table 4.9.1.). As previously stated in Section 4.5., NIOSH mentions this type of problem in the backup data report for their dimethylformamide method (Ref. 5.8.). A further discussion of this is given in Section 4.11.
Before proceeding with the evaluation on charcoal, the effect of humidity on the capacity of the standard size silica gel tube was determined. The NIOSH method, which uses the silica gel tube, did not address the effects of humidity. The concentration of the test atmosphere was 46.22 mg/m3 as determined by the analysis of the front portion of a silica gel tube. Breakthrough was monitored downstream from the sampling tube with a gas chromatograph equipped with a gas sampling valve. DMF was introduced into the vapor generation system through a heated inlet at a rate of 9.36 mg/min. The test atmosphere was sampled at a rate of 1 L/min and an average relative humidity of 67% at 23°C.
The results of two capacity studies on silica gel yielded an average 5% breakthrough volume of 159 L. The capacity of silica gel for DMF is 7.36 mg (Table 4.9.2., Figure 4.9.2.). Examination of the capacity data indicates that silica gel is an adequate solid sorbent for collection of DMF even at the studied humidity.
The capacity of SKC, Inc. Lot 120 charcoal was tested using the same vapor generation system and delivery rate as in the silica gel studies. The concentration of the test atmosphere, generated at 68% relative humidity and 25°C, was found to be 46.56 mg/m3 as determined by the analysis of the front portion of a charcoal tube. At a sampling rate of 1 L/min the 5% breakthrough volume was found to be 349 L and the capacity of the charcoal for DMF 16.46 mg (Table 4.9.3., Figure 4.9.3.). Only one capacity study was performed since the breakthrough volume greatly exceeded the commonly used air volume of 10 L for charcoal. The capacity study indicates that charcoal is an effective collection medium for DMF.
|
| |||||
| theor.
conc. (mg/m3) |
air vol. (L) |
expected (mg) |
recovered (mg) |
DE corr. |
% recovered |
|
| |||||
| 61.05 | 255.9 | 15.62 | 10.10 | 11.00 | 70 |
|
DE for charcoal = 91.7% | |||||
|
| ||
| test | 5% breakthrough volume (L) |
capacity (mg) |
|
| ||
| 1 | 164.4 | 7.46 |
| 2 | 154.2 | 7.25 |
| 159.3 | 7.36 | |
|
| ||
|
| ||
| test | 5% breakthrough volume (L) |
capacity (mg) |
|
| ||
| 1 | 349.0 | 16.46 |
|
| ||
4.10. Desorption efficiency
The desorption efficiency was determined at 0.5, 1 and 2 times the
target concentration by injecting known amounts of solutions
containing DMF in acetone onto the
Desorption efficiencies at 0.1, 0.05 and 0.02 times the target
concentration were also determined to ensure that the desorption was
constant at lower analyte concentrations. Charcoal tubes at each of
the three levels were prepared by injecting known amounts of DMF in
acetone onto the
|
| |||||||
| 0.5× target conc. 142 µg spiked |
1× target conc. 283 µg spiked |
2× target conc. 566 µg spiked | |||||
| µg found | DE (%) | µg found | DE (%) | µg found | DE (%) | ||
|
| |||||||
| 133 | 93.7 | 249 | 88.0 | 530 | 93.6 | ||
| 133 | 93.7 | 249 | 88.0 | 528 | 93.3 | ||
| 133 | 93.7 | 261 | 92.2 | 526 | 92.9 | ||
| 131 | 92.2 | 254 | 89.7 | 524 | 92.6 | ||
| 128 | 90.1 | 260 | 91.9 | 510 | 90.1 | ||
| 132 | 93.0 | 252 | 89.0 | 514 | 90.8 | ||
| 260 | 91.9 | ||||||
| average | |||||||
| 132 | 92.7 | 255 | 90.1 | 522 | 92.2 | ||
| Average DE over the range of 0.5× to 2× target conc. is 91.7%. | |||||||
| 0.1× target conc. 28.3 µg spiked |
0.05× target conc. 14.2 µg spiked |
0.02× target conc. 5.66 µg spiked | |||||
| µg found | DE (%) | µg found | DE (%) | µg found | DE (%) | ||
|
| |||||||
| 24.4 | 86.2 | 12.4 | 87.3 | 5.49 | 96.9 | ||
| 24.6 | 86.9 | 12.5 | 88.0 | 5.48 | 96.8 | ||
| 24.6 | 86.9 | 12.7 | 89.4 | 5.21 | 92.0 | ||
| 24.8 | 87.6 | 12.4 | 87.3 | 5.57 | 98.4 | ||
| 24.8 | 87.6 | 12.8 | 90.1 | 5.37 | 94.9 | ||
| 28.0 | 98.9 | 11.4 | 80.3 | 5.12 | 90.4 | ||
| 25.0 | 88.3 | 12.5 | 88.0 | 4.90 | 86.6 | ||
| 27.4 | 96.8 | 11.8 | 83.1 | 4.53 | 80.0 | ||
| 26.0 | 91.9 | 11.7 | 82.4 | 4.59 | 81.1 | ||
| 11.4 | 80.3 | 5.98 | 106 | ||||
| average | |||||||
| 25.5 | 90.1 | 12.2 | 85.6 | 5.22 | 92.3 | ||
| Average DE over the range of 0.1× to 0.02× target conc. is 89.3%. | |||||||
|
| |||||||
4.11. Loss of DMF in the vapor generating system
A number of tests were performed to determine if the loss of DMF in the vapor generating system was due to sampling technique.
The syringe pump which was used to meter DMF into the vapor generating system was recalibrated. Initial and final calibrations were within 1%.
The calibration of the dilution air rotameters was checked and found to be accurate.
The glass-wool plug and the foam plug separating the front and back
sections of a
In order to determine if collection on charcoal was the problem,
two sets of
In order to determine if DMF losses in the vapor generating system were constant or concentration dependent, DMF test atmospheres at theoretical test concentrations of twice and ten times the PEL were studied. Three charcoal tubes were collected at a rate of 0.2 L/min for 25 min from a dry test atmosphere which was theoretically 10 times the PEL. These tubes were analyzed and the results compared with the data of Table 4.9.1. which was collected at twice the PEL. This comparison is shown in Table 4.11.5. and indicates that at both twice and ten times the PEL the recovery is about 70%. Therefore the loss does not appear to be concentration dependent. This work also indicated that pacification of the vapor generating system with high DMF concentrations prior to use would not alleviate the loss of DMF.
Humidity was not the cause of low results. Samples collected under
both
In conclusion, the reason for the discrepancy between the theoretical concentrations of DMF in the vapor generating system and experimentally determined concentrations could not be attributed to any of the parameters tested, including the sampling technique.
|
| ||||||
| media | test | air vol.(L) |
expected (µg) |
recovered (µg) |
DE corr. (µg) |
% recovery |
|
| ||||||
| charcoal | 1 | 48.8 | 1473 | 1046 | 1139 | 77 |
| bubbler | 1 | 44.4 | 1341 | 1076 | 1076 | 80 |
| silica gel | 1 | 52.0 | 1571 | 874 | 1053 | 67 |
| charcoal | 2 | 48.4 | 1462 | 1187 | 1293 | 88 |
| bubbler | 2 | 46.5 | 1405 | 1212 | 1212 | 86 |
| silica gel | 2 | 51.2 | 1547 | 973 | 1172 | 76 |
|
DE for charcoal = 91.7%. DE for silica gel = 83.0% | ||||||
|
| |||||
| theor.
conc. (mg/m3) |
air vol.(L) |
expected (mg) |
recovered (mg) |
DE corr. (mg) |
% recovery |
|
| |||||
| 61.05 | 255.9 | 15.62 | 10.10 | 10.98 | 70 |
| 318.0 | 5.26 | 1.673 | 1.060 | 1.152 | 69 |
| 318.0 | 4.96 | 1.577 | 0.993 | 1.079 | 68 |
| 318.0 | 5.21 | 1.657 | 1.121 | 1.218 | 74 |
|
DE for charcoal = 91.7% | |||||
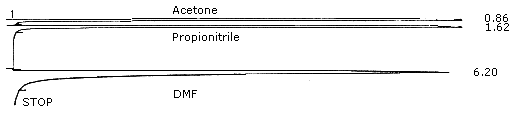
Figure 4.
Chromatogram of DMF. (283 µg/mL) For GC conditions see Section 3.5.1.
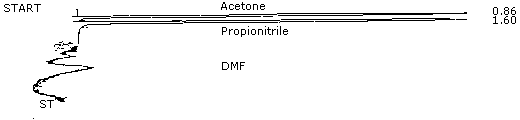
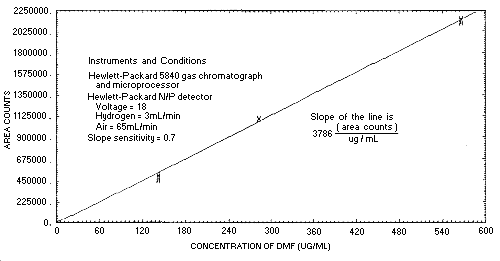
Figure 4.4. Instrument
response to DMF.
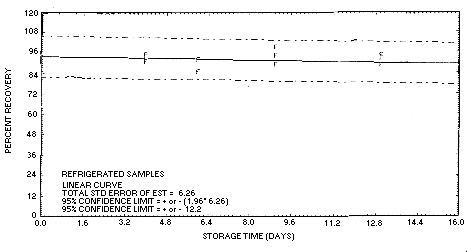
Figure 4.5.1. Storage test
at reduced temperature with liquid-spiked samples.
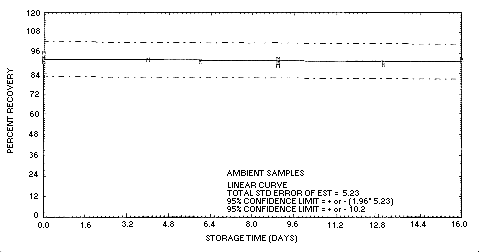
Figure 4.5.2. Storage test
at ambient temperature with liquid-spiked samples.
Figure 4.5.3. Storage test
at reduced temperature with samples collected from test atmosphere.
Figure 4.5.4. Storage test
at ambient temperature with samples collected from test atmosphere.
Figure 4.9.2 Breakthrough
study of DMF with silica gel tube.