PYRETHRUM
| Method no.: | 70 |
| Matrix: | Air |
| Target concentration: | 5.0 mg/m3 (OSHA PEL) |
| Procedure: | Samples are collected by drawing known volumes of air
through OSHA Versatile Sampler tubes containing a glass fiber filter
and two sections of |
| Recommended air volume and sampling rate: |
60 L at 1.0 L/min |
| Reliable quantitation limit: | 0.05 µg/m3 |
| Standard error of estimate at the target concentration: (Section 4.7.) |
6.53% |
| Status of method: | Evaluated method. This method has been subjected to the established evaluation procedures of the Organic Methods Evaluation Branch. |
| Date: March 1988 | Chemist: Donald Burright |
OSHA Analytical Laboratory
Salt Lake City, Utah
1. General Discussion
- 1.1. Background
- 1.1.1. History
This evaluation was undertaken to determine the effectiveness of
the OSHA Versatile Sampler containing
In the past, pyrethrum was collected on 37-mm glass fiber filters and the extracted samples were analyzed by HPLC with UV detection. (Ref. 5.4.) This current method specifies that the samples be analyzed by GC with an electron capture detector (ECD). The analytical detection limit for this procedure is three times lower than that of the HPLC procedure.
Pyrethrum is a naturally occurring insecticide found in the plant Chrysanthemum cinerariaefolium and its flowers. The active ingredients are pyrethrin I & II, cinerin I & II and jasmolin I & II. The dried flowers contain 0.9 to 1.3% pyrethrum. The crude extract contains 50-60% pyrethrum and is imported from several countries. The extract is diluted to 20%, which is the maximum concentration commercially available in the United States. Pyrethrum is oxidized on exposure to air, but has proven to be stable for long periods in water-based emulsions and in stabilized oil concentrates. (Ref. 5.5.) Synergistic compounds (such as piperonyl butoxide or N-octyl bicycloheptene dicarboximide), which enhance the effect of the pyrethrum on the insects, are present in the commercially available formulations of pyrethrum. (Ref. 5.6.)
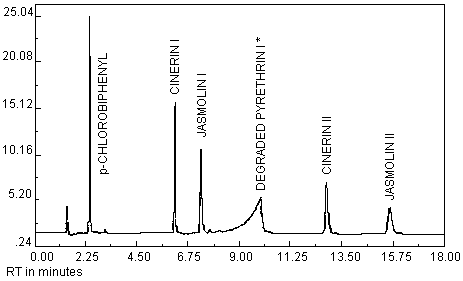
The analytical conditions in this procedure separate pyrethrum into six peaks. Pyrethrin I & II are thermally degraded by the GC and are not used for the quantitation of pyrethrum. The jasmolin II peak is very small and is not used either. The other three peaks (cinerin I & II and jasmolin I) are well resolved. The areas of these three peaks are summed and the total is used for the quantitation of pyrethrum samples. This type of analytical approach is valid as long as the ratio of the various constituents of pyrethrum remain fairly constant. The relative concentration of the constituents of pyrethrum samples from three different sources was found to vary by about 6%.
1.1.2. Toxic effects (This section is for information only and should not be taken as the basis of OSHA policy.)
The most common effect from skin exposure to pyrethrum, particularly on moist areas, is a rash. The rash may be associated with intense itching and blister formation. Hay fever-like symptoms, wheezing, and breathing difficulties may occur from exposure to pyrethrum by inhalation. An allergic reaction causing weakness and collapse may occur in sensitive individuals. Pyrethrum may irritate the eyes. (Ref. 5.7.)
1.1.3. Workplace exposure
Occupational exposure can occur during the formulation, distribution and application of pyrethrum. Because of its low toxicity, pyrethrum is used extensively in stock sprays, pet sprays, household sprays and aerosols, industrial sanitation sprays, and to protect stored food in warehouses. (Ref. 5.5.)
1.1.4. Physical properties and other descriptive information (Ref. 5.7. unless otherwise indicated)
| CAS no.: | 8003-34-7 |
| vapor pressure: | about 0 at 20°C |
| appearance: | viscous brown resin |
| specific gravity: | about 1 (water = 1) |
| flash point: (open cup) |
82-88°C |
| solubility: | practically insoluble in water; soluble in alcohol, petroleum ether, kerosene, carbon tetrachloride, ethylene dichloride, nitromethane (Ref. 5.8.) |
| trade names: | Buhach; Chrysanthemum Cinerariaefolium; Cinerin I & II; Dalmation Insect Flowers; Firmotox; Jasmolin I & II; NA 9184; Pyrethrin I & II; pyrethrins; Trieste Flowers (Ref. 5.9.) |
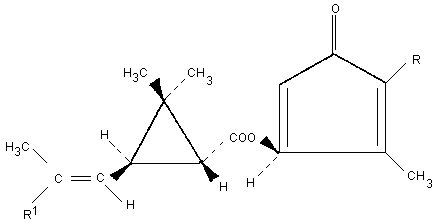
| structure: | Figure 1.1.4. |
The analyte air concentrations throughout this method are based on the recommended sampling and analytical parameters. All of the amounts listed below are for pyrethrum but the actual peaks analyzed were cinerin I & II and jasmolin I. The bulk material used in this evaluation was 20% pyrethrum.
- 1.2. Limit defining parameters
- 1.2.1. Detection limit of the analytical procedure
The detection limit of the analytical procedure is 0.014 ng per injection. This is the amount of analyte which gave a jasmolin I peak whose height is about 5 times the height of the baseline noise. (Section 4.1.)
1.2.2. Detection limit of the overall procedure
The detection limit of the overall procedure is 2.99 µg per sample (0.05 µg/m3). This is the amount of analyte spiked on the sampling device which allows recovery of an amount equivalent to the detection limit of the analytical procedure. (Section 4.2.)
1.2.3. Reliable quantitation limit
The reliable quantitation limit is 2.99 µg per sample (0.05 µg/m3). This is the smallest amount of analyte spiked on the sampling device which can be quantitated within the requirements of a recovery of at least 75% and a precision (±1.96 SD) of ±25% or better. (Section 4.3.)
The reliable quantitation limit and detection limits reported in the method are based upon optimization of the instrument for the smallest possible amount of the analyte. When the target concentration of the analyte is exceptionally higher than these limits, they may not be attainable at the routine operating parameters.
- 1.2.4. Instrument response to the analyte
The instrument response over the concentration range of 0.5 to 2 times the target concentration is linear. (Section 4.4.)
1.2.5. Recovery
The recovery of pyrethrum from samples (aerosol generated) used in a 15-day storage test remained above 95.9% when the samples were stored at about 22°C. (Section 4.5.) The recovery of an analyte from the collection medium during storage must be 75% or greater.
1.2.6. Precision (analytical procedure only)
The pooled coefficient of variation obtained from replicate determinations of analytical standards at 0.5, 1 and 2 times the target concentration is 0.015. (Section 4.6.)
1.2.7. Precision (overall procedure)
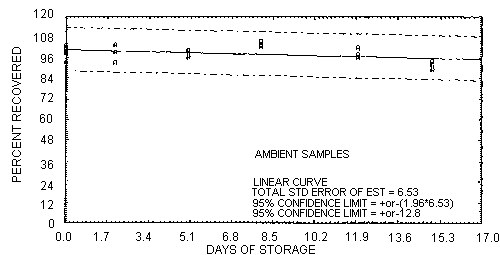
The precision at the 95% confidence level for the ambient 15-day storage test is ±12.8%. (Section 4.7.) This includes an additional ±5% for sampling error. The overall procedure must provide results at the target concentration that are ±25% or better at the 95% confidence level.
1.2.8. Reproducibility
Six samples, spiked by liquid injection with pyrethrum, and a draft copy of this procedure were given to a chemist unassociated with this evaluation. The samples were analyzed after two days of storage at about 21°C. No individual sample result deviated from its theoretical value by more than the precision reported in Section 1.2.7. (Section 4.8.)
1.3. Advantage
This sampling device can collect a variety of pesticides as aerosols and vapors without having to use two separate samplers in series.
1.4. Disadvantage
Currently the OVS-2 tube is not commercially available.
2. Sampling Procedure
- 2.1. Apparatus
- 2.1.1. Samples are collected by use of a personal sampling pump
that can be calibrated to within ±5% of the recommended flow rate
with the sampling device attached.
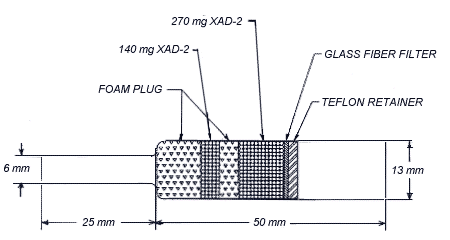
2.1.2. Samples are collected with glass OVS-2 tubes, which are
13-mm o.d. tubes that are tapered to 6-mm o.d. The tubes are packed
with a 140-mg back section and a 270-mg front section of cleaned
2.2. Reagents
No sampling reagents are required.
2.3. Sampling technique
- 2.3.1. Attach the small end of the sampling tube to the sampling
pump with flexible, plastic tubing such that the large front section
of the sampling tube is exposed directly to the atmosphere. Do not
place any tubing in front of the sampler. The sampler should be
attached vertically (large end down) in the worker's breathing zone
in such a manner that it does not impede work performance.
2.3.2. After sampling for the appropriate time, remove the sampling device and seal the tube with plastic end caps.
2.3.3. Wrap each sample end-to-end with an OSHA seal (Form 21).
2.3.4. With each set of samples submit at least one blank. Handle the blank in the same manner as the other samples except that no air is drawn through it.
2.4. Retention efficiency and sampler capacity
- 2.4.1. To test the sampler's ability to retain pyrethrum, the
target concentration of pyrethrum (301.2 µg) was
2.4.2. An aerosol of pyrethrum was generated (21.0 mg/m3 and <5% relative humidity) and the atmosphere was sampled for 150 min at 1 L/min with an OVS-2 tube. The "A" section contained 2.85 mg of pyrethrum and the "B" section contained 11.2 µg. This represented a breakthrough value of 0.4%. The amount of analyte on the tube was equivalent to a sample containing 9.5 times the PEL at the recommended air volume of 60 L. (Section 4.9.)
2.5. Extraction and desorption efficiencies (Section 4.10.)
- 2.5.1. The combined extraction/desorption efficiency for
pyrethrum from the glass fiber filter and the large
2.5.2. The extraction efficiency for pyrethrum from glass fiber filters at the target concentration was 99.0%.
2.5.3. The average desorption efficiency for pyrethrum from the
lot of cleaned
2.5.4. Extracted/desorbed samples remain stable for at least 24 h.
2.6. Recommended air volume and sampling rate
- 2.6.1. The recommended air volume is 60 L.
2.6.2. The recommended air sampling rate is 1.0 L/min.
2.6.3. When short-term air samples are required, the reliable quantitation limit is 0.2 mg/m3 for a 15-min sample collected at the recommended sampling rate.
2.7. Interferences (sampling)
Suspected interferences should be reported to the laboratory with submitted samples.
2.8. Safety precautions (sampling)
- 2.8.1. The sampling equipment should be attached to the worker
in such a manner that it will not interfere with work performance or
safety.
2.8.2. All safety practices that apply to the work area being sampled should be followed.
3. Analytical Procedure
- 3.1. Apparatus
- 3.1.1. A GC equipped with an electron capture detector. For this
evaluation a Hewlett-Packard 5890 Gas Chromatograph equipped with a
7673A Autosampler and a Nickel 63 ECD was used.
3.1.2. A GC column capable of separating the peaks of pyrethrum from potential interferences. A 30-m × 0.32-mm i.d. (1.0-µm film thickness) SPB-1 column (Supelco Inc., Bellefonte, PA) was used in this evaluation.
3.1.3. An electronic integrator or other suitable means of measuring detector response. A Hewlett-Packard 3357 computer was used in this evaluation.
3.1.4. Two- and four-milliliter vials with PTFE-lined caps were used for sample extraction/desorption and standard preparation.
3.2. Reagents
- 3.2.1. Pyrethrum. (Purified pyrethrum extract (20.0%) obtained
from two sources: Fairfield American Corp. and McLaughlin Gormley
King Co.)
3.2.2. Toluene, (American Burdick & Jackson).
3.2.3. p-Chlorobiphenyl, (ICN). This was used as the internal standard in the extracting/desorbing solution. The solution is prepared by adding 160 mg of p-chlorobiphenyl to 1 L of toluene.
3.3. Standard preparation
- 3.3.1. Prepare stock standards by adding toluene to preweighed
amounts of pyrethrum. Include the percent purity in the calculation.
3.3.2. Prepare analytical standards by injecting microliter amounts of diluted pyrethrum stock standards into vials containing 4.0 mL of extracting/desorbing solution.
3.4. Sample preparation
- 3.4.1. Transfer the glass fiber filter and the 270-mg section of
the sampling tube to a 4-mL glass vial. Place the first foam plug
and the 140-mg section in a separate vial. A small glass funnel can
be used to transfer the adsorbent. Discard the rear foam plug. Do
not discard the glass sampling tube; it can be reused after cleaning
with surfactant or suitable solvent.
3.4.2. Add 4.0 mL of extracting/desorbing solution to each vial.
3.4.3. Seal the vials with PTFE-lined caps and allow them to extract/desorb for 1 h. Shake the vials vigorously by hand several times during the extraction/desorption time.
3.4.4. If necessary, transfer some of the solution from each of the 4-mL vials to smaller glass vials suitable for an autosampler.
3.5. Analysis
- 3.5.1. Analytical conditions
| temperatures: | 250°C (column) 250°C (injector) 300°C (detector) |
| column gas flow: | 1.2 mL/min (hydrogen) |
| make-up gas flow: | 60 mL/min (nitrogen) |
| injection size: | 1.0 µL |
| injection split: | 55 to 1 |
| column: | SPB-l, 1.0-µm film thickness, 30 m × 0.32-mm i.d. fused silica (Supelco Inc.) |
| retention times: (min) |
2.38 (p-chlorobiphenyl) 16 (cinerin I) 7.31 (jasmolin I) 12.83 (cinerin II) |
| chromatogram: | Figure 3.5.1. |
3.5.2. Measure detector response using a suitable method such as electronic integration.
3.5.3. Use an internal standard procedure to prepare a calibration curve using several solutions over a range of concentrations. Prepare the calibration curve daily. Bracket the samples with analytical standards.
3.6. Interferences (analytical)
- 3.6.1. Any compound having a similar retention time as the
analyte is a potential interference. Generally, chromatographic
conditions can be altered to separate an interference from the
analyte.
3.6.2. Retention time on a single column is not proof of chemical identity. Analysis by an alternate GC column and confirmation by mass spectrometry are additional means of identification.
3.7. Calculations
- 3.7.1. Prepare calibration curves from analytical standards by
plotting detector response for pyrethrum (the summed response for
the cinerin I & II and jasmolin I peaks) versus the analytical
standard concentrations (in terms of micrograms pyrethrum per
milliliter). Determine the best-fit line through the data points.
3.7.2. Determine the concentration, in micrograms of pyrethrum per milliliter, of a sample by comparing its detector response (the summed response for the cinerin I & II and jasmolin I peaks) to the calibration curve. Perform blank corrections for each section before adding the results together. Add the amount of pyrethrum on the backup section to the amount found on the front section.
3.7.3. The air concentration of pyrethrum can be expressed in mg/m3 by using the following equation:
mg/m3 = (A)(B)/(C)(D)
| where | A | = | µg/mL of pyrethrum from Section 3.7.2. |
| B | = | extraction/desorption volume in milliliters | |
| C | = | liters of air sampled | |
| D | = | combined extraction/desorption efficiency (decimal) |
The combined extraction/desorption efficiency should be determined for the particular batch of resin and lot of filter used for the sample.
3.8. Safety precautions (analytical)
- 3.8.1. Avoid skin contact and inhalation of all chemicals.
3.8.2. Restrict the use of all chemicals to a fume hood.
3.8.3. Wear safety glasses in all laboratory areas.
4. Backup Data
- 4.1. Detection limit of the analytical procedure
The detection limit of the analytical procedure, 0.014 ng per injection, is based on a 1.0-µL injection of a 0.748 ng/µL standard with a 55 to 1 split ratio. This amount produced a jasmolin I peak whose height is about 5 times the height of the baseline noise. A chromatogram of the detection limit of the analytical procedure is shown in Figure 4.1.
4.2. Detection limit of the overall procedure
The detection limit of the overall procedure is 2.99 µg per sample
(0.05 mg/m3). The injection size recommended
in the analytical procedure (1.0 µL) was used in the determination of
the detection limit of the overall procedure. Ten samples containing a
glass fiber filter and 270 mg of
Detection Limit of the Overall Procedure
|
| ||
| sample | theoretical amount | amount recovered |
| number | (µg) | (µg) |
|
| ||
| 1 | 2.99 | 3.06 |
| 2 | 2.99 | 3.04 |
| 3 | 2.99 | 3.16 |
| 4 | 2.99 | 3.04 |
| 5 | 2.99 | 2.91 |
| 6 | 2.99 | 3.10 |
| 7 | 2.99 | 2.92 |
| 8 | 2.99 | 2.97 |
| 9 | 2.99 | 2.93 |
| 10 | 2.99 | 3.00 |
|
| ||
4.3. Reliable quantitation limit data
The reliable quantitation limit is 2.99 µg per sample (0.05
mg/m3). The injection size recommended in
the analytical procedure (1.0 µL) was used in the determination of the
reliable quantitation limit. Ten samples containing a glass fiber
filter and 270 mg of
Reliable Quantitation Limit
(Based on samples and data of Table 4.2.)
|
| ||||
| sample | percent | statistics | ||
| number | recovered | |||
|
| ||||
| 1 | 102.3 | |||
| 2 | 101.7 | |||
| 3 | 105.7 | = | 100.8 | |
| 4 | 101.7 | SD | = | 2.8 |
| 5 | 97.3 | Precision | = | ±(1.96)(2.8) |
| 6 | 103.7 | = | ±5.5 | |
| 7 | 97.7 | |||
| 8 | 99.3 | |||
| 9 | 98.0 | |||
| 10 | 100.3 | |||
|
| ||||
4.4. Instrument response to pyrethrum
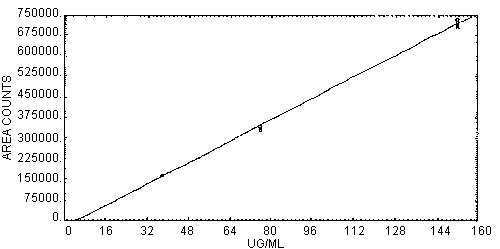
The instrument response to pyrethrum over the range of 0.5 to 2 times the target concentration is linear with a slope of 4900 area counts per µg/mL. The response to pyrethrum was determined by multiple injections of pyrethrum standards and summing the area counts for the peaks of cinerin I & II and jasmolin I. The data listed below is presented graphically in Figure 4.4.
Instrument Response to Pyrethrum
|
| |||
| × PEL | 0.5× | 1× | 2× |
| µg/sample | 151.5 | 303 | 606 |
|
| |||
| area counts | 167574 | 346643 | 707344 |
| 166649 | 346771 | 735923 | |
| 167471 | 347150 | 706650 | |
| 166401 | 340248 | 712773 | |
| 167019 | 334086 | 736900 | |
| 166486 | 331437 | 723730 | |
| 167319 | 333166 | 720375 | |
| 166633 | 333148 | 724077 | |
| 166944 | 339081 | 720972 | |
|
| |||
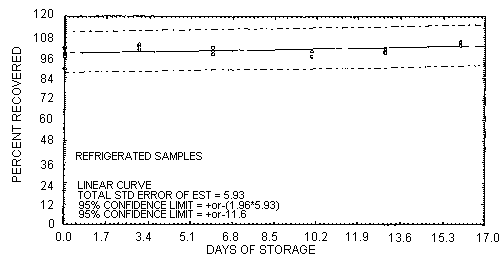
4.5. Storage data
- 4.5.1. Storage samples were generated by liquid-spiking 36
sampling tubes with 301.2 µg of pyrethrum and then pulling 30 L of
humid air (about 82% relative humidity) through them.
Storage Test (Liquid Spiked)
|
| ||||||
| storage time | % recovery | |||||
| (days) | (ambient) | (refrigerated) | ||||
|
| ||||||
| 0 | 102.4 | 99.0 | 97.9 | 102.4 | 99.0 | 97.9 |
| 96.9 | 101.7 | 90.2 | 96.9 | 101.7 | 90.2 | |
| 3 | 99.7 | 99.5 | 101.3 | 102.8 | 104.2 | 101.1 |
| 6 | 97.8 | 97.7 | 99.6 | 100.6 | 98.3 | 102.6 |
| 10 | 105.9 | 99.2 | 102.8 | 97.4 | 100.5 | 97.8 |
| 13 | 96.3 | 97.4 | 98.5 | 102.0 | 101.1 | 99.6 |
| 16 | 96.1 | 100.8 | 100.2 | 105.1 | 105.9 | 103.7 |
|
| ||||||
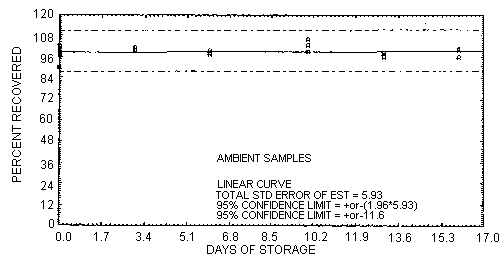
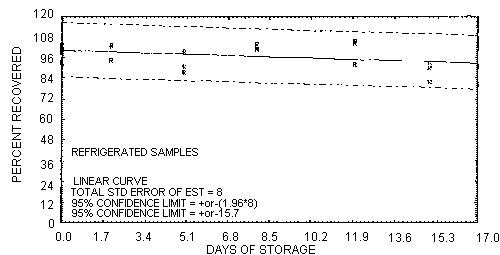
4.5.2. Another storage test was performed by sampling a dynamically generated aerosol test atmosphere (16.54 mg/m3 and about 81% relative humidity) of pyrethrum. Six sets of six samples (thirty-six samples total) were collected in the aerosol chamber at 1 L/min for 30 min. One half of the sets was stored at -14°C and the other half was stored at ambient temperature in a closed drawer. At 2-, 3- or 4-day intervals, one sample was selected from each of the six storage sets and was analyzed. The average value of the Day 0 samples was 496.2 µg/sample. All results were normalized to the average of the Day 0 samples. The normalized results are listed below and shown graphically in Figures 4.5.2.1. and 4.5.2.2.
Storage Test (Dynamic Atmosphere)
|
| ||||||
| storage time | % recovery | |||||
| (days) | (ambient) | (refrigerated) | ||||
|
| ||||||
| 0 | 102.9 | 93.3 | 103.1 | 102.9 | 93.3 | 103.1 |
| 100.7 | 101.2 | 98.8 | 100.7 | 101.2 | 98.8 | |
| 2 | 103.1 | 93.3 | 99.2 | 94.6 | 102.9 | 103.1 |
| 5 | 96.7 | 97.9 | 100.6 | 91.1 | 87.4 | 99.6 |
| 8 | 105.6 | 103.3 | 102.7 | 101.7 | 103.7 | 100.9 |
| 12 | 102.1 | 96.7 | 98.0 | 92.1 | 104.4 | 105.6 |
| 15 | 88.9 | 94.2 | 91.6 | 81.6 | 89.8 | 93.0 |
|
| ||||||
4.6. Precision (analytical method only)
The precision of the analytical procedure is defined as the pooled coefficient of variation determined from replicate injections of pyrethrum standards at 0.5, 1 and 2 times the PEL by using the summed area counts for the peaks of cinerin I & II and jasmolin I. Based on the data of Table 4.4., the coefficients of variation (CV) for the three levels and the pooled coefficient of variation (CV) are given below.
Precision of the Analytical Method
(Based on the Data of Table 4.4.)
|
| |||
| × PEL | 0.5× | 1× | 2× |
| µg/sample | 151.5 | 303 | 606 |
|
| |||
| SD* | 464 | 6932 | 11667 |
| CV | 0.0028 | 0.0204 | 0.0162 |
|
| |||
| * standard deviation in area counts | |||
4.7. Precision (overall procedure)
The precision of the overall procedure is determined from the storage data. The determination of the standard error of estimate (SEE) for a regression line plotted through the graphed storage data allows the inclusion of storage time as one of the factors affecting overall precision. The SEE is similar to the standard deviation, except it is a measure of dispersion of data about a regression line instead of about a mean. It is determined with the following equation:

| where | ||
| n | = | total no. of data points |
| k | = | 2 for a linear regression |
| k | = | 3 for a quadratic regression |
| Yobs | = | observed % recovery at a given time |
| Yest | = | estimated % recovery from the regression line at the same given time |
An additional 5% for pump error is added to the SEE by the addition
of variances. The precision at the 95% confidence level is obtained by
multiplying the SEE (with pump error included) by 1.96 (the
4.8. Reproducibility data
Six samples,
Reproducibility Data
|
| ||||
| sample | µg spiked | µg recovered | % recovered | % deviation |
|
| ||||
| 1 | 301.2 | 325.5 | 108.1 | +8.1 |
| 2 | 301.2 | 300.2 | 99.7 | -0.3 |
| 3 | 301.2 | 313.1 | 103.9 | +3.9 |
| 4 | 451.8 | 437.3 | 96.8 | -3.2 |
| 5 | 451.8 | 442.0 | 97.8 | -2.2 |
| 6 | 451.8 | 488.9 | 108.2 | +8.2 |
|
| ||||
4.9. Sampler capacity and retention efficiency
- 4.9.1. To check the capacity of the OVS-2 tube for pyrethrum, an
atmosphere containing an aerosol (21.0
mg/m3 and <5% relative humidity) of
pyrethrum was generated. Samplers were placed in the test chamber
and the aerosol was sampled for varying lengths of time. The sample,
which had 150 L of test atmosphere pulled through it, collected 2.86
mg of pyrethrum (9.5 times the PEL) on the sampling tube and less
than 1% was found on the back section.
The amount of pyrethrum found on the "B" sections of all nine sampling tubes was fairly constant throughout this test and is probably due to the aerosol coating the inside of the glass tube with pyrethrum. This thin coating could contaminate the foam plug of the "B" section when it is removed from the tube and give the appearance of breakthrough when none had occurred.
The recommended air volume of 60 L was chosen because the amount of material (pyrethrum and other materials) collected on the filter after a long sampling time might clog the sampler.
Capacity of the OVS-2 Tube for Pyrethrum
|
| ||||
| volume | "A" section | "B" section | total | % on "B" |
| (L) | (µg) | (µg) | (µg) | |
|
| ||||
| 15 | 291 | 10.0 | 301 | 3.3 |
| 30.3 | 644 | 9.6 | 654 | 1.5 |
| 45.5 | 972 | 14.7 | 987 | 1.5 |
| 76.5 | 1786 | 12.6 | 1799 | 0.7 |
| 90.9 | 2044 | 21.0 | 2065 | 1.0 |
| 106.5 | 2032 | 15.5 | 2047 | 0.8 |
| 120 | 2418 | 13.7 | 2432 | 0.6 |
| 135 | 2753 | 25.5 | 2778 | 0.9 |
| 150 | 2850 | 11.2 | 2861 | 0.4 |
|
| ||||
4.9.2. To test the ability of the sampler to retain the analytes,
eight samplers were
Retention of Pyrethrum
|
| ||
| µg recovered | % recovered | |
|
| ||
| 306.8 | 101.8 | |
| 309.3 | 102.7 | |
| 304.6 | 101.1 | |
| 308.6 | 102.4 | |
| 308.7 | 102.5 | |
| 306.5 | 101.8 | |
| 311.4 | 103.4 | |
| 307.2 | 102.0 | |
| 307.9 | 102.2 | |
|
| ||
4.10. Extraction and desorption efficiencies
- 4.10.1. Extraction from glass fiber filter
The extraction efficiency of pyrethrum was determined by liquid-spiking six glass fiber filters with pyrethrum at the target concentration (303 µg/sample). These samples were stored overnight and then extracted with toluene and analyzed.
Extraction Efficiency of Pyrethrum
(1× Target Concentration)
|
| |
| sample number | % recovered |
|
| |
| 1 | 105.7 |
| 2 | 99.4 |
| 3 | 99.3 |
| 4 | 96.0 |
| 5 | 98.9 |
| 6 | 94.8 |
| 99.0 | |
|
| |
4.10.2. Desorption from
The desorption efficiency of pyrethrum was determined by
liquid-spiking 270-mg portions of
Desorption Efficiency of Pyrethrum
|
| |||
| × PEL | 0.5× | 1× | 2× |
| µg/sample | 151.5 | 303 | 606 |
|
| |||
| desorption | 102.9 | 102.6 | 98.2 |
| efficiency, % | 103.1 | 102.2 | 97.4 |
| 103.8 | 104.6 | 98.4 | |
| 102.4 | 101.2 | 97.1 | |
| 99.4 | 96.7 | 97.4 | |
| 99.7 | 96.6 | 97.6 | |
| 101.9 | 100.7 | 97.7 | |
|
| |||
| The average desorption efficiency over the studied range was 100.1%. | |||
4.10.3. Combined extraction/desorption efficiency
The combined extraction/desorption efficiency of pyrethrum was
determined by liquid-spiking glass fiber filters with the target
concentration and placing the filter and the large section of
Stability of Extracted/Desorbed Samples (%)
|
| ||
| original | 24 h later | |
|
| ||
| 99.7 | 106.7 | |
| 101.6 | 103.8 | |
| 102.0 | 103.2 | |
| 107.5 | 103.8 | |
| 102.8 | 102.1 | |
| 106.8 | 102.5 | |
| 103.4 | 103.7 | |
| % of original = | 100.3 | |
|
| ||
4.11. Preparing the OVS tube
It is anticipated that this glass sampling tube can be used to collect a broad range of airborne contaminants when packed with various adsorbents. Therefore, the suffix will reflect the type of adsorbent contained in the sampler. For example, a sampler containing Tenax will be designated OVS-T and one containing XAD-7 will be called OVS-7.
- 4.11.1. Apparatus
- 4.11.1.1. Soxhlet extractor
4.11.1.2. Rotary evaporator
4.11.1.3. Miscellaneous glassware: vacuum flask, 2-L round-bottom flask, Erlenmeyer flask, 250-mL Buchner funnel with course fritted disc, etc.
4.11.1.4. Urethane foam plugs, 3/8 in. × 1/2-in. diameter and 3/16 in. × 1/2-in. diameter.
4.11.1.5. Glass fiber filters, 1/2-in. or 13-mm diameter.
4.11.1.6. PTFE retainer. The retainer is made by removing a 50E arc from a piece of PTFE tubing, 1/8 in. × 1/2-in. o.d. × 3/8-in. i.d.
4.11.1.7. Glass sampling tube. The sampling tube is constructed
from two pieces of borosilicate glass tubing that have been joined
together by a glass blower. One of the pieces is 50 mm × 13-mm
o.d. × 11-mm i.d. The other piece is 25 mm × 6-mm o.d. ×
4.11.1.8. Plastic cap, 7/8 in. × 1/2-in. i.d. (Alliance Plastics, Inc., Erie PA).
4.11.1.9. Plastic cap, 3/4 in. × 7/32-in. i.d. (SKC, Inc., Eighty-Four, PA).
4.11.2. Reagents
- 4.11.2.1. Toluene, HPLC grade.
4.11.2.2. Methanol, HPLC grade.
4.11.2.3. Acetonitrile, HPLC grade.
4.11.2.4. Amberlite
4.11.3. Cleaning the
Add 500 g of crude
4.11.4. Assembly of the OVS-2 tube
Place a large foam plug in the bottom of the large end of the
glass tube. Add 140 mg of cleaned
| compound | CAS no. | R1 | R |
|
|
|
|
|
| pyrethrin I | [121-21-1] | CH3 | CH2CH=CHCH=CH2 |
| pyrethrin II | [121-29-9] | COOCH3 | CH2CH=CHCH=CH2 |
| cinerin I | [25402-06-6] | CH3 | CH2CH=CHCH3 |
| cinerin II | [121-20-0] | COOCH3 | CH2CH=CHCH3 |
| jasmolin I | [4466-14-2] | CH3 | CH2CH=CHCH2CH3 |
| jasmolin II (Ref. 5.10.) |
[1172-63-0] | COOCH3 | CH2CH=CHCH2CH3 |
* Based on GC/MS data.
* Based on GC/MS data.
slope = 4900 area counts per microgram per milliliter.
5. References
- 5.1. Burright, D. Method #62, "Chlorpyrifos,
DDVP, Diazinon, Malathion, and Parathion", OSHA Analytical Laboratory,
unpublished, Salt Lake City, 1986.
5.2. Burright, D. Method #63, "Carbaryl (Sevin)", OSHA Analytical Laboratory, unpublished, Salt Lake City, 1987.
5.3. Burright, D. Method #67, "Chlordane", OSHA Analytical Laboratory, unpublished, Salt Lake City, 1987.
5.4. "NIOSH Manual of Analytical Methods", 3rd ed.; U.S. Department of Health and Human Services, Centers for Disease Control, NIOSH: Cincinnati, OH, Feb. 1984; Vol. 2, Method 5008, Publ. No. 84-100.
5.5. Meister, R.T., Ed. "Farm Chemical Handbook '85", 71st ed.; Meister Publishing: Willoughby, OH, 1985.
5.6. Metcalf, R. L. in "Kirk-Othmer Encyclopedia of Chemical Technology"; 3rd ed.; Grayson, M., Ed.; John Wiley & Sons, New York, 1978, pp. 424-425.
5.7. "Occupational Health Guidelines for Chemical Hazards", NIOSH/OSHA, Jan. 1981, DHHS(NIOSH) Publ. No. 81-123.
5.8. Windholz M., Ed. "Merck Index", 10th ed.; Merck and Co.: Rahway, NJ, 1983.
5.9. NIOSH Registry of Toxic Effects, RTECS Online Database available through National Library of Medicine, Bethesda, MD.
5.10. "Documentation of the Threshold Limits Values and Biological Exposure Indices", 5th ed.; American Conference of Governmental Industrial Hygienists: Cincinnati, OH, 1986; p. 506.
