![]()
| Method no.: | 94 |
| Matrix: | Air |
| Target concentrations: | 100 ppm (410 mg/m3) |
| Procedure: | Samples are collected by drawing air through glass sampling
tubes containing coconut shell charcoal coated with
|
| Recommended air volume and sampling rate: |
3 L at 0.05 L/min |
| Reliable quantitation limit: | 151 ppb (617 µg/m3) |
| Standard errors of estimate at the target concentration: |
5.85% |
| Special requirements: | Samples should be stored at reduced temperature when not in transit. |
| Status of method: | Evaluated method. This method has been subjected to the established evaluation procedures of the Organic Methods Evaluation Branch. |
| Date: June 1992 | Chemist: Donald Burright |
OSHA Salt Lake Technical Center
Salt Lake City, UT 84165-0200
1. General Discussion
- 1.1. Background
- 1.1.1. History
The OSHA Salt Lake Technical Center has in the past used NIOSH
Method 2537 for the sampling and analysis of methyl methacrylate
(MME) (Ref.
5.1.). The NIOSH method specified collection using a jumbo
1.1.2. Toxic effects (This section is for information only and should not be taken as the basis of OSHA policy.)
The vapor of MME can irritate the nose and throat at air concentrations of about 170 ppm. Concentrations above 2000 ppm are intolerable. High concentrations of vapor may cause headache, drowsiness, dizziness, difficulty in breathing, and at very high levels, loss of consciousness. Death by pulmonary edema has occurred. (Ref. 5.5.)
Vapor concentrations above 170 ppm will irritate the eyes and may generate tearing. Liquid can cause considerable irritation or burns to the eyes. Skin contact with liquid MME may produce irritation or burns. Allergic skin sensitization can occur over time. Sensitized persons may have a severe reaction to low doses which do not affect unsensitized persons. Ingestion of MME irritates the mouth and stomach; causes nausea, vomiting, dizziness and drowsiness; and may produce liver and kidney damage. (Ref. 5.5.)
The International Agency for Research on Cancer reports that there is inadequate data to support evidence for carcinogenicity of MME in humans or animals. (Ref. 5.6.)
In the Code of Federal Regulations, the final rule limits in
Table
1.1.3. Workplace exposure
In 1979, 307 million kilograms of MME were produced in the United States (Ref. 5.8.). MME is used in the manufacture of acrylic plastics (Lucite and Plexiglass), latex house paints, building materials, automobile parts, lubricating oil additives, polishes and coatings, adhesives, sealants, dental implants, hard contact lenses, bone cement, bone replacements (artificial hips), corneal implants, and ultraviolet cured inks in the printing industry. (Ref. 5.5.)
1.1.4. Physical properties and other descriptive information (Ref. 5.5.)
| CAS no.: | 80-62-6 |
| molecular weight: | 100.12 |
| melting point: | -48°C |
| boiling point: | 100°C |
| chemical formula: | C5H8O2 |
| vapor pressure: (at 20°C) |
4.67 kPa (35 mmHg) |
| density: (at 20°C) |
0.936 g/mL |
| self-ignition temperature: | 421°C |
| flash point: (open cup) |
10°C |
| lower explosive limit: | 1.7% |
| upper explosive limit: | 8.2% |
| odor threshold: | <1 ppb |
| solubility: | slightly soluble in water; soluble in most organic solvents |
| synonyms: | methylacrylic acid, methyl ester; methyl
|
| structure: |  |
The analyte air concentrations throughout this method are based on the recommended sampling and analytical parameters. Air concentrations listed in ppm and ppb are referenced to 25°C and 101.3 kPa (760 mmHg).
1.2. Limit-defining parameters
- 1.2.1. Detection limit of the analytical procedure
The detection limit of the analytical procedure is 0.343 ng per
injection
1.2.2. Detection limit of the overall procedure
The detection limit of the overall procedure is 1.852 µg per sample. This is the amount of analyte spiked on the sampling device that, upon analysis, produces a peak similar in size to that of the detection limit of the analytical procedure. This detection limit corresponds to an air concentration of 151 ppb (617 µg/m3). (Section 4.2.)
1.2.3. Reliable quantitation limit
The reliable quantitation limit is 1.852 µg per sample. This is the smallest amount of analyte which can be quantitated within the requirements of a recovery of at least 75% and a precision (±1.96 SD) of ±25% or better. This reliable quantitation limit corresponds to an air concentration of 151 ppb (617 µg/m3). (Section 4.3.)
The reliable quantitation limit and detection limits reported in the method are based upon optimization of the instrument for the smallest possible amount of analyte. When the target concentration of analyte is exceptionally higher than these limits, they may not be attainable at the routine operating parameters.
1.2.4. Instrument response to the analyte
The instrument response over a concentration range representing 0.5 to 2 times the target concentration is linear. (Section 4.4.)
1.2.5. Recovery
The recovery of MME from samples used in the 15-day ambient storage test remained above 83.4%. (Section 4.5., regression line of Figure 4.5.1.)
1.2.6. Precision (analytical procedure)
The pooled coefficient of variation obtained from replicate determinations of analytical standards at 0.5, 1 and 2 times the target concentration is 0.0041. (Section 4.6.)
1.2.7. Precision (overall procedure)
The precision at the 95% confidence level for the 15-day ambient temperature storage test is ±11.5%. (Section 4.7.) This includes an additional ±5% for sampling error.
1.2.8. Reproducibility
Six samples, liquid-spiked with MME, and a draft copy of this procedure were given to a chemist unassociated with this evaluation. The samples were analyzed after 7 days of storage at 2°C. No individual sample result deviated from its theoretical value by more than the precision reported in Section 1.2.7. (Section 4.8.)
1.3. Advantages
- 1.3.1. The sampling device is smaller and more conveniently
sized than the large
1.3.2. The sampler may be shipped at ambient temperatures. The
large
2. Sampling Procedure
- 2.1. Apparatus
- 2.1.1. Samples are collected using a personal sampling pump that
can be calibrated within ±5% of the recommended flow rate with the
sampling device attached.
2.1.2. Samples are collected with 4-mm i.d. × 6-mm o.d. × 7.0 cm
glass sampling tubes packed with two sections of coconut shell
charcoal that has been coated with TBC, 10% by weight. The front
section contains 110 mg and the back section contains 55 mg of
2.2. Reagents
No sampling reagents are required.
2.3. Technique
- 2.3.1. Immediately before sampling, break off the ends of the
TBC-coated coconut shell charcoal tube. All tubes should be from the
same lot.
2.3.2. Attach the sampling tube to the sampling pump with
flexible tubing. It is desirable to utilize sampling tube holders
which have a protective cover to shield the employee from the sharp,
jagged end of the sampling tube. Position the tube so that sampled
air passes through the
2.3.3. Air being sampled should not pass through any hose or tubing before entering the sampling tube.
2.3.4. Attach the sampler vertically with the 110-mg section pointing downward, in the worker's breathing zone so it does not impede work performance or safety.
2.3.5. After sampling for the appropriate time, remove the sample
and seal the tube with plastic end caps. Wrap each sample
2.3.6. Submit at least one blank sample with each set of samples. Handle the blank sample in the same manner as the other samples except draw no air through it.
2.3.7. Record sample volumes (in liters of air) for each sample, as well as any potential interferences.
2.3.8. Ship any bulk samples separate from the air samples.
2.3.9. Submit the samples to the laboratory for analysis as soon as possible after sampling. If delay is unavoidable, store the samples at reduced temperature.
2.4. Sampler capacity
The sampling capacity of the front section of a TBC-coated coconut shell charcoal sampling tube was tested by sampling from a dynamically generated test atmosphere of MME (144 ppm or 589 mg/m3). The sample was collected at 0.05 L/min and the relative humidity was 80%. The 5% breakthrough occurred after sampling for 164 min or 8.19 L. (Section 4.9.)
2.5. Desorption efficiency
- 2.5.1. The average desorption efficiency from TBC-coated coconut
shell charcoal adsorbent is 96.1% over the range of 0.5 to 2 times
the target concentration. (Section
4.10.1.)
2.5.2. Desorbed samples remain stable for at least 25 h. (Section 4.10.2.)
2.5.3 The desorption efficiency was determined at lower concentrations, down to 2% of the target concentration. This was done because the desorption efficiency decreased to 76% at the RQL. The desorption efficiency did not decrease over the concentration range studied. (Section 4.10.3.)
2.5.4. Desorption efficiencies should be confirmed periodically because differences may occur due to variations in sampler lots, desorption solvent, and operator technique.
2.6. Recommended air volume and sampling rate
- 2.6.1. For TWA samples, the recommended air volume is 3 L
collected at 0.05 L/min
2.6.2. For short-term samples, the recommended air volume is 0.75
L collected at 0.05 L/min
2.6.3. When short-term samples are required, the reliable quantitation limit becomes larger. For example, the reliable quantitation limit is 0.60 ppm (2.47 mg/m3) when 0.75 L of air is collected.
2.7. Interferences (sampling)
- 2.7.1. It is not known if any compounds will severely interfere
with the collection of MME on
2.7.2. Suspected interferences should be reported to the laboratory with submitted samples.
- 2.8.1. The sampling equipment should be attached to the worker
in such a manner that it will not interfere with work performance or
safety.
2.8.2. All safety practices that apply to the work area being sampled should be followed.
2.8.3. Protective eyewear should be worn when breaking the ends of the glass sampling tubes.
3. Analytical Procedure
- 3.1. Apparatus
- 3.1.1. A GC equipped with a flame ionization detector (FID). A
3.1.2. A GC column capable of separating MME and the internal
standard from the desorbing solvent and any potential interferences.
A
3.1.3. An electronic integrator or some other suitable means of measuring detector response. A Waters 860 Networking Computer System was used in this evaluation.
3.1.4. Two-milliliter glass vials with polytetrafluoroethylene-lined caps.
3.1.5. A dispenser capable of delivering 1.0 mL of desorbing
solution is used to prepare standards and samples. If a dispenser is
not available, a
3.2. Reagents
- 3.2.1. Methyl methacrylate (MME). Reagent grade or better should
be used. The BAKER grade used in this evaluation was purchased from
JT Baker Chemical Co. (Phillipsburg, NJ).
3.2.2. Toluene. Reagent grade or better should be used. The Burdick & Jackson B&J Brand™ High Purity Solvent used in this evaluation was purchased from Baxter Healthcare Corp. (Muskegon, MI).
3.2.3. Desorbing solution. The desorbing solution is prepared by adding 20 µL of an appropriate internal standard to 1 L of toluene. Benzene (reagent grade) was used in this evaluation as the internal standard and was purchased from EM Science (Gibbstown, NJ).
3.3. Standard preparation
- 3.3.1. Prepare concentrated stock standards of MME in toluene.
Prepare working analytical standards by injecting microliter amounts
of concentrated stock standards into
3.3.2. Prepare a sufficient number of analytical standards to generate a calibration curve. Ensure that the amount of MME found in the samples is bracketed by the standards. Prepare additional standards if necessary.
3.4. Sample preparation
- 3.4.1. Remove the plastic caps from the sample tube and
carefully transfer each section of the adsorbent to separate
3.4.2. Add 1.0 mL of desorbing solution to each vial and
immediately seal the vials with
3.4.3. Shake the vials vigorously several times during the next 30 min to ensure complete desorption.
3.5. Analysis
- 3.5.1. Analytical conditions
| GC conditions
| ||
| zone temperatures: |
250°C (injector) 300°C (detector) | |
| column program: | initial temp at 120°C, increase temp at 5°C/min to 150°C, hold for 5 min | |
| column gas flow: | 1.35 mL/min (hydrogen) | |
| septum purge: | 1.5 mL/min (hydrogen) | |
| injection size: | 1.0 µL (5.4:1 split) | |
| column: | 60 m × 0.32-mm i.d. capillary
| |
| retention times: | 9.3 min (benzene) |
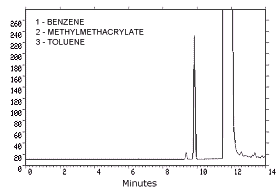 |
| FID conditions
| ||
| hydrogen flow: | 36.5 mL/min | |
| air flow: | 444 mL/min | |
| nitrogen makeup flow: |
46.5 mL/min | |
3.5.2. An internal standard (ISTD) calibration method is used. A
calibration curve can be constructed by plotting micrograms of
analyte per milliliter versus
3.6. Interferences (analytical)
- 3.6.1. Any compound that produces an FID response and has a
similar retention time as the analyte or internal standard is a
potential interference. If any potential interferences were
reported, they should be considered before samples are desorbed.
Generally, chromatographic conditions can be altered to separate an
interference from the analyte.
3.6.2. Retention time on a single column is not considered proof of chemical identity. Analysis by an alternate GC column or confirmation by mass spectrometry are additional means of identification.
3.7. Calculations
The amount of analyte per milliliter is obtained from the
appropriate calibration curve in terms of micrograms per milliliter
uncorrected for desorption efficiency. The back
|
| ||||||||||
|
|
3.8. Safety precautions (analytical)
- 3.8.1. Restrict the use of all chemicals to a fume hood.
3.8.2. Avoid skin contact and inhalation of all chemicals.
3.8.3. Wear safety glasses, gloves and a lab coat at all times while working with chemicals.
4. Backup Data
- 4.1. Detection limit of the analytical procedure
| The injection size recommended in the analytical procedure
|
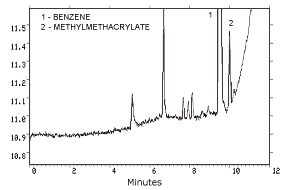 |
4.2. Detection limit of the overall procedure
| The detection limit of the overall procedure is 1.852
µg per sample (151 ppb or 617
µg/m3). The injection size
listed in the analytical procedure (1.0 µL, 5.4:1 split)
was used to determine the detection limit of the overall
procedure. Six vials containing 110 mg of
|
| ||||||||||||||||
4.3. Reliable quantitation limit data
| The reliable quantitation limit is 1.852 µg per
sample (151 ppb or 617 µg/m3).
The injection size listed in the analytical procedure (1.0
µL, 5.4:1 split) was used to determine the reliable
quantitation limit. Six vials containing 110 mg of
|
| ||||||||||||||||
4.4. Instrument response to the analyte
The instrument response to MME over the range of 0.5 to 2 times the
target concentration is linear with a slope of 819 (in
|
| |||
| × target concn µg/mL |
0.5× 617.5 |
1.0× 1235 |
2.0× 2470 |
|
| |||
| area counts | 512437 512257 514988 515158 517743 515895 |
1022070 1017157 1014684 1026172 1025209 1026773 |
2025506 2037759 2027601 2039743 2027149 2038024 |
|
| |||
| 514746 | 1022011 | 2032630 | |
|
| |||
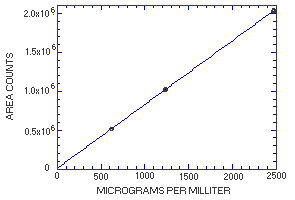
Figure 4.4. Calibration curve for
MME.
Storage samples were prepared by injecting 10 µL of a
standard solution onto the
|
| |||||||
| time (days) |
percent recovery (ambient) |
percent
recovery (refrigerated) | |||||
|
| |||||||
| 0 3 6 9 13 15 |
97.3 90.5 91.6 88.1 85.0 86.1 86.3 |
100.1 98.8 92.0 88.2 86.2 82.5 84.6 |
96.6 90.2 97.6 90.2 85.6 84.7 87.0 |
97.3 90.5 94.8 95.9 92.6 93.0 92.2 |
100.1 98.8 100.5 95.0 92.9 95.9 93.1 |
96.6 90.2 100.9 94.7 94.0 96.2 95.0 |
|
|
| |||||||
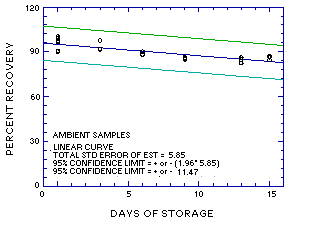 Figure 4.5.1. Ambient storage test for MME. |
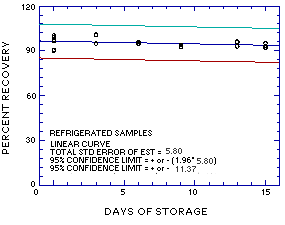 Figure 4.5.2. Refrigerated storage test for MME. |
4.6. Precision (analytical method)
| The precision of the analytical procedure is defined as the pooled coefficient of variation determined from replicate injections of MME standards at 0.5, 1 and 2 times the target concentration. Based on the data of Table 4.4., the coefficient of variation (CV) for the three levels and the pooled coefficient of variation were calculated. The pooled coefficient of variation is 0.0041. |
| |||||||||||||||||||||
4.7. Precision (overall procedure)
The precision of the overall procedure is determined from the storage data. The determination of the standard error of estimate (SEE) for a regression line plotted through the graphed storage data allows the inclusion of storage time as one of the factors affecting overall precision. The SEE is similar to the standard deviation, except it is a measure of dispersion of data about a regression line instead of about a mean. It is determined with the following equation:

| where | n = k = k = |
total number of data points 2 for linear regression 3 for quadratic regression |
| Yobs = | observed percent recovery at a given time | |
| Yest = | estimated percent recovery from the regression line at the same given time |
An additional 5% for pump error is added to the SEE by the addition
of variances. The precision at the 95% confidence level is obtained by
multiplying the SEE (with pump error included) by 1.96 (the
| Six samples were prepared by injecting an aliquot of a
toluene solution containing 116.3 mg/mL MME onto the
|
| |||||||||||||||||||||
An attempt to generate a dynamic test atmosphere was performed by
injecting pure MME from a
The sampling capacity of the front section of a
|
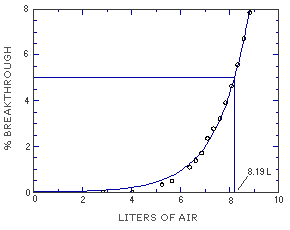 Figure 4.9. Breakthrough air volume for MME. | ||||||||||||||||
4.10. Desorption efficiency and stability of desorbed samples
- 4.10.1. Desorption efficiency
| The desorption efficiency (DE) of MME was determined by
|
| |||||||||||||||||||||||||||||
4.10.2. Stability of desorbed samples
| The stability of desorbed samples was investigated by reanalyzing the target concentration samples 25 h after initial analysis. The original analysis was performed and the vials were not recapped after injection. The samples were reanalyzed with fresh standards at the completion of the desorption efficiency test without removing the samples from the GC. The average recovery of the reanalysis, compared to the average recovery of the original analysis, was 97.2% (+0.4% change). |
| ||||||||||||||||
4.10.3. Linearity of desorption
The average desorption efficiency is 96.1% for MME but the desorption at the RQL, 0.15% of the target concentration, is 76.0%. This can infer that the desorption efficiency is not constant as the amount of MME on the sampler decreases. To determine the linearity of the desorption efficiency, a series of samplers were spiked over the range of 2 to 100% of the target concentration. The data from these samples resulted in a line that deviates only 2% from theoretical values. The desorption efficiency is linear throughout this range.
|
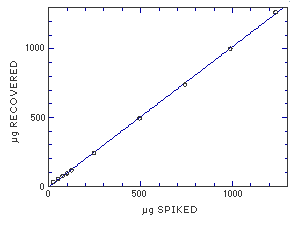 Figure 4.10.3 Linear of desorption over a wide range of concentrations. | ||||||||||||||||
5. References
- 5.1. "NIOSH Manual of Analytical Methods", 3rd
ed.; U.S. Department of Health and Human Services, Center for Disease
Control, National Institute of Occupational Safety and Health;
Cincinnati, OH, 1984, Method 2537, DHHS (NIOSH) Publ. No.
5.2. "OSHA Analytical Methods Manual", 2nd ed.; U.S. Department of Labor, Occupational Safety and Health Administration; OSHA Analytical Laboratory; Salt Lake City, UT, 1990; Method 56; American Conference of Governmental Industrial Hygienists (ACGIH); Cincinnati, OH, Publication No. 4542.
5.3. Burright, D.D. "OSHA Method No. 89; Divinyl Benzene, Ethyl Vinyl Benzene, and Styrene", OSHA Salt Lake Technical Center, unpublished, Salt Lake City, UT 84165, July 1991.
5.4. Burright, D.D. "OSHA Method No. 92; Ethyl Acrylate and Methyl Acrylate", OSHA Salt Lake Technical Center, unpublished, Salt Lake City, UT 84165, December 1991.
5.5. Cheminfo Database on CCINFO CD-ROM disc 91-3, Canadian Centre for Occupational Health and Safety, Hamilton, Ontario.
5.6. International Agency for Research on Cancer,
"IARC Monograph on the Evaluation of the Carcinogenic Risk of
Chemicals to Humans: Some Monomers, Plastics and Synthetic Elastomers,
and Acrolein", IARC, Lyon, France, 1986, Vol. 19, pp.
5.7. "Code of Federal Regulations", Title 29,
1910.1000, Table
5.8. Nemec, J.W. and Kirch, L.S. in "Kirk-Othmer
Encyclopedia of Technology" 3rd ed.; Grayson, M. Ed.; John Wiley &
Sons, New York, 1981, Vol. 15, pp.