Tetraethyltin
| Method number: | 110 |
| Matrix: | Air |
| Target concentration: | 0.2 mg/m3, TWA |
| Procedure: | Samples are collected by drawing known
volumes of air through sampling tubes containing 100 mg of
|
| Recommended air volume and sampling rate: | 48 L at 0.2 L/min |
| Reliable quantitation limit: | 14.4 µg/m3 |
| Standard error of estimate at target concentration: | 6.13% |
| Status of method: | Evaluated method. This method has been subjected to the established evaluation procedures of the Organic Methods Evaluation Branch. |
| Date: July 1997 | Chemist: Yihlin Chan |
OSHA Salt Lake Technical Center
Salt Lake City, UT 84115-1802
1. General Discussion
- 1.1 Background
1.1.1 History
The OSHA PEL for tin is 0.1 mg/m3 for
organic tin compounds and 2 mg/m3 for
inorganic tin compounds. (Ref.
5.1) In order to evaluate the exposure to tin in the workplace,
one must distinguish between the organic and the inorganic tin
compounds. The early NIOSH method for organotins (Ref.
5.2), in which the workplace air is sampled with a membrane
filter/charcoal tube and analyzed by colorimetry, does not do this.
Until a satisfactory procedure for separating the organic tin
compounds as a group from the inorganic ones is found, the specific
organotins must be sampled and analyzed if we were to assess the
worker exposure to organotin properly. The latest NIOSH method for
organotin compounds (Ref.
5.3) specifies sampling with a glass fiber
Although this method covers only tetraethyltin, the original goal of this work was to provide a common procedure for tetramethyltin and tetraethyltin. These volatile alkyltins lend themselves well for GC analysis. Detection using an atomic emission detector was considered first for its specific measurement of tin, but was abandoned due to lack of sensitivity. A flame ionization detector was found to provide adequate sensitivity.
A variety of sorbents were considered for a common sampler for
tetramethyltin and tetraethyltin but none of them was satisfactory.
Satisfactory recovery of tetraethyltin was not obtained from
charcoal, carbon molecular sieve, or Anasorb 747, even with a
variety of desorption solvents, including toluene, acetone,
methylene chloride/methanol, and
This method covers the sampling and analytical procedure for
tetraethyltin. Samples are collected on
1.1.2 Toxic effects (This section is for information only and should not be taken as the basis of OSHA policy.) (Ref. 5.2)
Organotin compounds differ in the severity of their toxic effects as well as in the organs they affect. The trialkyltins are the most toxic group, followed by the dialkyltins and monoalkyltins. The tetraalkyltins are metabolized to their trialkyltin homologs, so that their effects are those of the trialkyltins, with severity dependent upon the rate of metabolic conversion. Thus, an important feature of tetraalkyltin poisoning is the slow development of toxic symptoms and the long periods before death may occur.
In 1951, Zeman and others reported four cases of employee exposure to unknown concentrations of tetramethyltin and tetraethyltin. Initial symptoms in all four subjects included severe headaches and nausea, with vomiting in two instances. Illnesses lasted four to ten weeks. In the most severe case of organotin poisoning, bradycardia, hypotension, and abrupt variations in the sinus rhythm of the heart were observed. These findings suggest that these organotins are potent poisons of the circulatory system and may affect the autonomic nervous system.
1.1.3 Workplace exposure
Tetraethyltin is used as a catalyst and as a metal plating agent. It is also used in flame resistant polyester. (Ref. 5.2) Workers employed in the manufacturing operations involving tetraethyltin or its application have the greatest potential for exposure.
1.1.4 Physical properties and other descriptive information (Ref. 5.2)
| CAS no.: | 597-64-8 |
| synonyms: | tetraethylstannane; TET; TeET |
| molecular formula: | (C2H5)4Sn |
| formula wt: | 234.94 |
| appearance: | clear liquid |
| boiling point: | 180.5 - 181°C |
| melting point: | -136 to -125°C |
| specific gravity: | 1.187 |
| flash point: | 53°C |
| solubility: | soluble in organic solvents, very slightly soluble in water |
| structure formula: |  |
The analyte air concentrations throughout this method are based on the recommended sampling and analytical parameters. The analyte concentrations are listed as those of tetraethyltin. To compare the concentration to the OSHA PEL for tin in organic compounds (0.1 mg/m3), apply a conversion factor of 0.5052 to find the tin content.
- 1.2 Limit defining parameters
- 1.2.1 Detection limit of the analytical procedure
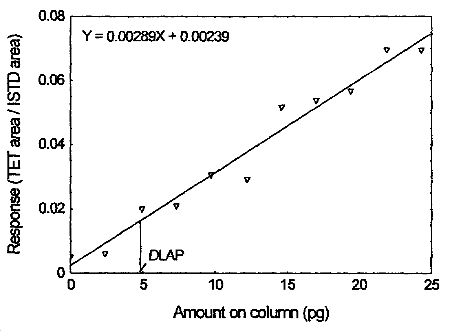
The detection limit of the analytical procedure is 4.8 pg. This is the amount of analyte that will give a response that is significantly different from the background response of reagent blank. (Sections 4.1 and 4.2)
1.2.2 Detection limit of the overall procedure
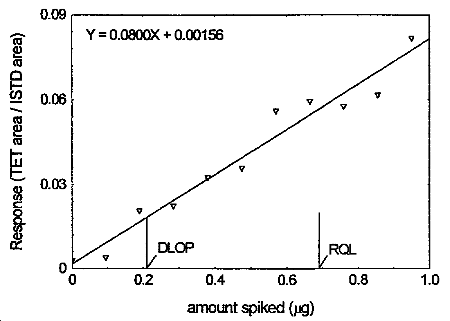
The detection limit of the overall procedure is 0.21 µg per sample (4.3 µg/m3). This is the amount of analyte spiked on the sampler that will give a response that is significantly different from the background response of a sampler blank. (Sections 4.1 and 4.3)
1.2.3 Reliable quantitation limit
The reliable quantitation limit is 0.69 µg per sample (14.4 µg/m3). This is the amount of analyte spiked on a sampler that will give a signal that is considered the lower limit for precise quantitative measurements. (Section 4.4)
1.2.4 Precision (analytical procedure)
The precision of the analytical procedure, measured as the pooled relative standard deviation over a concentration range equivalent to 0.5 to 2 times the target concentration, is 1.11%. (Section 4.5)
1.2.5 Precision (overall procedure)
The precision of the overall procedure at the 95% confidence
level for the ambient temperature
1.2.6 Recovery
The recovery of tetraethyltin from samples used in a
1.2.7 Reproducibility
Six samples, collected from a controlled test atmosphere, with a draft copy of this procedure, were submitted for analysis by an SLTC Organic Service Branch. The samples were analyzed after 2 days of storage at 5°C. No individual sample result deviated from its theoretical value by more than the precision reported in Section 1.2.5. (Section 4.8)
2. Sampling Procedure
- 2.1 Apparatus
2.1.1 A personal sampling pump calibrated to ±5% of the recommended flow rate with the sampling device attached.
2.1.2 Glass sampling tubes (110 mm x 6 mm o.d.) packed with two
sections of
2.2 Reagents
None required.
2.3 Technique
- 2.3.1 Immediately before sampling, break off the ends of the
sampling tube. All tubes should be from the same lot.
2.3.2 Attach the sampling tube to the sampling pump with flexible tubing.
2.3.3 Air should not pass through any hose or tubing before entering the sampling tube.
2.3.4 Cap both ends after sampling. Wrap each sample with a Form
2.3.5 Record the air volume for each sample.
2.3.6 Submit at least one blank with each set of samples. Blanks should be handled in the same manner as samples, except no air is drawn through them.
2.3.7 List any compounds that could be considered potential interferences.
2.4 Sampler capacity
The capacity of the front section of the
2.5 Desorption efficiency
- 2.5.1 The average desorption efficiency for tetraethyltin from
2.5.2 The desorption efficiencies at 0.2, 0.1, and 0.05 times the target concentration were found to be 100.2%, 104.0%, and 100.3%, respectively. (Section 4.10.1)
2.5.3 Desorbed samples remain stable for at least 24 h. (Section 4.10.2)
2.6 Recommended air volume and sampling rate
- 2.6.1 The recommended air volume is 48 L at 0.2 L/min.
2.6.2 For
2.6.3 When
2.7 Interferences (sampling)
There is no known interference for sampling.
2.8 Safety precautions (sampling)
2.8.1 The sampling equipment should be attached to the worker in such a manner that it will not interfere with work performance or safety.
2.8.2 All safety practices that apply to the work area being sampled should be followed.
- 3.1 Apparatus
- 3.1.1 A GC equipped with a flame ionization detector. An HP 5890
equipped with a flame ionization detector and an autosampler were
used in this evaluation.
3.1.2 A capillary column capable of separating tetraethyltin and
p-cymene from any interferences. An
3.1.3 An electronic integrator or other suitable means of measuring detector response. The Millennium Chromatography Manager System (Waters) was used in this evaluation.
3.1.4 Glass vials,
3.1.5 A dispenser capable of delivering 1.0 mL of desorbing solvent.
3.2 Reagents
- 3.2.1 Tetraethyltin. Tetraethyltin, technical grade, was
obtained from Chem Services.
3.2.2 Carbon disulfide. Carbon disulfide, Omni Solv grade, was obtained from E. M. Science.
3.2.3 p-Cymene. p-Cymene, 99%, was obtained from Aldrich Chemical.
3.2.4 Desorbing solvent. Add 8 µL of p-cymene to 1 L of carbon disulfide.
3.3 Standard preparation
- 3.3.1 Prepare stock standards of tetraethyltin in the desorbing
solvent. Eight microliters of tetraethyltin diluted to 10 mL with
the desorbing solvent will give a stock standard of 950
µg/mL.
3.3.2 Prepare analytical standards by diluting the stock standards with the desorbing solvent. A 9.5 µg/mL standard solution corresponds to the target concentration.
3.4 Sample preparation
- 3.4.1 Transfer the sorbent of the front and the back section to
separate glass vials.
3.4.2 Add 1.0 mL of the desorbing solvent to each vial.
3.4.3 Cap the vials and shake them on a mechanical shaker for 30 min.
3.5 Analysis
- 3.5.1 GC conditions
| column: | RTx-1 (60 m x 0.32-mm i.d., 1.0-µm df) | |
| oven temperature: | 160°C | |
| injector temperature: | 250°C | |
| detector temperature: | 300°C | |
| injection size: | 1.0 µL | |
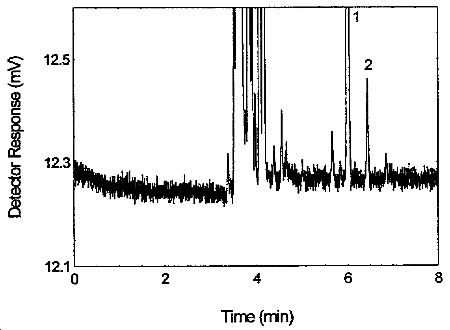
| retention time: | p-cymene | 6.05 min |
| tetraethyltin | 6.48 min | |
| hydrogen: | 27 mL/min | |
| air: | 415 mL/min | |
| make-up gas (N2): | 29 mL/min | |
| split ratio: | 39.1 | |
3.5.2 An internal standard calibration method is used. A calibration curve can be constructed by plotting concentration of the analyte versus ISTD-corrected response of standard injections. Bracket the samples with freshly prepared standards.
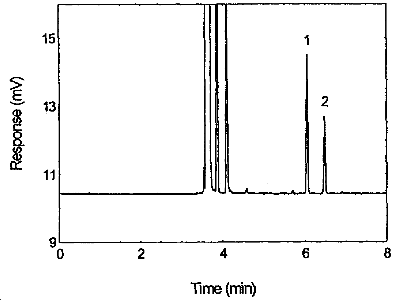
Figure 3.5.1. Chromatogram of tetraethyltin standard at the target concentration. 1 = p-cymene, 2 = tetraethyltin
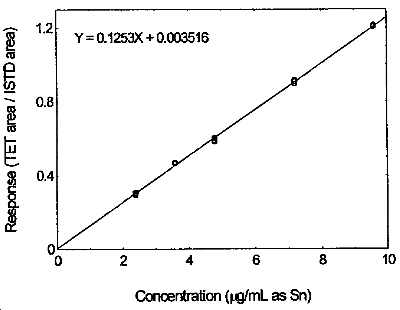
Figure 3.5.2. Calibration curve of tetraethyltin made from the data of Table 4.5.
- 3.6 Interferences (analytical)
- 3.6.1 Any compound that responds to FID and has a similar
retention time as the analyte or the internal standard is a
potential interference. If any potential interferences are reported,
they should be considered before samples are desorbed. Generally,
chromatographic conditions can be altered to separate an
interference from the analyte.
3.6.3 When necessary, the identity or the purity of an analyte peak may be confirmed with additional analytical data (Section 4.11).
3.7 Calculations
The amount (in micrograms) of tetraethyltin per milliliter is obtained from the appropriate calibration curve. This amount is corrected by subtracting the amount (if any) found in the blank. The air concentration is calculated using the following formula.
| mg/m3 = | (micrograms per mL) × (extraction
volume, mL)
(liters of air sampled) × (extraction efficiency) |
| Where: | Desorption volume = 1 mL |
| Desorption efficiency = 1.026 |
To compare the concentration to the OSHA PEL for tin in organic compounds (0.1 mg/m3), apply a conversion factor of 0.5052 to find the tin content.
3.8 Safety precautions (analytical)
- 3.8.1 Follow the rules set down in your Chemical Hygiene Plan.
3.8.2 Avoid skin contact and inhalation of all chemicals.
3.8.3 Wear safety glasses and a lab coat at all times while in the lab area.
4. Backup Data
- 4.1 Determination of detection limits
Detection limits (DL), in general, are defined as the amount (or concentration) of analyte that gives a response (YDL) that is significantly different (three standard deviations (SDBR) from the background response (YBR).
The direct measurement of YBR and
SDBR in chromatographic methods is typically
inconvenient and difficult because YBR is
usually extremely low. Estimates of these parameters can be made with
data obtained from the analysis of a series of analytical standards or
samples whose responses are in the vicinity of the background
response. The regression curve obtained for a plot of instrument
response versus concentration of analyte will usually be linear.
Assuming
SDBR and the precision of data
about the curve are similar, the standard error of estimate (SEE) for
the regression curve can be substituted for
SDBR in the above equation. The following
calculations derive a formula for DL:

| Yobs | = observed response |
| Yest | = estimated response from regression curve |
| n | = total no. of data points |
| k | = 2 for a linear regression curve |
At point YDL on the regression curve
| YDL = A(DL) + YBR | A = analytical sensitivity (slope) |
therefore
| DL = | A |
Substituting 3(SEE) + YBR for YDL gives
| DL = | A |
4.2 Detection limit of the analytical procedure (DLAP)
The DLAP is measured as the mass of analyte actually introduced into the chromatographic column. Ten analytical standards of tetraethyltin whose concentrations was equally spaced from 0 to 0.950 µg/mL were prepared. The standard containing 0.950 µg/mL represented approximately 10 times the baseline noise. These solutions were analyzed with the recommended analytical parameters (1 µL injection, 39.1 split ratio). The data obtained were used to determine the required parameters (A and SEE) for the calculation of the DLAP. Values of 0.00289 and 0.00461 were obtained for A and SEE respectively. DLAP was calculated to be 4.8 pg.
Detection Limit of the Analytical Procedure for tetraethyltin
|
| |||
| concentration | mass on column | response | |
| (µg/mL) | (pg) | ||
|
| |||
| 0.000 | 0.0 | 0.005117 | |
| 0.095 | 2.4 | 0.006042 | |
| 0.190 | 4.9 | 0.019923 | |
| 0.285 | 7.3 | 0.020949 | |
| 0.380 | 9.7 | 0.030539 | |
| 0.475 | 12.1 | 0.029186 | |
| 0.570 | 14.6 | 0.051692 | |
| 0.665 | 17.0 | 0.053757 | |
| 0.760 | 19.4 | 0.056698 | |
| 0.855 | 21.9 | 0.069562 | |
| 0.950 | 24.3 | 0.069456 | |
|
| |||
4.3 Detection limit of the overall procedure (DLOP)
The DLOP is measured as mass per sample and expressed as equivalent air concentration, based on the recommended sampling parameters. Ten samplers were spiked with tetraethyltin ranging from 0 to 0.950 µg. The latter amount, when spiked on a sampler, would produce a peak approximately 10 times the baseline noise for a sample blank. These samples were analyzed with the recommended analytical parameters, and the data obtained used to calculate the required parameters (A and SEE) for the calculation of the DLOP. Values of 0.0800 and 0.00549 were obtained for A and SEE respectively. DLOP was calculated to be 0.21 µg/sample (4.3 µg/m3).
Detection Limit of the Overall
Procedure for Tetraethyltin
|
| ||
| mass per sample | response | |
| (µg) | ||
|
| ||
| 0.000 | 0.002780 | |
| 0.095 | 0.003864 | |
| 0.190 | 0.020702 | |
| 0.285 | 0.022380 | |
| 0.380 | 0.032509 | |
| 0.475 | 0.035886 | |
| 0.570 | 0.056129 | |
| 0.665 | 0.059509 | |
| 0.760 | 0.057776 | |
| 0.855 | 0.061797 | |
| 0.950 | 0.081816 | |
|
| ||
4.4 Reliable quantitation limit
The RQL is considered the lower limit for precise quantitative measurements. It is determined from the regression line data obtained for the calculation of the DLOP (Section 4.3) providing at least 75% of the analyte is recovered. The RQL is defined as the amount of analyte that gives a response (YRQL) such that
therefore
RQL = 0.69 µg per sample (14.4 µg/m3)
Recovery at this level is 106.2%.
4.5 Precision (analytical method)
The precision of the analytical procedure is defined as the pooled
relative standard deviation
(RSDP).
Relative standard deviations were determined from six replicate
injections of analytical standards at 0.5, 0.75, 1, 1.5, and 2 times
the target concentration. After assuring that the RSDs satisfy the
Cochran test for homogeneity at the 95% confidence level,
RSDP was calculated.
Instrument Response to Tetraethyltin
|
| |||||||
| x target concn | 0.5 x | 0.75 x | 1 x | 1.5 x | 2 x | ||
| µg/mL | 4.75 | 7.12 | 9.50 | 14.24 | 18.99 | ||
|
| |||||||
| Response | 0.298908 | 0.470980 | 0.603011 | 0.896033 | 1.205802 | ||
| 0.299132 | 0.465653 | 0.603646 | 0.896054 | 1.214870 | |||
| 0.293568 | 0.464225 | 0.598385 | 0.896632 | 1.208242 | |||
| 0.297834 | 0.470271 | 0.582012 | 0.908579 | 1.207354 | |||
| 0.308123 | 0.466955 | 0.590737 | 0.916217 | 1.213500 | |||
| 0.302405 | 0.471602 | 0.600238 | 0.895729 | 1.209036 | |||
| 0.299995 | 0.468281 | 0.596338 | 0.901541 | 1.209801 | |||
| SD | 0.004894 | 0.003079 | 0.008414 | 0.008755 | 0.003588 | ||
| RSD % | 1.63 | 0.66 | 1.41 | 0.97 | 0.30 | ||
|
| |||||||
The Cochran test for homogeneity requires the calculation of the g statistics according to the following formula:

The critical value of the g statistic, at the 95% confidence level, for five variances, each associated with six observations, is 0.5065. Because the g statistic obtained (0.4347) does not exceed this value, the RSDs within each level can be considered equal and they can be pooled (RSDP) to give an estimated RSD for the concentration range studied.
 =
1.11%
4.6 Precision (overall procedure)
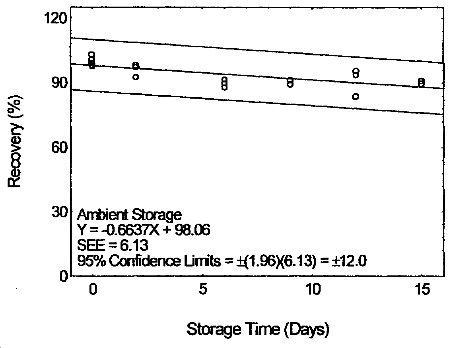
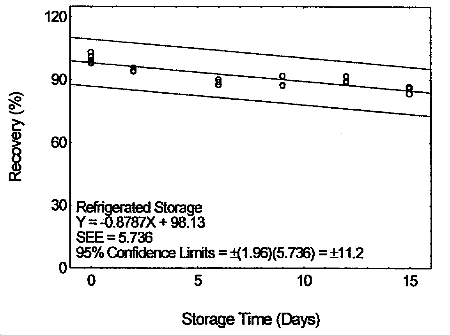
The precision of the overall procedure is determined from the storage data in Section 4.7. The determination of the standard error of estimate (SEER) for a regression line plotted through the graphed storage data allows the inclusion of storage time as one of the factors affecting overall precision. The SEER is similar to the standard deviation, except it is a measure of dispersion of data about a regression line instead of about a mean. It is determined with the following equation:

| n | = total no. of data points |
| k | = 2 for linear regression |
| k | = 3 for quadratic regression |
| Yobs | = observed % recovery at a given time |
| Yest | = estimated % recovery from the regression line at the same given time |
An additional 5% for pump error (SP) is added to the SEER by the addition of variances to obtain the total standard error of estimate.

The precision at the 95% confidence level is obtained by
multiplying the standard error of estimate (with pump error included)
by 1.96 (the
4.7 Storage test
Storage samples were prepared by drawing samples from a controlled
test atmosphere (80% relative humidity and 22°C) at 0.2 L/min for 120
min. The concentration of tetraethyltin was at two times the target
concentration.
Storage Test for Tetraethyltin
|
| |||||||
| time | percent recovery | percent recovery | |||||
| (days) | (ambient) | (refrigerated) | |||||
|
| |||||||
| 0 | 98.2 | 99.2 | 103.1 | 98.2 | 99.2 | 103.1 | |
| 0 | 97.6 | 100.8 | 101.1 | 97.6 | 100.8 | 101.1 | |
| 2 | 98.1 | 97.2 | 92.6 | 93.9 | 94.5 | 95.8 | |
| 6 | 91.6 | 89.9 | 87.9 | 90.2 | 89.1 | 87.7 | |
| 9 | 89.4 | 91.4 | 89.4 | 92.1 | 87.6 | 87.2 | |
| 12 | 95.5 | 83.7 | 93.6 | 88.7 | 91.9 | 89.5 | |
| 15 | 90.8 | 91.0 | 89.6 | 86.1 | 83.5 | 86.9 | |
|
| |||||||
4.8 Reproducibility
Reproducibility samples were prepared by collecting them from a controlled test atmosphere similar to that used in the storage test. The samples were submitted to an SLTC Service Branch for analysis. The samples were analyzed after being stored for 2 days at 5°C. No sample result had a deviation greater than the precision of the overall procedure determined in Section 4.7.
Reproducibility Data for Tetraethyltin
|
| ||||
| µg expected | µg found | percent found | percent deviation | |
|
| ||||
| 9.73 | 9.86 | 101.3 | +1.3 | |
| 9.95 | 10.45 | 105.0 | +5.0 | |
| 9.81 | 10.21 | 104.1 | +4.1 | |
| 9.89 | 10.19 | 103.0 | +3.0 | |
| 9.94 | 10.17 | 102.3 | +2.3 | |
| 9.91 | 10.19 | 102.8 | +2.8 | |
|
| ||||
4.9 Sampler capacity
The sampling capacity of the front section of an
Breakthrough of Tetraethyltin with
|
| |||||||
| test 1 | test2 | ||||||
|
| |||||||
| sampling | air | downstream | breakthrough | downstream | breakthrough | ||
| time (min) | volume (L) | concn (mg/m3) | (%) | concn (mg/m3) | (%) | ||
|
| |||||||
| 30 | 6 | 0 | 0 | 0 | 0 | ||
| 90 | 18 | 0 | 0 | 0 | 0 | ||
| 150 | 30 | 0 | 0 | 0 | 0 | ||
| 210 | 42 | 0 | 0 | 0 | 0 | ||
| 270 | 54 | 0 | 0 | 0 | 0 | ||
| 330 | 66 | 0 | 0 | 0 | 0 | ||
| 390 | 78 | 0 | 0 | 0 | 0 | ||
| 450 | 90 | 0 | 0 | 0 | 0 | ||
|
| |||||||
- 4.10 Desorption efficiency and stability of desorbed samples
- 4.10.1 Desorption efficiency
The desorption efficiencies (DE) of tetraethyltin were determined
by liquid-spiking
Desorption Efficiency of Tetraethyltin
|
| |||||||
| x target concn | 0.05 x | 0.1 x | 0.2 x | 0.5 x | 1.0 x | 2.0 x | |
| (µg/sample) | 0.48 | 0.95 | 1.90 | 4.75 | 9.50 | 18.99 | |
|
| |||||||
| DE(%) | 72.1 | 105.2 | 95.5 | 101.0 | 101.1 | 101.9 | |
| 109.6 | 105.8 | 101.9 | 103.8 | 101.5 | 102.0 | ||
| 92.9 | 96.9 | 100.5 | 102.0 | 102.7 | 103.1 | ||
| 107.5 | 106.0 | 99.9 | 106.3 | 102.9 | 99.6 | ||
| 137.1 | 110.8 | 101.1 | 105.0 | 102.5 | 104.6 | ||
| 82.5 | 99.4 | 102.1 | 101.3 | 104.4 | 102.1 | ||
| Average | 100.3 | 104.0 | 100.2 | 103.2 | 102.5 | 102.2 | |
|
| |||||||
4.10.2 Stability of desorbed samples
The stability of the desorbed samples was investigated by
Stability of Desorbed Samples of Tetraethyltin
|
| |||||
| punctured septa replaced | punctured septa retained | ||||
|
| |||||
| initial | DE after | initial | DE after | ||
| DE (%) | one day (%) | difference | DE (%) | one day (%) | difference |
|
| |||||
| 101.9 | 100.3 | -1.6 | 99.6 | 100.0 | +0.4 |
| 102.0 | 100.3 | -1.7 | 104.6 | 102.3 | -2.3 |
| 103.1 | 100.6 | -2.5 | 102.1 | 102.0 | -0.1 |
| average | average | ||||
| 102.3 | 100.4 | -1.9 | 102.1 | 101.4 | -0.7 |
|
| |||||
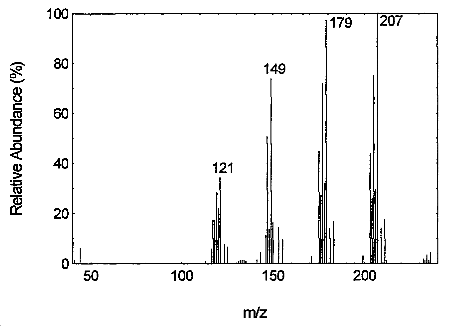
4.11 Qualitative analysis
Tetraethyltin may be confirmed by GC/MS using the GC conditions similar to those in Section 3.5.1.
- 5.1. Air Contaminants -- Permissible
Exposure Limits, Title 29, Code of Federal Regulations, Part
1910.1000.
5.2. Criteria for a recommended standard ...
Occupational exposure to organotin compounds, U.S. Department of
Health, Education, and Welfare, Public Health Service, Center for
Disease Control, National Institute for Occupational Safety and
Health, November 1976. DHEW (NIOSH) Publication No.
5.3. NIOSH Manual of Analytical Methods, 4th ed., Method No. 5504, 1994.