|
| Method no.: |
W4001 |
| |
|
| Control no.: |
T-W4001-FV-02-0104-M |
| |
|
| Target concentration: |
0.050 µg/100 cm2 |
| |
|
| Procedure: |
Wipe samples are collected by
using firm hand pressure to move a 37-mm diameter polyvinyl
chloride (PVC) filter, 5-µm pore
size, across the surface of interest. An alternate medium for
rough surfaces is a 37-mm binderless quartz fiber filter.
Samples are digested with multiple buffered solutions. After
dilution, an aliquot of this solution is analyzed for
hexavalent chromium (Cr(VI)) by ion chromatography with
postcolumn derivatization of the Cr(VI) with 1,5-diphenyl
carbazide and detected by a UV-vis detector at 540 nm. |
| |
|
| Special
requirements: |
In chrome plating environments,
wipe samples taken on a PVC filter or an uncoated binderless
quartz fiber filter, should be placed in a vial containing 5
mL of an aqueous solution containing 10%
Na2CO3 with 2% NaHCO3
immediately after sampling to eliminate the interference from
the acid used in the chrome plating process. An alternate
medium which does not require extraction in the field is a
binderless quartz fiber filter coated with 1% NaOH. |
| |
|
| Reliable quantitation limit: |
3 ng/sample |
| |
|
| Status of method: |
Evaluated method. This method
has been subjected to the established evaluation procedures of
the Methods Development Team. |
| |
|
| April 2001 |
Mary E. Eide |
| |
|
Methods Development Team
Industrial Hygiene
Chemistry Division
OSHA Salt Lake Technical Center
Sandy
UT 84070-6407
|
1. General Discussion
1.1 Background
1.1.1 History
This wipe sampling
method was developed to provide a means of taking wipe
samples for hexavalent chromium (Cr(VI)). The OSHA SLTC
has received wipe samples taken on a variety of media,
including PVC filters, baby wipes, paper filters such as
Whatman filter, glass fiber filter, and mixed cellulose
ester filter. The Cr(VI) decomposed to trivalent chromium
(Cr(III)) on all of these media except the PVC filters.
The Evaluation Guidelines for Surface Sampling
Methods(1)
specifies the use of fabric wipes, whenever possible. The
cloth-like wipes which were tried, Durx 670
(polyester/cotton nonwoven fabric) and pro-Wipe 880
(polyester woven fabric), did not work because the Cr(VI)
reacted with them, changing it to Cr(III), so they could
not be used for this evaluation. Wipe samples were first
evaluated by collection on PVC filters, and analyzed
following the analytical procedure in OSHA Method
ID-215.(2)
Because PVC filters may tear on rough surfaces, a
binderless quartz fiber filter was also evaluated and
found to have good recoveries. In chrome plating
processes, there is an additional interference of the
acid, which changes the Cr(VI) to Cr(III), upon storage.
Both the samples collected on the PVC filters and the
binderless quartz fiber filters had a significant loss in
a 15 day storage. This loss was eliminated by placing the
samples taken on either the PVC filters or the binderless
quartz fiber filters in a vial containing 5-mL of an
aqueous solution containing 10% sodium carbonate
(Na2CO3)/2% sodium bicarbonate
(NaHCO3) immediately after sampling. An
alternate medium, which requires no field extraction,
binderless quartz fiber filters coated with 1% NaOH, was
also evaluated for sampling in the chrome plating
environment, and found to give good recoveries.
A
glass plate was first chosen for an ideal surface to check
the surface sampler removal efficiency, but Cr(VI)
interacted with the glass plate changing to Cr(III). The
PTFE surface was chosen as an ideal surface for this
method because of its inertness, and it gave good
recoveries for wipe sampling.
Following the
procedure in OSHA Method ID-215(3),
the filters, of all types, had extraction and digestion
with multiple buffers, separation by ion chromatography,
with post-column derivatization and detection by UV-vis at
540 nm. In this evaluation, the filter is digested in an
aqueous solution containing 10% sodium carbonate
(Na2CO3)/2% sodium bicarbonate
(NaHCO3) and the mixture of phosphate
buffer/magnesium sulfate. After dilution with DI water, an
aliquot of this solution is analyzed for Cr(VI) using an
ion chromatograph equipped with a UV-vis detector at 540
nm. A post-column derivatization of the Cr(VI) with
1,5-diphenyl carbazide is performed prior to detection.
The phosphate buffer and magnesium sulfate solutions are
added to precipitate other metals, especially Fe(II), so
that they do not reduce Cr(VI) changing it to Cr(III).
This was shown in the interferences studies in OSHA Method
ID-215(4).
The Cr(III) is also precipitated to prevent it from
oxidizing to Cr(VI).
For analysis of samples taken
in spray paint operations, it is necessary to perform a
second extraction of the filter with an aqueous solution
of 5% NaOH/ 7.5% Na2CO3, with the
addition of the phosphate buffer/magnesium sulfate, to
remove the Cr(VI) from the hardened paint matrix. Again,
the phosphate buffer with the magnesium sulfate is added
to the NaOH/Na2CO3 to precipitate
the other metals, and prevent them from interacting with
the Cr(VI).
Samples taken in a chrome plating
operation have the additional interference of the acid or
acids, which convert the Cr(VI) to Cr(III), as the samples
are stored. The chrome plating bath usually contains
sulfuric acid, so a mixture of sulfuric acid and Cr(VI) in
water was prepared to emulate the chrome plating solution.
The recovery on Day 15 of storage at ambient temperature
was 78.0% for PVC filters spiked with this mixture of
Cr(VI) and H2SO4, and 81.0% for
refrigerated samples. Samples taken of this mixture of
Cr(VI) and H2SO4 on PVC filters,
immediately placed into a vial containing a solution of
10% Na2CO3 with 2% NaHCO3
after sampling, to neutralize the acid, and stored at
ambient temperature had a 97.4% recovery on Day 15.
Binderless quartz fiber filters had a loss of Cr(VI)when
stored, with an ambient recovery of 86.1% on Day 15. When
the binderless quartz fiber filters were placed
immediately into a vial containing a solution of 10%
Na2CO3 with 2% NaHCO3
after sampling, the ambient recovery was 97.9% on Day 15.
The method for collecting Cr(VI) air samples in chrome
plating operations used in the UK is with a binderless
quartz fiber filter coated with 1% NaOH.(5)
The NaOH coating neutralizes the acid or acids, halting
their reaction with the Cr(VI). The recovery of Cr(VI)
from wipe samples spiked with the mixture of Cr(VI) and
H2SO4 using the 1% NaOH coated
binderless quartz fiber filters had a recovery of 96.4%
for ambient samples on Day 15. The 1% NaOH coated
binderless quartz fiber filters are digested and analyzed
in the same fashion as the PVC filters. These storage
results indicate that for samples taken in chrome plating
operations, the uncoated filters should be placed into a
vial containing a solution of 10%
Na2CO3 with 2% NaHCO3
after sampling, or a 1% NaOH coated binderless quartz
fiber filter should be used.
1.1.2 Toxic effects
(This section is for information only and should not be
taken as the basis of OSHA policy.)
Some of the
water soluble salts of chromic acid, (potassium
dichromate, potassium chromate, sodium dichromate, and
sodium chromate) are very corrosive and can cause burns
which can facilitate the adsorption of these compounds
through the skin.(6)
Cr(VI) causes skin ulcers, blisters, burns, irritation to
mucous membranes, and eye irritation. Workers sensitized
to Cr(VI) compounds experience allergic dermatitis
reactions. Acute dermal exposure can result in necrosis of
the skin and underlying tissue and sloughing of the
skin.(7)
Kidney damage has been reported in workers where skin
absorption has occurred. There have been reports of lung
cancer in workers exposed to chrome pigments in Germany,
Norway, and the United States.(8)
ACGIH has a TLV of 0.05 mg/m3 for water soluble
Cr(VI) compounds and 0.01 mg/m3 for insoluble
Cr(VI) compounds and classify them as recognized human
carcinogens.(9)
ACGIH recommends BEI (Biological Exposure Indices)
not exceed 10 µg/g creatinine
for the increase in urinary chromium concentrations during
the workshift, obtained by comparing a urine sample from
before the shift to one at the end of the shift, and 30
µg/g creatinine for the end of
the workweek at the end of the shift. The chromium
measured in urine is Cr(III), as Cr(VI) is enzymatically
reduced to Cr(III). The preshift urine sample is necessary
because Cr(III) is a nutrient necessary for humans, and it
is often included in vitamin preparations, or is taken as
a supplement. Other common sources of chromium are smoking
and water supplies. The BEI is based on the difference
between the two urine samples.(10)
1.1.3 Workplace exposure(11)
Cr(VI) is primarily used in the form of chromium
trioxide, and the chromates and dichromates of sodium,
potassium, ammonium, calcium, barium, zinc, strontium, and
lead. These compounds are used in photography, dyeing,
electroplating, paints, as rust inhibitors, as pigments,
and as oxidizing agents in tanning.
1.1.4 Physical
properties (12)
( the physical properties listed below are for chromium
trioxide, for physical properties of the other common
salts containing Cr(VI) see OSHA Method ID-215 (13))
| synonyms: |
chromic acid,
chromic anhydride, chromia, chromic trioxide |
| CAS number: |
1333-82-0 |
| molecular weight: |
100.01 |
| IMIS number: |
0686(14) |
| melting point: |
196ºC |
| structural
formula: |
CrO3
|
| solubility: |
very sol in water,
insol in alcohol |
| appearance: |
dark purple-red
crystals |
fire and
explosion hazard:
|
a very
powerful oxidizing agent, which can cause violent
reactions when in contact with organic matter or
reducing
agents |
This method was evaluated according to the
OSHA SLTC "Evaluation Guidelines for Surface Sampling
Methods".(15)
The Guidelines define analytical parameters, specify required
laboratory tests, statistical calculations and acceptance
criteria. The analyte surface concentrations throughout this
method are based on the recommended sampling and analytical
parameters.
1.2 Limit defining parameters
1.2.1 Detection limit of the analytical
procedure
The DLAP was calculated to be 0.09 ng.
This is the lowest amount of analyte that will give a
detector response that is significantly different from the
response of a reagent blank. (Section 4.1)
1.2.2
Detection limit of the overall procedure
The
detection limit of the overall procedure for PVC filters
is 0.91 ng per sample, binderless quartz fiber filters is
0.67 ng per sample, and 1% NaOH coated binderless quartz
fiber filters is 0.94 ng per sample. This is the lowest
amount of Cr(VI) spiked on the wipe sampler that will give
a detector response that is significantly different from
the response of wipe sampler blanks. (Section 4.2 )
1.2.3 Reliable quantitation limit
The
reliable quantitation limit for PVC filters is 3.04 ng per
sample, binderless quartz fiber filters is 2.23 ng per
sample, and 1% NaOH coated binderless quartz fiber filters
is 3.12 ng per sample. This is the lowest amount of Cr(VI)
spiked on the wipe sampler that will give a detector
response that is considered the lower limit for precise
quantitative measurements. (Section 4.2)
1.2.4
Recovery
The recovery of Cr(VI) from samples
spiked on PVC filters used in a 15-day storage test
remained above 96.4% when the samples were stored at 22ºC.
(Section 4.3)
The recovery of Cr(VI) from samples
spiked on binderless quartz fiber filters used in a 15-day
storage test remained above 96.4 % when the samples were
stored at 22ºC. (Section 4.3)
The recovery of
Cr(VI) from samples spiked with a mixture of
H2SO4 and Cr(VI)(to simulate a
chrome plating operation) on PVC filters, then immediately
placed into a vial containing 5 mL of an aqueous solution
containing 10% Na2CO3 with 2%
NaHCO3, used in a 15-day storage test, remained
above 97.9% when the samples were stored at 22°C. (Section
4.3)
The recovery of Cr(VI) from samples spiked
with a mixture of H2SO4 and
Cr(VI)(to simulate a chrome plating operation) on
binderless quartz fiber filters, then immediately placed
into a vial containing 5 mL of an aqueous solution
containing 10% Na2CO3 with 2%
NaHCO3, used in a 15-day storage test, remained
above 97.9% when the samples were stored at 22ºC. (Section
4.3)
The recovery of Cr(VI) from samples spiked
with a mixture of H2SO4 and
Cr(VI)(to simulate a chrome plating operation) on 1% NaOH
coated binderless quartz fiber filters used in a 15-day
storage test remained above 96.4% when the samples were
stored at 22ºC. (Section 4.3)
1.2.5 Surface
sampler removal efficiency
The removal efficiency
of filters spiked with Cr(VI) at the target concentration
of 0.05 µg/100 cm2 is
96.8% for PVC, 97.7% for binderless quartz fiber filters,
and 97.0% for binderless quartz fiber filters coated with
1% NaOH . This is the percentage of Cr(VI) that was
removed from a sheet of PTFE that was spiked at the target
concentration. (Section 4.4)
1.2.6 Sampling
reproducibility and analytical reproducibility
Six
PTFE surfaces were spiked at the target concentration. A
chemist, other than the one developing the method,
conducted sampling on the PTFE surfaces, with the filters,
as described in Section 2. The test was repeated with a
second chemist performing the sampling. The samples were
analyzed. For the PVC filters the first chemist was able
to achieve a removal efficiency of 96.0%, and the second
chemist was able to achieve a removal efficiency of 95.1%.
(Section 4.6.1) For the binderless quartz fiber filters
the first chemist was able to achieve a removal efficiency
of 95.9%, and the second chemist was able to achieve a
removal efficiency of 96.0%. (Section 4.6.3) For the 1%
NaOH coated binderless quartz fiber filters the first
chemist was able to achieve a removal efficiency of 96.0%,
and the second chemist was able to achieve a removal
efficiency of 96.5%. (Section 4.6.5)
Six samples
spiked on each of the three kinds of filters at the target
concentration by liquid injection were submitted for
analysis by the OSHA Salt Lake Technical Center. The
samples on PVC filters were analyzed according to a draft
copy of this procedure after 13 days of storage at 23ºC,
with an average analytical result of 97.6% of theoretical
(Section 4.6.2). The binderless quartz fiber filters were
analyzed after 5 days of storage at 23ºC and had an
average analytical result was 96.5% of theoretical
(Section 4.6.4). The 1% NaOH coated binderless quartz
fiber filters were analyzed after 9 days of storage at
23ºC, with an average analytical result was 95.8% of
theoretical (Section 4.6.6).
2. Sampling
Procedure
All safety
practices that apply to the work area being sampled should be
followed. Sampling should be conducted in such a manner that
it will not interfere with work performance or safety. It is
important to wear gloves when handling the 1% NaOH coated
binderless quartz fiber filters as the NaOH coating is very
caustic.
2.1 Apparatus
Samples are collected with
37-mm diameter polyvinyl chloride (PVC) filters 5-µm pore size (MSA part # 625413).
On rough surfaces, samples are collected with 37-mm
diameter binderless quartz fiber filters 0.45-mm thick (SKC
part # 225-1809).
In chrome plating operations only,
samples can be collected with 37-mm diameter 1% NaOH coated
binderless quartz fiber filters 0.45-mm thick. (Section 4.9)
The selected gloves are to be resistant to
penetration of the chemical being sampled and any other
chemicals expected to be present. One pair of gloves per
sample taken should be used to avoid cross contamination of
samples.
Labeled vials, 20-mL glass scintillation
vials or other appropriate sized glass vial with PTFE lined
caps, one for each sample.
For samples taken in a
chrome plating operation, 5 mL of an aqueous solution
containing 10% Na2CO3 with 2%
NaHCO3 should be preloaded in the vials, if PVC
or uncoated binderless quartz fiber filters are used for
sampling.
2.2 Reagents
For samples taken in
a chrome plating operation, 5 mL of an aqueous solution
containing 10% Na2CO3 with 2%
NaHCO3 should be preloaded in the vials. (Section
3.2.15)
2.3 Technique
Prepare a sufficient
number of vials, each labeled with a unique number, for the
projected sampling needs.
Prepare a diagram of the
area or rooms to be wipe sampled along with the locations of
key surfaces.
Wear a new pair of clean gloves for
each sample to prevent contamination of future samples as
well as oneself. The selected gloves are to be resistant to
penetration of the chemical being sampled and any other
chemicals expected to be present. PVC gloves are suggested
for sampling Cr(VI) based on a review of a glove
manufacturer's chemical resistivity and degradation
information. Do not wear powdered gloves.
Record the
sample vial number and the location where the sample is
taken.
Remove the filter from the carrying container
with clean PTFE-coated tweezers or plastic tweezers. Do not
use metal tweezers to handle the filters as they will
deposit Cr(VI) onto filters.
Depending on the
purpose of the sample, it may be useful to determine the
surface loading of the contamination (e.g., in micrograms of
analyte per area). For these samples, it is necessary to
record the area of the surface wiped (e.g., 100
cm2). This would not be necessary for samples
taken to simply show the presence of the contaminant.
Surfaces should not be wetted with water as the
water will allow any metal interferences to interact with
the Cr(VI), thereby affecting the results.
Firm
pressure should be applied when wiping. Start at the outside
edge and progress toward the center making concentric
squares of decreasing size. Fold the filter with the
contaminant side inward and repeat.
Without allowing
the filter to come into contact with any other surface, fold
the filter with the exposed side inward. Place the filter in
a sample vial, cap and place a corresponding number at the
sample location on the diagram. Include notes with the
sketch giving any further description that may prove useful
when evaluating the sample results (e.g., a description of
the surface sampled, such as : pencil, doorknob, safety
glasses, lunch table, inside respirator, employee names,
etc.).
PVC and binderless quartz fiber filter
samples taken in a chrome plating operation should be placed
in a vial containing 5 mL of an aqueous solution containing
10% Na2CO3 with 2% NaHCO3
to stabilize the Cr(VI) to field extract them. An alternate
media only for chrome plating operations is a binderless
quartz fiber filter coated with 1% NaOH. The 1% NaOH coated
binderless quartz fiber filters do not require field
extraction. Gloves must be worn when handling these NaOH
coated filters as the NaOH is very caustic.
Submit
at least one blank wipe filter, treated in the same fashion,
but without wiping.
Record sample location,
employees names, surface area (if pertinent), work
description, type of operation, personal protective
equipment, and any other necessary information, along with
any potential interferences on the OSHA-91A form.
Submit the samples to the OSHA Salt Lake Technical
Center together with OSHA-91A forms as soon as possible
after sampling. Ship any bulk samples separate from the
surface samples.
2.4 Extraction efficiency
It is the responsibility of each analytical
laboratory to determine the extraction efficiency because
the wipe sampling media, reagents, and laboratory techniques
may be different than those listed in this evaluation and
could influence the results (Section 4.5).
The mean
extraction efficiency for Cr(VI) from PVC filters over the
range of 0.06 to 10 times the target concentration (3 to 500
nanograms per sample) was 96.6% for samples extracted with
the first extraction buffer (10%
Na2CO3 with 2% NaHCO3) and
96.9% for samples extracted with the second extraction
buffer (5% NaOH with 7.5% Na2CO3),
used for spray paint samples only.
The mean
extraction efficiency for Cr(VI) from binderless quartz
fiber filters over the range of 0.06 to 10 times the target
concentration (3 to 500 nanograms per sample) was 97.3% for
samples extracted with the first extraction buffer (10%
Na2CO3 with 2% NaHCO3) and
96.2% for samples extracted with the second extraction
buffer (5% NaOH with 7.5% Na2CO3),
used for spray paint samples only.
The mean
extraction efficiency for Cr(VI) from 1% NaOH coated
binderless quartz fiber filters over the range of 0.06 to 10
times the target concentration (3 to 500 nanograms per
sample) was 97.3% for samples extracted with the first
extraction buffer (10% Na2CO3 with 2%
NaHCO3) and 96.9% for samples extracted with the
second extraction buffer (5% NaOH with 7.5%
Na2CO3), used for spray paint samples
only.
2.5 Interferences, sampling
Suspected
interferences should be reported to the laboratory with
submitted samples. The interference studies were performed
in OSHA Method ID-215 Cr(VI)(16).
Cr(III) is the major positive interference and Fe(II) is the
major negative interference. In chrome plating operations,
the acid is also a negative interference.
3. Analytical
Procedure
Adhere to the
rules set down in your Chemical Hygiene Plan (17).
Avoid skin contact and inhalation of all chemicals and review
all appropriate MSDSs before beginning the analysis of
samples.
Analyze the samples using the analytical
procedure in OSHA Method ID-215 Hexavalent Chromium. (18)
3.1 Apparatus
3.1.1 Ion chromatograph with a UV-vis detector
and a postcolumn pump. A Dionex 4500i ion chromatograph
with a UV-vis detector, a pneumatic controlled postcolumn
reagent delivery system, and a reaction coil were used in
this evaluation.
3.1.2 IC column and guard column
which can separate Cr(VI) from any potential
interferences. A 250-mm × 4-mm i.d. Dionex IonPac AS7
column and 50-mm × 4-mm i.d. Dionex IonPac NG1 guard
column were used in this evaluation.
3.1.3 A means
to integrate the chromatograms. The Dionex AI450 software,
and a Millennium32 data system were used in
this evaluation.
3.1.4 Automatic sampler. A Dionex
model ASM-2, and sample vials, 0.5-mL, with filter caps
was used in this evaluation.
3.1.5 Volumetric
flasks, pipets, and calibrated micropipets.
3.1.6
Erlenmeyer flasks, 50-mL, for sample digestion.
3.1.7 Micro-analytical balance capable of weighing
at least 0.01 mg.
3.1.8 Polyethylene bottles, 1-L
size or larger, for extraction solutions.
3.1.9
Scintillation vials, glass, 20-mL.
3.1.10 Hotplate
temperature adjustable to 135ºC placed in an exhaust hood.
3.1.11 Equipment for eluent degassing. A vacuum
pump and ultrasonic bath were used for this evaluation.
3.1.12 Optional: Centrifuge for spinning down the
precipitate in samples. 3.2 Reagents
3.2.1 Deionized water 18 Mohm. A Millipore
Milli-Q system was used to prepare the water for this
evaluation.
3.2.2 Sodium carbonate
(NaCO3), reagent grade. Mallinckrodt 99+% lot
7527 KHKC was used in this evaluation.
3.2.3
Sodium bicarbonate (NaHCO3), reagent grade.
Baker Analyzed Reagent 99.9% pure lot D12721 was used in
this evaluation.
3.2.4 Potassium dichromate
(K2Cr2O7), reagent grade.
JT Baker Reagent grade 99% lot 715426 and Acros lot
A010583303 were used in this evaluation.
3.2.5
Magnesium sulfate (MgSO4), anhydrous, reagent
grade. ChemPure Reagent grade 99% lot M172KDHM was used in
this evaluation.
3.2.6 Ammonium sulfate
[(NH4)2SO4], reagent
grade. Aldrich 99+% lot OO427TQ was used in this
evaluation.
3.2.7 Ammonium hydroxide
(NH4OH) 29% solution. Baker analyzed Reagent
28.9% NH4OH lot 611248 was used in this
evaluation.
3.2.8 1,5-Diphenylcarbazide (DPC)
(C6H5NHNHCONHNHC6H5),
reagent grade. Aldrich 99+% lot 03017AR was used in this
evaluation.
3.2.9 Methyl alcohol
(CH3OH), HPLC grade. Fisher Optima 99.9% lot
966306 was used in this evaluation.
3.2.10
Sulfuric acid (H2SO4), concentrated.
JT Baker Instra-analyzed 96.8% lot E24049 was used in this
evaluation.
3.2.11 Nitric acid (HNO3),
concentrated (69-70%). JT Baker Instra-analyzed 69.0-70.0%
lot N46048 was used in this evaluation.
3.2.12
Potassium hydrogenphosphate trihydrate
(K2HPO4·3H2O), reagent
grade. Aldrich 99+% lot 01525MN was used in this
evaluation.
3.2.13 Potassium dihydrogenphosphate
(KH2PO4), reagent grade. Aldrich
99+% lot 06327KQ was used in this evaluation.
3.2.14 Nitric acid solution (10%): In a 1-L flask
place about 500-mL deionized water, add 100 mL
concentrated nitric acid, then fill up to the mark with
deionized water.
3.2.15 Buffer/extraction (BE)
solution ( 2% NaHCO3 with 10%
Na2CO3): In a 1-L flask place about
500-mL deionized water, add 20 g of NaHCO3,
swirl to dissolve, then add 100 g of
Na2CO3, and bring up to the mark
with deionized water. Shake to dissolve or use an
ultrasonic bath. Store in a polyethylene bottle.
3.2.16 Spray-paint extraction (SPE) solution (5%
NaOH with 7.5% Na2CO3): In a 1-L
flask place about 500-mL deionized water, add 50 g of
NaOH, swirl to dissolve, then add 75 g of
Na2CO3, and bring up to the mark
with deionized water. Prepare the solution monthly, and
store in a polyethylene bottle.
3.2.17 Magnesium
sulfate solution: In a 100-mL volumetric flask place about
50 mL deionized water, add 9.9 g of anhydrous magnesium
sulfate, mix well, and bring up to the mark with deionized
water.
3.2.18 Phosphate buffer solution (0.5 M
KH2PO4 with 0.5 M
K2HPO43H2O): In a 1-L
flask place about 500-mL deionized water, add 6.8 g of
KH2PO4 and 11.4 g of
K2HPO43H2O, swirl to
dissolve and bring up to the mark with deionized water.
3.2.19 Phosphate buffer/Mg(II) (PBM) solution: In
a 100-mL beaker place 50 mL of phosphate buffer, then add
25 mL of magnesium sulfate solution, and mix well. Prepare
fresh before each analysis, as this solution is only good
for 4 hours.
3.2.20 Dilute Buffer
Extraction/Phosphate buffer/Mg(II) solution (DBE/PBM
solution): In a 100-mL volumetric flask pipette 50 mL of
BE solution, add 15 mL of PBM solution, bring up to the
mark with deionized water, and mix. A precipitate of
magnesium hydroxide will form and slowly precipitate out
of solution. Allow the precipitation to settle for at
least 60 minutes, or place in a centrifuge at 3,200 rpm
for 5-10 min. Transfer the "clear" solution to a beaker
for use in preparation of working standards. Try to avoid
transfering any precipitate as it will clog the IC.
3.2.21 Eluent [250 mM
(NH4)2SO4 with 100 mM
NH4OH]: In a 1-L flask place about 500 mL of
deionized water, add 6.5 mL of the 29% ammonium hydroxide,
then add 33 g of ammonium sulfate and mix well. Dilute up
to the mark with deionized water. Degas the eluent before
use. In this evaluation, the eluent was degassed with
vacuum while in a ultrasonic bath. Transfer solution to
the eluent container on the IC.
3.2.22 Postcolumn
derivatization reagent (2.0 mM DPC in 90:10 1 N
H2SO4:methyl alcohol): In a 100-mL
volumetric flask place 0.5 g of DPC fill to the mark with
methyl alcohol and mix well. In a 1-L volumetric flask
place about 500 mL deionized water, add 28 mL concentrated
sulfuric acid, mix well, and allow to cool to room
temperature. When the sulfuric acid solution is at room
temperature, add the DPC/methanol solution, bring up to
the mark with deionized water, mix well, and allow to cool
to room temperature before placing in the postcolumn
reservoir. This solution must be at room temperature for
the complete reaction between DPC and Cr(VI). This
solution is stable for 3 days. For the most sensitivity,
this solution must be freshly prepared and be at room
temperature. 3.3 Standard preparation
3.3.1 Wash all glassware in hot water with
detergent, rinse with tap water, followed by deionized
water, 10% nitric acid solution, and finally with two
rinses of deionized water. Under no circumstance
should chromic acid cleaning be used. It is best
if glassware used for the analysis of Cr(VI) is reserved
for this analysis only, so that the maximum sensitivity,
and lack of outside interference can be obtained.
3.3.2 The stock standard solutions of 100 g/mL
Cr(VI) are prepared by dissolving 0.2828 g of
K2Cr2O7 or 0.3735 g of
K2CrO4 in 1 L of deionized water.
(Prepare solution every 3 months.) Two separate stock
solutions should be prepared, from separate sources, and
used to make the dilutions. All dilutions of the stock
solutions are made with DBE/PBM solution to obtain a
working range of 0.3 to 500 ng/mL. Prepare dilutions
monthly. (For example the stock calculation is: (0.2828 g
K2Cr2O7/liter) × (1000
mg/g) × (1000 g/mg) × (L/1000mL) × (MW Cr/MW
K2Cr2O7 = 51.996/294.18)
× (2 moles of Cr in
K2Cr2O7) = 100 g/mL
Cr(VI).)
3.3.3 Bracket sample concentrations with
standard concentrations. If upon analysis, sample
concentrations fall outside the range of prepared
standards, prepare and analyze additional standards to
confirm instrument response, or dilute high samples with
DBE/PBM solution and reanalyze the diluted samples.
3.4 Sample preparation
3.4.1 Wash all glassware in hot water with
detergent, rinse with tap water, deionized water, 10%
nitric acid solution, and finally with two rinses of
deionized water. Under no circumstances should
chromic acid cleaning be used. If possible, this
glassware should be reserved for the analysis of Cr(VI)
only.
3.4.2 Adjust the hotplate temperature to
below the boiling point of the BE solution, near 135°C.
3.4.3 Remove the filter from the vial and place
face or interior of the folds side down in a labeled 50-mL
Erlenmeyer flask. Add 1.5 mL of PBM solution, swirl to wet
the filter, then add 5 mL of BE solution and mix well
before proceeding to the next sample. It is important to
add the PBM solution first, as the freshly precipitated
magnesium hydroxide that forms upon the addition of the BE
solution, suppresses interference from the other metal
ions. This precipitation happens immediately on mixing, so
it is important that all sides of the filter be wetted.
Heat the samples on the hotplate for 60 to 90 minutes,
watching carefully to prevent the samples from boiling or
evaporating to dryness. If the samples boil or evaporate
to dryness the Cr(VI) will change to Cr(III) affecting the
results.
3.4.4 Allow the samples to cool to room
temperature. Quantitatively transfer each solution to a
10-mL volumetric flask using deionized water, and bring up
to the mark with deionized water. Allow the samples to sit
for 1 hour to allow the precipitate to settle, or
centrifuge at 3200 rpm for 5 to 10 minutes. Carefully
transfer the supernatant to the autosampler vial, and make
sure that none of the precipitate is transferred. The
precipitate will clog the IC.
3.4.5 For wipe
samples of paints, a second extraction of the filter, with
a stronger base solution, will be necessary to get the
Cr(VI) out of the solidified paint. The two extractions
are prepared separately, and analyzed separately. The
analytical results of this second extraction are added to
the first extraction to obtain the final result. Again add
1.5 mL of PBM solution to the Erlenmeyer flask, followed
by the SPE solution, mix well and heat on the hotplate 60
to 90 minutes. Cool to room temperature, then
quantitatively transfer the sample to a 25-mL volumetric
flask with deionized water, and bring up to the mark with
deionized water. Allow the samples to sit 1 hour to allow
the precipitate to settle, or centrifuge at 3200 rpm for 5
to 10 minutes. Carefully transfer the supernatant to an
autosampler vial. 3.5 Analysis
3.5.1 Analytical conditions
| IC conditions |
|
| columns: |
IonPac AS7 column,
250-mm × 4-mm i.d. and IonPac NG-1 guard column
50-mm × 4-mm i.d. at ambient temperature |
| flow rate: |
0.7 mL/min |
| eluent: |
250 mM
(NH4)2SO4 with 100
mM NH4OH |
| pump pressure: |
1000 psi |
| postcolumn
derivatization |
|
| solution: |
0.34 mL/min of 2.0 mM
DPC in 90:10 of 1 N
H2SO4:methyl alcohol |
| UV detector: |
540 nm |
| injection size: |
100 L |
| retention
time: |
6.6 min |
| output range: |
0.1 absorbance unit
full scale (AUFS) |
| chromatogram: |
|
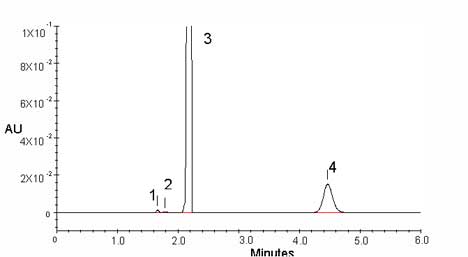
Figure 3.5.1.
Chromatogram of an analytical standard of 50 ng/mL
Cr(VI).(1 and 2= solvent peaks, 3=carbon dioxide
from reaction of buffer and derivatizing solution, 4=
Cr(VI))a
3.5.2 An
external standard (ESTD) calibration procedure is used to
prepare a calibration curve using at least 2 stock
standards, from separate sources, from which dilutions are
made. The calibration curve is prepared daily. The samples
are bracketed with analytical standards.
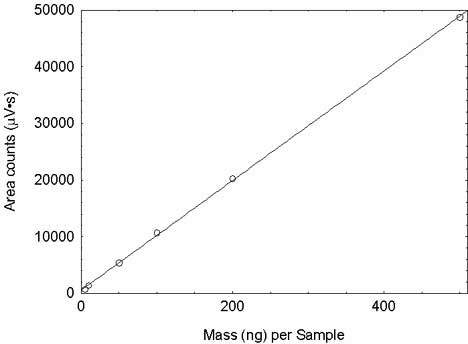
Figure 3.5.2.
Calibration curve of Cr(VI). (Y = 96.7X + 582)
3.6
Interferences (analytical)
3.6.1 Any compound that produces a UV response
and has a similar retention time as Cr(VI) is a potential
interference. If any potential interferences are reported,
they should be considered before samples are extracted.
Generally, chromatographic conditions can be altered to
separate an interference from the analyte.
3.6.2
When necessary, the identity of an analyte peak may be
confirmed with additional analytical data. The possibility
of a coeluting species which does not react with the DPC,
can be tested by injecting the sample with no postcolumn
derivatizing agent being added.
3.6.3 The acid
used in chrome plating operations is an interference.
3.7 Calculations
The amount of
Cr(VI) per sampler is obtained from the appropriate
calibration curve in terms of nanograms per sample,
uncorrected for extraction efficiency. This amount is then
adjusted by subtracting the amount (if any) found on the
blank and corrected for extraction efficiency using the
following formula. If samples were paint samples the results
second extraction of the filter was are also calculated with
the following formula, then both results are added together.
|
|
where |
Ms is the mass recovered from
the sampled surface (µg) |
| |
M is
nanograms per sample |
| |
MB is the mass found on the
blank (ng) |
| |
EE is extraction efficiency, in
decimal form |
| |
CF is
conversion factor of µg/1000
ng | This amount may be expressed as µg Cr(VI) per
100 cm2 if the surface area that was sampled was
provided, by using the following formula.
|
where |
Cs is (µg) of Cr(VI) per 100
cm2 |
|
Ms
is mass on the sampled surface (µg) |
|
S is surface
area sampled (cm2) |
|
100
cm2 is one hundred cubic
centimeters | The surface that was sampled may be less ideal
(more porous, less smooth) than the surface that was used to
evaluate the removal efficiency of the sampling media. In
this circumstance, the media will remove the surface
contaminant less effectively. There may be significant
amounts of contaminant remaining on the surface after
sampling. Nevertheless, the amount found in the sample
indicates that at least this amount of Cr(VI) was present on
the surface. 4.
Backup Data
General
background information about the determination of detection
limits and reproducibility of the overall procedure is found
in the "Evaluation Guidelines for Surface Sampling
Methods".(19)
The Guidelines define analytical parameters, specific
laboratory tests, statistical calculations and acceptance
criteria.
4.1 Detection limit of the analytical procedure
(DLAP) The DLAP was calculated to be 90 picograms per
injection. This is the lowest amount of analyte that will
give a detector response that is significantly different
from the response of a reagent blank. The standards were
prepared in equally descending amounts of 100 picograms from
1000 to 0 picograms, such that the lowest standard had a
peak at least ten times the baseline noise.
Table 4.1
1500 Detection Limit of
the Analytical Procedure |
|
| Mass
Injected (pg) |
area
counts
(µV-s) |
|
| 0 |
0 |
| 100 |
215 |
| 200 |
386 |
| 300 |
509 |
| 400 |
629 |
| 500 |
728 |
| 600 |
831 |
| 700 |
960 |
| 800 |
1169 |
| 900 |
1295 |
| 1000 |
1428 |
|
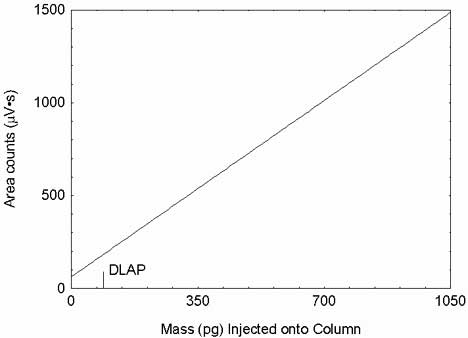
Figure 4.1.
Plot of the data used to determine the DLAP (Y = 1.36X +
63).
4.2 Detection limit
of the overall procedure (DLOP) and reliable quantitation
limit (RQL)
PVC filters
The DLOP is
measured as mass per sample. Ten PVC filters were spiked
with equal descending increments of analyte, such that the
highest sampler loading was 10 ng/sample. These spiked
samplers, and a sample blank were analyzed with the
recommended analytical parameters, and the data obtained
used to calculate the required parameters (standard error of
estimate and the slope) for the calculation of the DLOP.
Values of 131.6 and 40.0 were obtained for the slope and
standard error of estimate respectively. The DLOP was
calculated to be 0.911 ng/sample.
Table 4.2.1
Detection Limit
of
the Overall Procedure |
|
| mass per
sample (ng) |
area
counts
(µV-s) |
|
| 0 |
0 |
| 1 |
209 |
| 2 |
379 |
| 3 |
498 |
| 4 |
615 |
| 5 |
710 |
| 6 |
806 |
| 7 |
938 |
| 8 |
1140 |
| 9 |
1256 |
| 10 |
1386 |
| The RQL is considered the lower limit for
precise quantitative measurements. It is determined from the
regression line parameters obtained for the calculation of
the DLOP, providing 75% to 125% of the analyte is recovered.
The RQL is 3.04 ng per sample. Recovery at this
concentration is 95.1%.
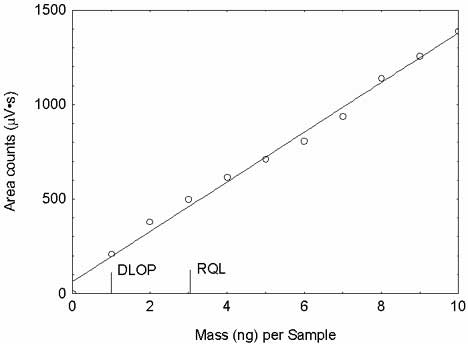
Figure
4.2.1. Plot of dat to determine the DLOP/RQL for PVC
filters. (Y = 132X + 63.7)
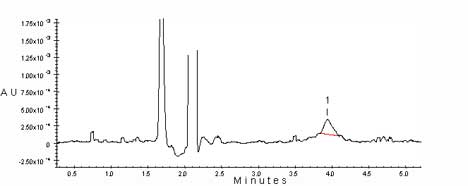
Figure 4.2.2.
Plot of the RQL. (The large peaks that are off scale
are carbon dioxide from the reaction of the buffer with
derivatizing solution. 1 = Cr(VI))
Binderless quartz fiber filters
The
DLOP for the binderless quartz fiber filters was determined
by spiking ten samplers with equal descending increments of
analyte, such that the highest sampler loading was 10
ng/sample. These spiked samplers, and a sample blank were
analyzed with the recommended analytical parameters, and the
data obtained used to calculate the required parameters
(standard error of estimate and the slope) for the
calculation of the DLOP. Values of 137.2 and 56.0 were
obtained for the slope and standard error of estimate
respectively. The DLOP was calculated to be 0.67
ng/sample.
The RQL is considered the lower
limit for precise quantitative measurements. It is
determined from the regression line parameters obtained for
the calculation of the DLOP, providing 75% to 125% of the
analyte is recovered. The RQL is 2.23 ng per sample.
Recovery at this concentration is 94.6%.
Table 4.2.2
Detection Limit of the
Overall Procedure
Binderless Quartz Fiber
Filter |
|
| mass per
sample (ng) |
area
counts
(µV-s) |
|
| 0 |
0 |
| 1 |
201 |
| 2 |
376 |
| 3 |
491 |
| 4 |
602 |
| 5 |
712 |
| 6 |
813 |
| 7 |
943 |
| 8 |
1144 |
| 9 |
1255 |
| 10 |
1399 |
|
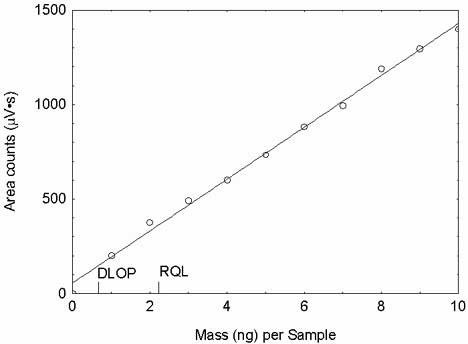
Figure 4.2.3.
Plot of the data used to determine the DLOP/RQL for
binderless quartz fiber filters (Y = 137X + 56).
1% NaOH Coated
Blinderless Quartz Fiber Filters
The
DLOP for the 1% NaOH coated binderless quartz fiber filters
was determined by spiking ten samplers with equal descending
increments of analyte, such that the highest sampler loading
was 10 ng/sample. These spiked samplers, and a sample blank
were analyzed with the recommended analytical parameters,
and the data obtained used to calculate the required
parameters (standard error of estimate and the slope) for
the calculation of the DLOP. Values of 138 and 87.1 were
obtained for the slope and standard error of estimate
respectively. The DLOP was calculated to be 0.937
ng/sample.
The RQL is considered the lower
limit for precise quantitative measurements. It is
determined from the regression line parameters obtained for
the calculation of the DLOP, providing 75% to 125% of the
analyte is recovered. The RQL is 3.12 ng per sample.
Recovery at this concentration is 96.8%.
Table 4.2.3
Detection Limit of the
Overall Procedure
1% NaOH coated Binderless
Quartz Fiber Filter |
|
mass per
sample
(ng) |
area
counts
(µV-s) |
|
| 0 |
0 |
| 1 |
245 |
| 2 |
408 |
| 3 |
534 |
| 4 |
667 |
| 5 |
786 |
| 6 |
897 |
| 7 |
1011 |
| 8 |
1234 |
| 9 |
1324 |
| 10 |
1439 |
|
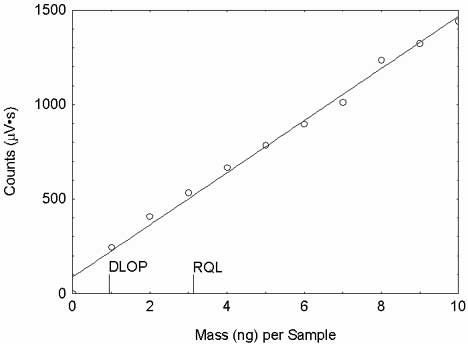
Figure 4.2.4.
Plot of the data used to determine the DLOP/RQL for 1% NaOH
coated binderless quartz fiber filters (Y = 138X + 87.1).
4.3 Storage tests
Cr(VI) spiked on PVC filters
Storage
samples were prepared by spiking PVC filters with Cr(VI).
The PVC filter was spiked with the target concentration of
Cr(VI) and allowed to dry. Twenty-one storage samples were
prepared. Three samples were analyzed on the day of
preparation. Nine of the filters were stored at reduced
temperature (4ºC) and the other nine were stored in a closed
drawer at ambient temperature (about 22ºC). At 5-day
intervals, three samples were selected from each of the two
storage sets and analyzed. Sample results were not corrected
for extraction efficiency. The recoveries at Day 15 were
96.4% at ambient and refrigerated temperature.
Table 4.3.1
Storage Test for Cr(VI) on
PVC Filters |
|
| time
(days) |
ambient storage recovery (%) |
refrigerated storage recovery (%) |
|
| 0 |
98.0 |
97.8 |
97.2 |
98.0 |
97.8 |
97.2 |
| 5 |
96.9 |
95.9 |
96.0 |
96.7 |
97.4 |
95.6 |
| 10 |
95.8 |
96.9 |
96.7 |
97.1 |
98.8 |
95.1 |
| 15 |
97.8 |
97.6 |
94.5 |
95.2 |
96.4 |
97.3 |
|
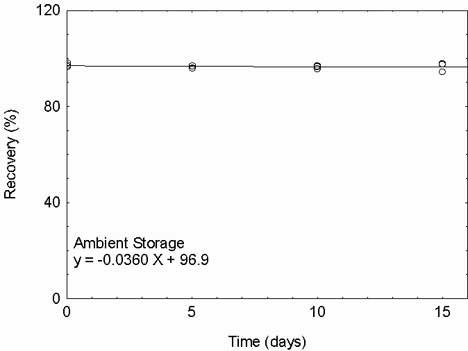
Figure 4.3.1.
Ambient storage test for Cr(VI) spiked on PVC filters.
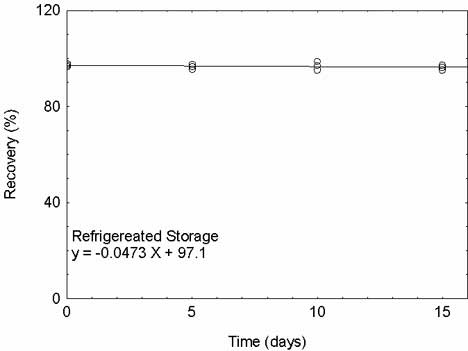
Figure 4.3.2.
Refrigerated storage test for Cr(VI) spiked on PVC filters.
Cr(VI) spiked on
binderless quartz fiber filters.
Storage samples
were prepared by spiking binderless quartz fiber filters
with Cr(VI). The binderless quartz fiber filter was spiked
with the target concentration of Cr(VI) and allowed to dry.
Twenty-one storage samples were prepared. Three samples were
analyzed on the day of preparation. Nine of the filters were
stored at reduced temperature (4ºC) and the other nine were
stored in a closed drawer at ambient temperature (about
22ºC). At 5-day intervals, three samples were selected from
each of the two storage sets and analyzed. Sample results
were not corrected for extraction efficiency. The recoveries
at Day 15 were 96.4% at ambient temperature and 96.2% at
refrigerated temperature.
Table 4.3.2
Storage Test for Cr(VI) on
Binderless Quartz Fiber Filters |
|
| time
(days) |
ambient storage recovery (%) |
refrigerated storage recovery (%) |
|
| 0 |
98.2 |
98.1 |
97.1 |
98.2 |
97.1 |
98.3 |
| 5 |
97.9 |
96.1 |
96.7 |
97.1 |
97.9 |
96.7 |
| 10 |
96.1 |
96.6 |
97.2 |
97.3 |
98.2 |
96.1 |
| 15 |
97.3 |
97.2 |
95.1 |
96.1 |
96.3 |
95.3 |
| 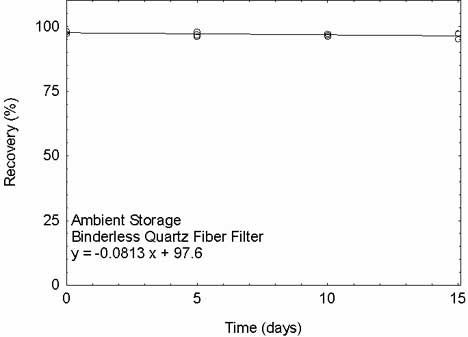
Figure 4.3.3.
Ambient storage test for Cr(VI) spiked on binderless quartz
fiber filters.
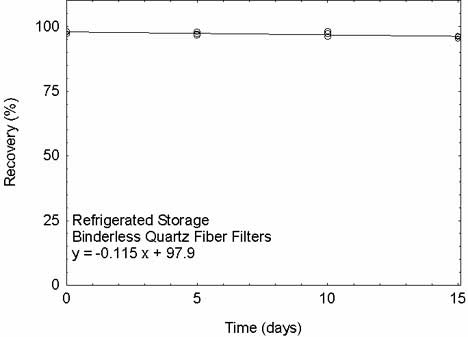
Figure 4.3.4.
Refrigerated storage test for Cr(VI) spiked on binderless
quartz fiber filters.
Cr(VI) and H2SO4
spiked on PVC filters
In chrome plating
environments the presence of acid causes a negative
interference due to reaction between the Cr(VI) and acid to
form Cr(III). Most chrome plating baths contain
H2S04 so a mixture of
H2S04 and Cr(VI) was prepared in water
to spike the filters with. Storage samples were prepared by
spiking PVC filters with Cr(VI) and
H2S04. The PVC filter was spiked with
50 ng of Cr(VI) and 0.5 ng H2SO4 and
allowed to dry. Twenty-one storage samples were prepared.
Three samples were analyzed on the day of preparation. Nine
of the filters were stored at reduced temperature (4ºC) and
the other nine were stored in a closed drawer at ambient
temperature (about 22ºC). At 5-day intervals, three samples
were selected from each of the two storage sets and
analyzed. There was an immediate reaction between the Cr(VI)
and the sulfuric acid, causing some of the Cr(VI) to change
to Cr(III). Results were corrected for this bias. The
results show a recovery of 78.0% on day 15 for samples
stored at ambient temperature, and 81.0% for refrigerated
samples.
Table 4.3.3
Storage Test for
Cr(VI) and H2S04 on PVC
Filters |
|
| time (days) |
refrigerated storage recovery (%) |
refrigerated storage recovery (%) |
|
| 0 |
100.5 |
98.8 |
100.7 |
100.5 |
98.8 |
100.7 |
| 5 |
91.1 |
91.5 |
93.6 |
90.0 |
90.9 |
91.7 |
| 10 |
85.8 |
83.9 |
84.7 |
84.1 |
86.8 |
85.1 |
| 15 |
74.5 |
79.4 |
79.5 |
79.3 |
83.5 |
82.9 |
|
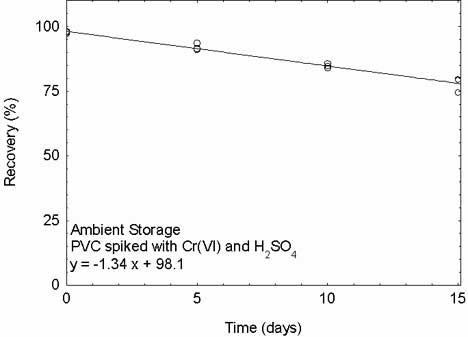
Figure 4.3.5.
Ambient storage test for Cr(VI) and
H2SO4 spiked on PVC filters.
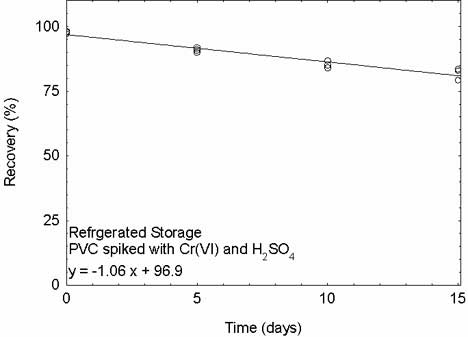
Figure 4.3.6.
Refrigerated storage test for Cr(VI) and
H2SO4 spiked on PVC filters.
Cr(VI) and
H2S04 spiked on PVC filters placed
immediately in 5 mL of an aqueous solution containing 10%
Na2CO3 with 2% NaHCO3
The "Evaluation Guidelines for Surface Sampling
Methods" states that a drop in recovery of greater than 10%
upon storage for 15 days is a significant uncorrectable
bias, and should be avoided.(20)
The recoveries for the PVC filters spiked with Cr(VI)
and H2S04 on day 15 were 78.0% for
ambient and 81.0% for refrigerated samples. To eliminate
this negative bias from the H2S04, the
PVC filters were spiked with Cr(VI) and
H2S04 and then placed into a vial
containing 5 mL of an aquerous solution containing 10%
Na2CO3 with 2% NaHCO3 (BE
buffer) immediately. The PVC filter was spiked with 50 ng of
Cr(VI) and 0.5 ng H2S04. Twenty-one
storage samples were prepared.
Three samples
were analyzed on the day of preparation. Nine of the filters
were stored at reduced temperature (4ºC) and the other nine
were stored in a closed drawer at ambient temperature (about
22ºC). At 5-day intervals, three samples were selected from
each of the two storage sets and analyzed. There was an
immediate reaction between the Cr(VI) and the sulfuric acid,
causing some of the Cr(VI) to change to Cr(III). Results
were corrected for this bias. The recoveries on day 15
were 97.4% for ambient, and 98.0% for refrigerated.
Table 4.3.4
Storage Test for Cr(VI) and
H2SO4
on PVC Filters
and Placed in BE Buffer |
|
| time
(days) |
ambient storage recovery (%) |
refrigerated storage recovery (%) |
|
| 0 |
100.7 |
97.9 |
101.5 |
100.7 |
97.9 |
101.5 |
| 5 |
99.6 |
96.9 |
98.9 |
99.2 |
98.9 |
99.1 |
| 10 |
98.4 |
97.6 |
97.9 |
97.9 |
98.4 |
99.0 |
| 15 |
98.9 |
95.6 |
98.3 |
98.5 |
98.9 |
96.9 |
| 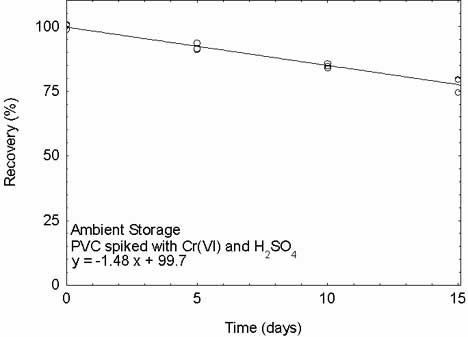
Figure 4.3.7.
Ambient storage test for Cr(VI) and
H2SO4 spiked on PVC filters and stored
in 5 mL BE buffer.
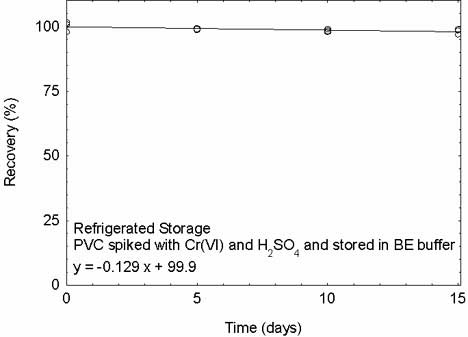
Figure 4.3.8.
Refrigerated storage test for Cr(VI) and
H2SO4 spiked on PVC filters and stored
in 5 mL BE buffer.
Cr(VI)
and H2S04 spiked on binderless quartz
fiber filters
Binderless quartz fiber filters were
spiked with a mixture of H2S04 and
Cr(VI) in water at concentration of 50 ng Cr(VI) and 0.5 ng
H2S04 and allowed to dry. Twenty-one
storage samples were prepared. Three samples were analyzed
on the day of preparation. Nine of the filters were stored
at reduced temperature (4ºC) and the other nine were stored
in a closed drawer at ambient temperature (about 22ºC). At
5-day intervals, three samples were selected from each of
the two storage sets and analyzed. There was an immediate
reaction between the Cr(VI) and the sulfuric acid, causing
some of the Cr(VI) to change to Cr(Ill). Results were
corrected for this bias. The results show a recovery
of 86.1 % on day 15 for samples stored at ambient
temperature, and 88.7% for refrigerated samples.
Table 4.3.5
Storage Test for Cr(VI) and
H2S04
on Binderless
Quartz Fiber Filters |
|
| time
(days) |
ambient storage recovery (%) |
refrigerated storage recovery (%) |
|
|
|
|
| 0 |
100.9 |
99.3 |
99.8 |
100.9 |
99.3 |
99.8 |
| 5 |
94.8 |
93.0 |
95.1 |
96.4 |
93.2 |
95.4 |
| 10 |
90.1 |
91.2 |
89.9 |
93.7 |
92.2 |
93.4 |
| 15 |
85.4 |
86.8 |
86.1 |
87.9 |
89.2 |
87.3 |
| 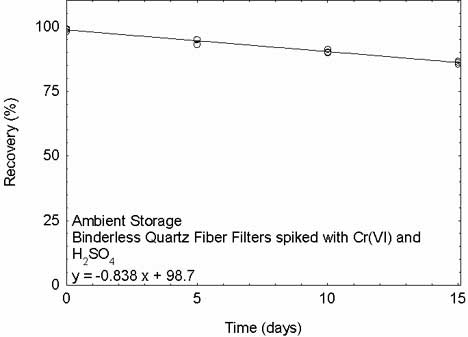
. Figure 4.3.9.
Ambient storage test for Cr(VI) and
H2SO4 spiked on binderless quartz
fiber filters.
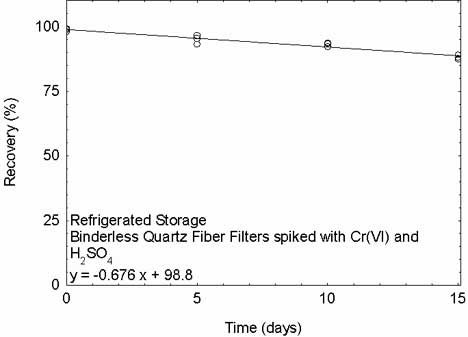
Figure 4.3.10.
Refrigerated storage test for Cr(VI) and
H2SO4 spiked on binderless quartz
fiber filters.
Cr(VI) and
H2S04 spiked on binderless quartz
fiber filter placed immediately in 5 mL of a solution
containing 10% Na2CO3 with 2%
NaHCO3
Because the recoveries for
the binderless quartz fiber filters spiked with the mixture
of Cr(VI) and H2S04 was 86.1 % on day
15 for samples stored at ambient temperature, and 88.7% for
refrigerated samples, placing the filters into 5 mL of an
aqueous solution containing 10% Na2CO3 with 2%
NaHCO3 (BE buffer) immediately after spiking was
performed. The binderless quartz fiber filter was spiked
with 50 ng of Cr(VI) and 0.5 ng H2S04.
Twenty-one storage samples were prepared. Three samples were
analyzed on the day of preparation. Nine of the filters were
stored at reduced temperature (4ºC) and the other nine were
stored in a closed drawer at ambient temperature (about
22ºC). At 5-day intervals, three samples were selected from
each of the two storage sets and analyzed. There was an
immediate reaction between the Cr(VI) and the sulfuric acid,
causing some of the Cr(VI) to change to Cr(Ill). Results
were corrected for this bias. The recoveries on day 15
were 97.9% for ambient and 98.4% for refrigerated samples.
Table 4.3.6
Storage Test for Cr(VI) and
H2S04
on Binderless
Quartz Fiber Filters and Placed in BE Buffer |
|
| time
(days) |
ambient storage recovery (%) |
refrigerated storage recovery (%) |
|
| 0 |
100.8 |
99.9 |
99.3 |
100.8 |
99.9 |
99.3 |
| 5 |
96.9 |
97.9 |
98.9 |
98.8 |
97.9 |
99.3 |
| 10 |
98.4 |
98.5 |
97.9 |
97.9 |
98.9 |
98.5 |
| 15 |
98.3 |
97.5 |
97.6 |
99.1 |
98.1 |
97.9 |
| 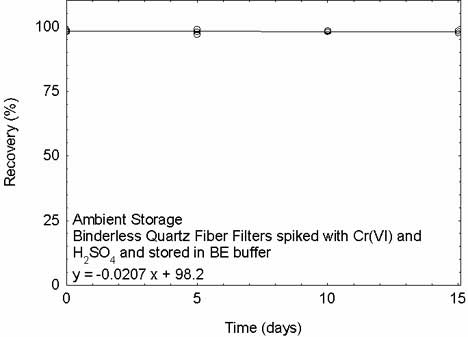
Figure 4.3.11.
Ambient storage test for Cr(VI) and
H2SO4 spiked on binderless quartz
fiber filters and stored in 5 mL BE buffer.
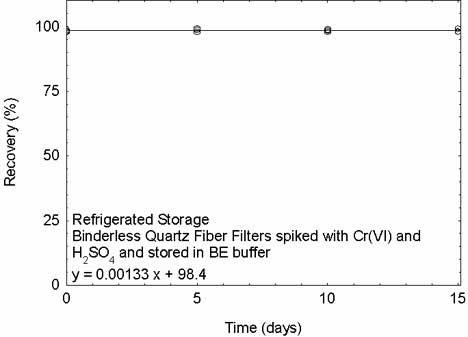
Figure 4.3.12.
Refrigerated storage test for Cr(VI) and
H2SO4 spiked on binderless quartz
fiber filters and stored in 5 mL BE buffer.
Cr(VI) and
H2S04 spiked on 1% NaOH coated
binderless quartz fiber filter
Storage samples
were prepared by spiking 1% NaOH coated binderless quartz
fiber filters with 50 ng Cr(VI) and 0.5 ng
H2S04 and allowed to dry. Twenty-one
storage samples were prepared. Three samples were analyzed
on the day of preparation. Nine of the filters were stored
at reduced temperature (4ºC) and the other nine were stored
in a closed drawer at ambient temperature (about 22ºC). At
5-day intervals, three samples were selected from each of
the two storage sets and analyzed. On Day 15 the recovery
was 96.4% for samples stored at ambient temperature and 96.1
% for samples stored at refrigerated temperature.
Table 4.3.7
Storage Test for Cr(VI) and
H2SO4
on 1 % NaOH Coated binderless Quartz
Fiber Filters |
|
| time
(days) |
ambient storage recovery (%) |
refrigerated storage recovery (%) |
|
| 0 |
100.3 |
99.2 |
99.4 |
100.3 |
99.2 |
99.4 |
| 5 |
97.7 |
99.6 |
100.3 |
99.5 |
97.7 |
98.1 |
| 10 |
98.3 |
98.4 |
98.4 |
98.6 |
95.7 |
97.9 |
| 15 |
94.9 |
97.4 |
96.1 |
96.4 |
95.4 |
96.1 |
|
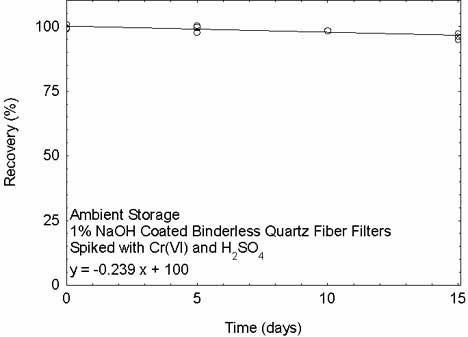
Figure 4.3.13.
Ambient storage test for Cr(VI) and
H2SO4 spiked on 1% NaOH coated
binderless quartz fiber filters.
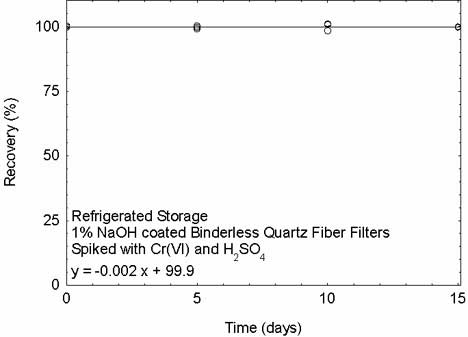
Figure 4.3.14.
Refrigerated storage test for Cr(VI) and
H2SO4 spiked on 1% NaOH coated
binderless quartz fiber filters.
4.4 Sampler removal efficiency
4.4.1 Removal efficiency refers to the ability
of the PVC filters to absorb or otherwise capture surface
contaminants when the filter is moved across a surface
under firm pressure. The surface used to evaluate the
removal efficiency was a PTFE sheet. This type of surface
approaches the smooth and non-porous characteristics of an
ideal surface. The variety of surfaces found in workplaces
will likely be less than ideal, so the media will have a
lower removal efficiency. The amount of analyte found on
the filter after sampling will indicate that at least that
amount was present on the surface that was sampled. Six
surfaces were spiked at the target concentration of
Cr(VI), 0.05 µg/100 cm2. Samples were collected
from each surface using the technique described in Section
2.3 and analyzed. The results are shown in Table 4.4.1.
Table 4.4.1
Sampler Removal Efficiency
Data for Cr(VI) from PTFE using PVC Filters |
|
| theoretical (µg/surface) |
recovered
(µg/sample) |
recovery
(%) |
|
| 0.05 |
0.0490 |
98.0 |
| 0.05 |
0.0491 |
98.2 |
| 0.05 |
0.0488 |
97.6 |
| 0.05 |
0.0476 |
95.2 |
| 0.05 |
0.0479 |
95.8 |
| 0.05 |
0.0482 |
96.4 |
|
4.4.2 Removal efficiency of binderless
quartz fiber filters was determined by placing the Cr(Vl)
on a PTFE sheet. This type of surface approaches the
smooth and non-porous characteristics of an ideal surface.
The variety of surfaces found in workplaces, including
theoretical recovered recovery skin, will likely be less
than ideal. The media will have a lower removal efficiency
on less ideal surfaces. The amount of analyte found on the
filter after sampling will indicate that at least that
amount was present on the surface that was sampled. Six
surfaces were spiked at the target concentration of
Cr(VI), 0.05 µg/100 cm2. Samples were collected
from each surface using the technique described in Section
2.3 and analyzed. The results are shown in Table 4.4.2.
Table 4.4.2
Sampler Removal
Efficiency Data
for Cr(VI) from PTFE
using
Binderless Quartz Fiber Filters |
|
| theoretical (µg/surface) |
recovered
(µg/sample) |
recovery
(%) |
|
| 0.05 |
0.0489 |
97.8 |
| 0.05 |
0.0493 |
98.6 |
| 0.05 |
0.0492 |
98.4 |
| 0.05 |
0.0483 |
96.6 |
| 0.05 |
0.0484 |
96.8 |
| 0.05 |
0.0489 |
97.8 |
|
4.4.3 Removal efficiency of 1% NaOH coated
binderless quartz fiber filters was determined by placing
the Cr(Vl) on a PTFE sheet. This type of surface
approaches the smooth and non-porous characteristics of an
ideal surface. The variety of surfaces found in
workplaces, including skin, will likely be less than
ideal. The media will have a lower removal efficiency on
less ideal surfaces. The amount of analyte found on the
filter after sampling will indicate that at least that
amount was present on the surface that was sampled. Six
surfaces were spiked at the target concentration of
Cr(VI), 0.05 µg/100 cm2. Samples were collected
from each surface using the technique described in Section
2.3 and analyzed. The results are shown in Table 4.4.3.
Table 4.4.3
Sampler Removal
Efficiency
Data for Cr(VI) from
PTFE
using NaOH Coated Binderless Quartz
Fiber Filters |
|
| theoretical (µg/surface) |
recovered
(µg/sample) |
recovery
(%) |
|
| 0.05 |
0.0487 |
97.4 |
| 0.05 |
0.0493 |
98.6 |
| 0.05 |
0.0482 |
96.4 |
| 0.05 |
0.0483 |
96.6 |
| 0.05 |
0.0475 |
95.0 |
| 0.05 |
0.0491 |
98.2 |
|
4.4.4 Removal efficiency shall be calculated
as follows:
| where |
ER
is removal efficiency |
|
AR
is amount of analyte recovered |
|
AS is amount of analyte spiked
on the
surface |
The mean removal efficiency of the six
samples was 96.9% for PVC filters, 97.7% for binderless
quartz fiber filters, and 97.0% for 1% NaOH coated
binderless quartz fiber filters. 4.5 Extraction efficiency
The
extraction efficiencies of Cr(VI) were determined by
liquid-spiking PVC filters with Cr(VI) at concentrations
ranging from the RQL (0.06) to 10 times the target
concentration. These samples were stored overnight at
ambient temperature and then analyzed. The filters were
either extracted and digested with the first, main
extraction solution, BE, or with the second, spray paint
only, SPE solution. The mean extraction efficiency over the
working range of the RQL to 10 times the target
concentration is 96.6% for samples extracted with the first
(main) extraction solvent (BE) and 96.9% for samples
extracted with the second extraction solvent for paint
samples (SPE).
Table 4.5.1
Extraction Efficiency of
Cr(VI)
from PVC Filters Extracted with
BE |
|
level
|
sample number
|
| × target
concn |
ng per
sample |
1 |
2 |
3 |
4 |
mean |
|
| RQL |
3 |
95.4 |
96.6 |
92.7 |
95.5 |
95.1 |
| 0.1 |
5 |
96.4 |
96.5 |
97.9 |
95.9 |
96.7 |
| 1.0 |
50 |
97.8 |
97.2 |
96.7 |
97.6 |
97.3 |
| 10.0 |
500 |
97.4 |
97.8 |
97.0 |
96.1 |
97.1 |
|
Table 4.5.2
Extraction Efficiency of
Cr(VI)
from PVC Filters Extracted with
SPE |
|
level
|
sample number
|
| × target
concn |
ng per
sample |
1 |
2 |
3 |
4 |
mean |
|
| RQL |
3 |
97.8 |
95.0 |
97.3 |
95.5 |
96.4 |
| 0.1 |
5 |
97.5 |
97.1 |
97.6 |
96.0 |
97.1 |
| 1.0 |
50 |
95.9 |
97.5 |
96.3 |
96.1 |
96.5 |
| 10.0 |
500 |
98.0 |
96.4 |
97.1 |
97.9 |
97.4 |
| The extraction efficiencies of Cr(VI) were
determined by liquid-spiking binderless quartz fiber filters
with Cr(VI) at concentrations ranging from the RQL (0.06) to
10 times the target concentration. These samples were stored
overnight at ambient temperature and then analyzed. The
filters were either extracted and digested with the first,
main extraction solution, BE, or with the second, spray
paint only, SPE solution. The mean extraction efficiency
over the working range of the RQL to 10 times the target
concentration is 97.3% for samples extracted with the first
(main) extraction solvent (BE) and 96.2% for samples
extracted with the second extraction solvent for paint
samples (SPE).
Table 4.5.3
Extraction Efficiency of
Cr(VI)
from Binderless Quartz Fiber Filters
Extracted with BE |
|
level
|
sample number
|
| × target
concn |
ng per
sample |
1 |
2 |
3 |
4 |
mean |
|
| RQL |
3 |
96.3 |
95.4 |
95.9 |
96.3 |
96.0 |
| 0.1 |
5 |
97.2 |
96.9 |
96.8 |
97.5 |
97.1 |
| 1.0 |
50 |
98.4 |
97.2 |
98.2 |
97.9 |
97.9 |
| 10.0 |
500 |
97.9 |
98.3 |
98.1 |
98.1 |
98.1 |
|
Table 4.5.4
Extraction Efficiency of
Cr(VI)
from Binderless Quartz Fiber Filters
Extracted with SPE |
|
level
|
sample number
|
| × target
concn |
ng per
sample |
1 |
2 |
3 |
4 |
mean |
|
| RQL |
3 |
96.1 |
95.3 |
95.7 |
96.2 |
95.8 |
| 0.1 |
5 |
97.2 |
96.7 |
96.8 |
95.8 |
96.6 |
| 1.0 |
50 |
97.4 |
96.3 |
95.9 |
95.0 |
96.2 |
| 10.0 |
500 |
96.3 |
95.2 |
97.2 |
96.5 |
96.3 |
| The extraction efficiencies of Cr(VI) were
determined by liquid-spiking 1% NaOH coated binderless
quartz fiber filters with Cr(VI) at concentrations ranging
from the RQL (0.06) to 10 times the target concentration.
These samples were stored overnight at ambient temperature
and then analyzed. The filters were either extracted and
digested with the first, main extraction solution, BE, or
with the second, spray paint only, SPE solution. The mean
extraction efficiency over the working range of the RQL to
10 times the target concentration is 97.3% for samples
extracted with the first (main) extraction solvent (BE) and
96.9% for samples extracted with the second extraction
solvent for paint samples (SPE).
Table 4.5.5
Extraction Efficiency
of Cr(VI) from 1 % NaOH
Coated Binderless
Quartz Fiber Filters Extracted with BE |
|
level
|
sample number
|
| × target
concn |
ng per
sample |
1 |
2 |
3 |
4 |
mean |
|
| RQL |
3 |
97.4 |
95.3 |
97.1 |
96.2 |
96.5 |
| 0.1 |
5 |
96.3 |
97.1 |
96.9 |
97.4 |
96.9 |
| 1.0 |
50 |
98.1 |
95.9 |
98.1 |
98.2 |
97.6 |
| 10.0 |
500 |
97.7 |
98.1 |
97.9 |
98.3 |
98.0 |
|
Table 4.5.6
Extraction Efficiency
of Cr(VI) from 1 % NaOH
Coated Binderless
Quartz Fiber Filters Extracted with SPE |
|
level
|
sample number
|
| × target
concn |
ng per
sample |
1 |
2 |
3 |
4 |
mean |
|
| RQL |
3 |
96.9 |
95.9 |
96.3 |
95.4 |
96.1 |
| 0.1 |
5 |
98.1 |
96.8 |
97.7 |
96.4 |
97.0 |
| 1.0 |
50 |
97.9 |
97.5 |
96.8 |
96.5 |
97.2 |
| 10.0 |
500 |
96.9 |
97.2 |
97.9 |
97.5 |
97.4 |
| 4.6 Reproducibility
4.6.1 Six PTFE surfaces were spiked at
the target level of 50 ng Cr(VI). A chemist, other than
the one developing the method, conducted sampling on the
PTFE surfaces as described in Section 2 using PVC filters.
The test was repeated with a second chemist performing the
sampling. The samples were analyzed. The first chemist was
able to achieve a removal efficiency of 96.0% and the
second chemist 95.1% (Tables 4.6.1.1 and 4.6.1.2).
Table 4.6.1.1
Sampling Reproducibility
Sampling 1st Chemist Samples for Cr(VI) from
PTFE using PVC Filters |
|
Table 4.6.1.2
Sampling Reproducibility
Sampling 2nd Chemist Samples for Cr(VI) from
PTFE using PVC Filters |
|
|
|
| theoretical
(ng/surface) |
recovered
(ng/sample) |
recovery
(%) |
|
theoretical
(ng/surface) |
recovered
(ng/sample) |
recovery
(%) |
|
|
|
| 50 |
48.2 |
96.4 |
|
50 |
46.5 |
93.0 |
| 50 |
48.7 |
97.4 |
|
50 |
47.9 |
95.8 |
| 50 |
48.4 |
96.8 |
|
50 |
48.6 |
97.2 |
| 50 |
47.2 |
94.4 |
|
50 |
48.7 |
97.4 |
| 50 |
48.3 |
96.6 |
|
50 |
46.9 |
93.8 |
| 50 |
47.2 |
94.4 |
|
50 |
46.7 |
93.4 |
|
|
|
4.6.2 Six samples were
prepared by spiking PVC filters in the same manner that
was used in the preparation for the storage study. The
samples were submitted to the OSHA SLTC for analysis. The
samples were analyzed after being stored for 13 days at
23ºC. Sample results were corrected for extraction
efficiency. The average recoverywas97.6%.
Table 4.6.2
Analytical
Reprocibility Data for Cr(VI) using PVC
Filters
|
| 50 |
48.1 |
96.2 |
| 50 |
49.2 |
98.4 |
| 50 |
47.9 |
95.8 |
| 50 |
48.6 |
97.2 |
| 50 |
49.1 |
98.2 |
| 50 |
49.8 |
99.6 |
4.6.3 Six PTFE surfaces were spiked at the
target level of 50 ng Cr(VI). A chemist, other than the
one developing the method, conducted sampling on the PTFE
surfaces as described in Section 2 using binderless quartz
fiber filters. The test was repeated with a second chemist
performing the sampling. The samples were analyzed. The
first chemist was able to achieve a removal efficiency of
95.9% and the second chemist 96.0% (Tables 4.6.3.1 and
4.6.3.2).
Table 4.6.3.1
Sampling
Reproducibility 1st Chemist Samples for Cr(VI) from PTFE
using Binderless Quartz Fiber PTFE Filters |
|
Table 4.6.3.2
Sampling
Reproducibility 2nd Chemist Samples for Cr(VI) from PTFE
using Binderless Quartz Fiber PTFE Filters |
|
|
|
| theoretical (ng/surface) |
recovered (ng/sample) |
recovery (%) |
|
theoretical (ng/surface) |
recovered (ng/sample) |
recovery (%) |
|
|
|
| 50 |
47.2 |
94.4 |
|
50 |
47.5 |
95.0 |
| 50 |
48.9 |
97.8 |
|
50 |
48.6 |
97.2 |
| 50 |
47.1 |
94.2 |
|
50 |
48.3 |
96.6 |
| 50 |
47.5 |
95.0 |
|
50 |
48.8 |
97.6 |
| 50 |
48.8 |
97.6 |
|
50 |
47.1 |
94.2 |
| 50 |
48.4 |
96.8 |
|
50 |
47.7 |
95.4 |
|
|
|
4.6.4 Six samples were
prepared by spiking binderless quartz fiber filters in the
same manner that was used in the preparation for the
storage study. The samples were submitted to the
OSHA SLTC for analysis. The samples were analyzed after
being stored for 5 days at 23ºC. Sample results were
corrected for extraction efficiency. The average recovery
was 96.5%.
Table 4.6.4
Analytical Reproducibility
Data
for Cr(VI) using
Binderless
Quartz Fiber Filters |
|
| theoretical (ng/surface) |
recovered
(ng/sample) |
recovery
(%) |
|
| 50 |
47.3 |
94.6 |
| 50 |
48.4 |
96.8 |
| 50 |
47.9 |
95.8 |
| 50 |
48.2 |
96.4 |
| 50 |
48.8 |
97.6 |
| 50 |
48.9 |
97.8 |
|
4.6.5 Six PTFE surfaces were spiked at the
target level of 50 ng Cr(VI). A chemist, other than the
one developing the method, conducted sampling on the PTFE
surfaces as described in Section 2 using 1% NaOH coated
binderless quartz fiber filters. The test was repeated
with a second chemist performing the sampling. The samples
were analyzed. The first chemist was able to achieve a
removal efficiency of 96.0% and the second chemist 96.5%
(Tables 4.6.5.1 and 4.6.5.2).
Table 4.6.5.1
Sampling
Reproducibility
1st Chemist Samples for Cr(VI)
from PTFE using Binderless Quartz Fiber PTFE Filters |
|
Table 4.6.5.2
Sampling
Reproducibility
2nd Chemist Samples for Cr(VI)
from PTFE using Binderless Quartz Fiber PTFE
Filters |
|
|
|
| theoretical (ng/surface) |
recovered (ng/sample) |
recovery (%) |
|
theoretical (ng/surface) |
recovered (ng/sample) |
recovery (%) |
|
|
|
| 50 |
47.9 |
95.8 |
|
50 |
48.9 |
97.8 |
| 50 |
47.8 |
95.6 |
|
50 |
47.2 |
94.4 |
| 50 |
48.2 |
96.4 |
|
50 |
47.7 |
95.4 |
| 50 |
48.7 |
97.4 |
|
50 |
48.8 |
97.6 |
| 50 |
47.9 |
95.8 |
|
50 |
48.9 |
97.8 |
| 50 |
47.5 |
95.0 |
|
50 |
47.9 |
95.8 |
|
|
|
4.6.6 Six samples were
prepared by spiking 1% NaOH coated binderless quartz fiber
filters in the same manner that was used in the
preparation for the storage study. The samples were
submitted to the OSHA SLTC theoretical recovered recovery
for analysis. The samples were analyzed after being stored
for 9 days at 23ºC. Sample results were corrected for
extraction efficiency. The average recovery was 95.8%.
Table 4.6.6
Analytical
Reproducibility Data
for Cr(VI) on NaOH
Coated Binderless Quartz Fiber Filters |
|
| theoretical (ng/surface) |
recovered (ng/sample) |
recovery (%) |
|
| 50 |
47.4 |
94.8 |
| 50 |
48.2 |
96.4 |
| 50 |
48.8 |
97.6 |
| 50 |
47.1 |
94.2 |
| 50 |
47.6 |
95.2 |
| 50 |
48.4 |
96.8 |
| 4.7 Interferences (sampling)
Suspected
interferences should be reported to the laboratory with
submitted samples. The interference studies were performed
in Method ID-215 Hexavalent Chromium, and should be
consulted for specific information about the metal species
of interest(21).
The major positive interference is Cr(III), which can be
oxidized to Cr(VI). The major negative interference is
Fe(II), which can reduce the Cr(VI) to Cr(III). Other
reducing metal species can also change Cr(VI) to
Cr(III).
In chrome plating operations the acid
is a negative interference, and samples taken on PVC or
uncoated binderless quartz fiber filters must be placed into
a vial containing a solution of 10%
Na2CO3 with 2% NaHCO3, or
the 1% NaOH coated binderless quartz fiber filters should be
used.
4.8 Confirmation
The
presence of Cr(VI) can be confirmed by a second column
analysis using a different column packing, ICP-mass spec, or
by reanalyzing the samples without the addition of the
postcolumn derivatizing solution. To confirm the sample
without the addition of the post column derivatizing
solution, a solution of 90:10 0.1 N
H2S04:methyl alcohol is substituted
for the derivatizing solution, and the sample is rerun under
the same conditions it was first analyzed under. If a peak
appears at the same retention time as the hexavalent
chromium, it is an interference, but conversely, if no peak
appears, the original peak was all hexavalent
chromium.
4.9 Preparation of the 1% NaOH
coated binderless quartz fiber filters
The 1%
NaOH coated binderless quartz fiber filters are prepared by
placing binderless quartz fiber filters in a single layer in
a shallow pan containing 1 N NaOH overnight. They were
removed and placed on a PTFE sheet to dry for four hours.
Twelve dry filters were placed into a sealed jar and stored
for up to 60 days, and another twelve dry filters were
placed into a jar, a stream of nitrogen was blown into the
jar for 1 minute to blanket the filters, and then sealed and
stored for up to 67 days. The filters were analyzed by acid
titration after 29 and 67 days to determine the available
hydroxide ion. The filters stored under nitrogen stored the
best, with recoveries of 95.6% for 29 days and 90.8% for 67
days. Filters stored with air were barely acceptable for 29
days, 84.0% recovery, but those stored for 67 days lost too
much of the hydroxide ion, 65.6% recovery. These results
indicate that the filters should be used within a month of
preparation, unless they are stored under nitrogen, then
they can be stored two months.
Table 4.9
Storage of 1% NaOH
coated Binderless Quartz Fiber Filter |
|
filter storage
|
sample number
|
| type of
gas over filters |
days
stored |
1 |
2 |
3 |
4 |
mean |
|
| air |
30 |
83.2 |
85.4 |
84.9 |
82.8 |
84.0 |
| air |
60 |
63.0 |
68.6 |
64.5 |
66.3 |
65.6 |
| nitrogen |
30 |
95.4 |
96.6 |
94.9 |
95.4 |
95.6 |
| nitrogen |
60 |
90.2 |
90.9 |
90.6 |
91.4 |
90.8 |
|
1
Lawrence R. Evaluation Guidelines for
Surface Sampling Methods; OSHA Salt Lake Technical
Center, U.S. Department of Labor: Salt Lake City, UT, 2001,
unpublished.
2 Ku, J., Eide, M.,
ID-215 Hexavalent Chromium, 1998, http://www.osha.gov,
(accessed May 2000).
3 Ku, J.,
Eide, M., ID-215 Hexavalent Chromium, 1998,
http://www.osha.gov, (accessed May 2000).
4 Ku, J., Eide, M., ID-215 Hexavalent
Chromium, 1998, http://www.osha.gov, (accessed May 2000).
5 Foster, R., Usher, J., and Howe,
A. Hexavalent Chromium in Chromium Plating Mists, 1998, MDHS
method 52/3, Health and Safety Executive, Sheffield UK.
6 Toxicological
Profile for Chromium (update), draft for public
comment, U.S. Department of Health and Human Services,
Public Health Service, Agency for Toxic Sunstances and
Disease Registry, 1998, p 97.
7
Toxicological Profile for Chromium
(update), draft for public comment, U.S. Department
of Health and Human Services, Public Health Service, Agency
for Toxic Sunstances and Disease Registry, 1998, p 105.
8 Documentation
of the Threshold Limit Values and Biological Exposure
Indices, 6th ed,; American Conference of Governmental
Industrial Hygienists, Inc.: Cincinnati, OH, 1991, Vol II,
p.313.
9 Documentation of the Threshold Limit Values and
Biological Exposure Indices, Supplement to the Sixth
Edition, American Conference of Governmental
Industrial Hygienists, Inc.: Cincinnati, OH, 1996, p
Supplement :Chromium - 1.
10 Documentation of the Threshold Limit Values and
Biological Exposure Indices, 6th ed,; American
Conference of Governmental Industrial Hygienists, Inc.:
Cincinnati, OH, 1991, Vol.III, p BEI-69.
11 Documentation of the
Threshold Limit Values and Biological Exposure Indices,
6th ed,; American Conference of Governmental
Industrial Hygienists, Inc.: Cincinnati, OH, 1991 Vol. 1, pp
312-315.
12 Budavari, S., The Merck Index, 12th ed., Merck &
Co. Inc.: Whitehouse Station, NJ, 1996, p 375.
13 Ku, J., Eide, M., ID-215 Hexavalent
Chromium, 1998, http://www.osha.gov, (accessed May 2000).
14 OSHA Computerized Information
System Database, Chemical Sampling Information,
http://www.osha.gov, (accessed May 2000).
15 Lawrence R. Evaluation
Guidelines for Surface Sampling Methods; OSHA Salt
Lake Technical Center, U.S. Department of Labor: Salt Lake
City, UT, 2001, unpublished.
16
Ku, J., Eide, M., ID-215 Hexavalent Chromium, 1998,
http://www.osha.gov, (accessed May 2000).
17 Occupational Exposure to Chemicals in
Laboratories. Code of Federal Regulations, Part 1910.1450,
Title 29, 1998; http://www.osha-slc.gov/,
standards, 5/12/2000.
18 Ku, J.,
Eide, M., ID-215 Hexavalent Chromium, 1998,
http://www.osha.gov, (accessed May 2000).
19 Lawrence R. Evaluation
Guidelines for Surface Sampling Methods; OSHA Salt
Lake Technical Center, U.S. Department of Labor: Salt Lake
City, UT, 2001, unpublished.
20
Lawrence R. Evaluation Guidelines for
Surface Sampling Methods; OSHA Salt Lake Technical
Center, U.S. Department of Labor: Salt Lake City, UT, 2001,
unpublished.
21 Ku, J., Eide, M.,
ID-215 Hexavalent Chromium, 1998, http://www.osha.gov,
(accessed May 2000).
| |

