o-TOLUIDINE
m-TOLUIDINE
p-TOLUIDINE
| Method no.: | 73 | |||||||||
| Matrix: | Air | |||||||||
| Procedure: | Samples are collected closed-face by drawing known
volumes of air through sampling devices consisting of three-piece
cassettes, each containing two sulfuric | |||||||||
| Recommended air volume and sampling rate: |
100 L at 1 L/min | |||||||||
| ||||||||||
| Target conc.: ppm (mg/m3) |
| |||||||||
| Reliable quantitation limits:ppb (µg/m3) (based on a 100-L air volume) |
| |||||||||
| Standard errors of estimate at the target concentration: (Section 4.7.) |
| |||||||||
| ||||||||||
| Status of method: | Evaluated method. This method has been subjected to the established evaluation procedures of the Organic Methods Evaluation Branch. | |||||||||
| Date: August 1988 | Chemist: Carl J. Elskamp | |||||||||
OSHA Analytical Laboratory
Salt Lake City, Utah
1. General Discussion
- 1.1. Background
- 1.1.1. History
The previous OSHA-recommended procedure (Ref. 5.1.)
for collection of air samples for o- and
Methodology exists which has previously been validated by the
OSHA Analytical Laboratory for a number of other aromatic amines.
(Ref. 5.3.
- 5.5.)
The collection of air samples had involved
The derivatives are determined by capillary gas chromatography using an electron capture detector.
Based on two modifications of this methodology, a sampling and
analytical procedure for o-, m-, and
1.1.2. Toxic effects (This section is for information only and should not be taken as the basis of OSHA policy.)
All three isomers of toluidine can cause anoxia (due to formation
of methemoglobin) and hematuria in man. Exposure can occur from
inhalation of the vapors or by skin absorption. In numerous
epidemiological studies, it was found that there was an increased
incidence of bladder cancer in workers exposed to
All three isomers have been assigned a TLV of 2 ppm with a "skin"
notation. Both o- and
1.1.3. Potential workplace exposure
The major uses of toluidine are as intermediates in the synthesis of dyestuffs, rubber chemicals, pharmaceuticals, and pesticides. (Ref. 5.6.)
1.1.4. Physical properties and other descriptive information (Ref. 5.9.)
|
| ||||||
|
| ||||||
| CAS no.: | 95-53-4 | 108-44-1 | 106-49-0 | |||
| molecular weight: | 107.2 | 107.2 | 107.2 | |||
| boiling point: | 199.7°C | 203.3°C | 200.4°C | |||
| melting point: | -16.3°C | -50.5°C | 44.5°C | |||
| description: | colorless liquid | colorless liquid | colorless leaflets | |||
| specific gravity: | 1.004 @ 20°C/4°C | 0.989 @ 20°/4°C | 1.046 @ 20°/4°C | |||
| vapor pressure: | 133 Pa @ 44°C | 133 Pa @ 41°C | 133 Pa @ 42°C | |||
| vapor density: | 3.69 (air=1) | 3.90 (air=1) | 3.90 (air=1) | |||
| flash point: | 185°F (CC) | 188°F (CC) | ||||
| autoignition temperature: |
900°F |
900°F | ||||
| synonyms: | o-methyl-aniline; 2-methyl-aniline; o-amino-toluene; 2-amino-toluene |
m-methyl-aniline; 3-methyl-aniline; m-amino-toluene; 3-amino-toluene |
p-methyl-aniline; 4-methyl-aniline; p-amino-toluene; 4-amino-toluene | |||
|
| ||||||
| structural formula: | ||||||
| ||||||
The analyte air concentrations throughout this method are based on the recommended sampling and analytical parameters. Air concentrations listed in ppm and ppb are referenced to 25°C and 760 mm Hg. Although the derivatives of the amines are analyzed, the equivalent masses of the amines are listed throughout the method.
1.2. Limit defining parameters
- 1.2.1. Detection limit of the analytical procedure
The detection limits of the analytical procedure are 15.2, 12.3,
and 8.6 fg per injection for o-, m-, and
1.2.2. Detection limit of the overall procedure
The detection limits of the overall procedure are 97.0, 79.0, and
55.3 ng per sample for o-, m-, and
1.2.3. Reliable quantitation limit
The reliable quantitation limits are 97.0, 79.0, and 55.3 ng per
sample for o-, m-, and
The reliable quantitation limits and detection limits reported in this method are based upon optimization of the instrument for the smallest possible amount of analyte. When the target concentration of an analyte is exceptionally higher than these limits, they may not be attainable at the routine operating parameters.
- 1.2.4. Instrument response to the analyte
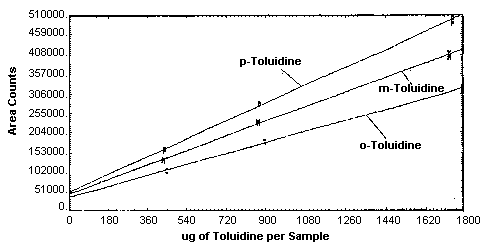
The instrument response over concentration ranges representing 0.5 to 2 times the target concentrations is linear for all three analytes. (Section 4.4.)
1.2.5. Recovery
The recoveries of o-, m-, and
1.2.6. Precision (analytical method only)
The pooled coefficient of variation obtained from replicate injections of analytical standards at 0.5, 1, and 2 times the target concentrations is 0.014 for all three isomers. (Section 4.6.)
1.2.7. Precision (overall procedure)
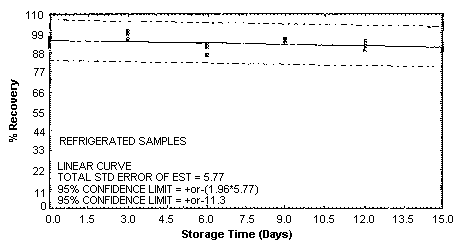
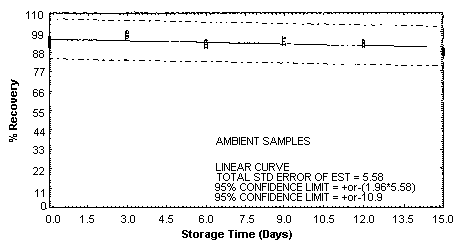
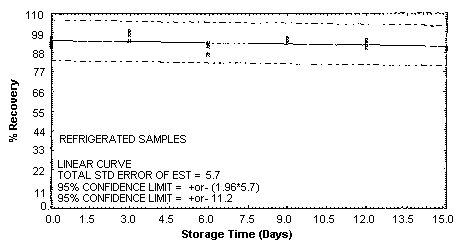
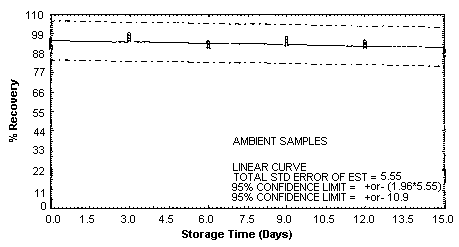
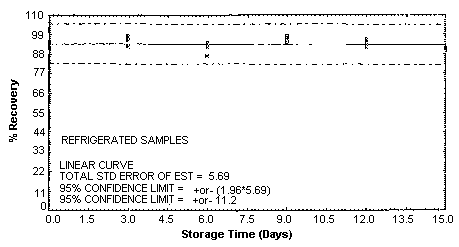
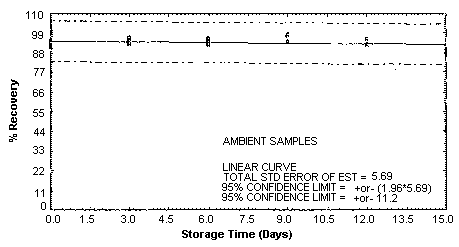
The precisions at the 95% confidence level for the 15-day storage
test are ±10.9, ±10.9, and ±11.2% for o-, m-, and
1.2.8. Reproducibility
Six samples, spiked by liquid injection, and a draft copy of this procedure were given to a chemist unassociated with this evaluation. The samples were analyzed after 17 days of storage at approximately 21°C. No individual sample result deviated from its theoretical value by more than the precision of the overall procedure as reported in Section 1.2.7.(Section 4.8.)
1.3. Advantages
- 1.3.1. The
1.3.2. The analysis is rapid, sensitive, and precise.
1.4. Disadvantages
None
2. Sampling Procedure
- 2.1. Apparatus
- 2.1.1. Samples are collected using a personal sampling pump that
can be calibrated within ±5% of the recommended flow rate with the
sampling device attached.
2.1.2. Samples are collected closed-face using a sampling device
consisting of two sulfuric
2.2. Reagents
None required
2.3. Sampling technique
- 2.3.1. Remove the plastic plugs from the sampling device
immediately before sampling,
2.3.2. Attach the sampling device to the sampling pump with flexible tubing and place the device in the employee's breathing zone.
2.3.3. Seal the sampling device with the plastic plugs immediately after sampling.
2.3.4. Seal and identify each sampling device with an OSHA Form 21.
2.3.5. Submit at least one blank sampling device with each sample set. Handle the blanks in the same manner as the air samples, but draw no air through them.
2.3.6. Record the volume of air sampled (in liters) for each sample, along with any potential interferences.
2.4. Collection efficiency
- 2.4.1. Generation apparatus
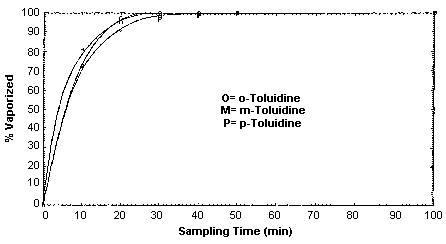
Collection efficiency studies were conducted by drawing air through sampling devices that were attached to empty impingers. Microliter amounts of toluidine standards (in toluene) were injected into the impingers before sampling commenced. The inlets of the impingers were attached to a humid air generator so air at approximately 80% relative humidity could be drawn through the generation apparatus. The sample generations were done at room temperature. It was found that a majority of the toluidine was flushed from the impinger and collected in the first 30 to 40 min of, sampling at 1 L/min, with 70-80% flushed in the first 10 min. (Section 4.9.)
2.4.2. Collection efficiency at 2 times the target concentration
Three individual collection efficiencies were determined at 2
times the target concentration for each analyte. This was done by
adding an amount of the toluidine isomer of interest, which was
equivalent to 4 ppm for a 100-L air sample (approximately 1750 µg),
to each impinger before sampling at 1 L/min for 100 min. The average
collection efficiency was 99.4 (SD = 2.1), 100.6 (SD = 3.3), and
95.7% (SD = 1.5) for o-, m-, and
2.4.3. Collection efficiency at 10 times the target concentration
A collection efficiency determination was also made in a similar
manner at 10 times the target concentration (20 ppm for 100 L or
approximately 8760 µg) for each analyte. The combined collection
efficiency of the front and back filter was 97.8, 103.8, and 97.6%
for o-, m-, and
2.5. Extraction efficiency
- 2.5.1. The average extraction efficiencies from six filters for
each amine spiked at the target concentration were 99.3, 99.0, and
98.4% for o-, m-, and
2.5.2. The stability of extracted and derivatized samples was
verified by reanalyzing the above samples 24 h later using fresh
standards. The average extraction efficiencies for the reanalyzed
samples were 101.2, 100.8, and 100.2% for o-, m-, and
2.6. Recommended air volume and sampling rate
- 2.6.1. The recommended air volume is 100 L.
2.6.2. "The recommended sampling rate is 1 L/min.
2.6.3. If a smaller air volume is desired, the reliable
quantitation limits will be larger. For example, the reliable
quantitation limit for
2.7. Interferences (sampling)
- 2.7.1. Any compound in the sampled air that will react with the
sulfuric acid on the treated filters or with the collected analyte
is a potential sampling interference.
2.7.2. Suspected interferences should be reported to the laboratory with submitted samples.
2.8. Safety precautions (sampling)
- 2.8.1. Attach the sampling equipment to the employees so that it
will not interfere with work performance or safety.
2.8.2. Follow all safety procedures that apply to the work area being sampled.
3. Analytical Procedure
- 3.1. Apparatus
- 3.1.1. A GC equipped with an electron capture detector. For this
evaluation, a Hewlett-Packard 5890A Gas Chromatograph equipped with
a Nickel 63 electron capture detector and a 7673A Automatic Sampler
was used.
3.1.2. A GC column capable of separating the amine derivatives from the solvent and interferences. A 15-m × 0.32-mm i.d. (1.0-µm film) SPB-5 fused silica capillary column purchased from Supelco, Inc. was used in this evaluation.
3.1.3. An electronic integrator or some other suitable means of measuring peak areas or heights. A Hewlett-Packard 18652A A/D converter interfaced to a Hewlett-Packard 3357 Lab Automation Data System was used in this evaluation.
3.1.4. Small resealable glass vials with Teflon-lined caps capable of holding at least 5 mL. Glass, 7-mL scintillation vials are recommended.
3.1.5. Small resealable glass vials with Teflon-lined caps capable of holding 4 mL. WISP autosampler vials are recommended.
3.1.6. A dispenser or pipet for toluene capable of delivering 2.0 mL.
3.1.7. Pipets (or repetitive pipets with plastic or Teflon tips) for dispensing the sodium hydroxide and buffer solutions, capable of delivering 3 mL and 1 mL, respectively.
3.1.8. Repetitive pipets, one to deliver 25 µL of HFAA and one to transfer 25 µL aliquots of standards and samples.
3.2. Reagents
- 3.2.1. Saturated and 0.17 N Na0H solutions, prepared from
reagent grade sodium hydroxide.
3.2.2. Toluene. American Burdick and Jackson "High Purity Solvent" brand toluene was used.
3.2.3. Heptafluorobutyric acid anhydride (HFAA). HFAA from Pierce Chemical Company was used.
3.2.4. Phosphate buffer, prepared from 136 g of reagent-grade potassium dihydrogen phosphate and deionized water. The pH is adjusted to 7.0 with the saturated sodium hydroxide solution. The final volume is adjusted to 1.0 L with deionized water.
3.2.5. Toluidine, reagent grade. The three isomers used in this evaluation were purchased from Aldrich Chemical Company, Inc., Milwaukee WI.
3.3. Standard preparation
- 3.3.1. CAUTION. FOR SAFE LABORATORY PRACTICE, THESE AROMATIC
AMINES SHOULD BE CONSIDERED CARCINOGENIC TO HUMANS. Restrict the use
of pure compounds and concentrated standards to regulated areas.
Prepare concentrated stock standards by diluting the pure amines
with toluene. Stock standards appear to be stable for at least three
months when refrigerated.
3.3.2. Prepare analytical standards by injecting microliter amounts of diluted stock standards into 4-mL vials containing 2.0 mL of toluene.
3.3.3. Transfer 25-µL aliquots of the analytical standards to 4-mL vials containing 2.0 mL of toluene.
3.3.4. Add 25 µL of HFAA to each vial. Recap and shake the vials for 10 s.
3.3.5. After allowing 10 min for the derivatives to form, add 1 mL of the phosphate buffer to each vial to destroy the excess HFAA and to extract the heptafluorobutyric acid that is formed.
3.3.6. Recap and shake the vials for 10 s.
3.3.7. After allowing the two layers to separate, analyze the toluene (upper) layer of each standard by GC.
3.3.8. Bracket sample concentrations with analytical standard concentrations. If sample concentrations are higher than the upper range of prepared standards, prepare additional standards to ascertain detector response or derivatize a smaller aliquot of the toluene extract of the high samples.
3.4. Sample preparation
- 3.4.1. Transfer the sample filters to individual 7-mL
scintillation vials.
3.4.2. Add 3 mL of 0.17 N Na0H and 2.0 mL of toluene to each vial.
3.4.3. Recap and shake the vials end-to-end for 10 min.
3.4.4. Allow the layers to separate and transfer a 25-µL aliquot of the toluene layer of each sample to separate 4-mL vials, each containing 2.0 mL of toluene.
3.4.5. Add 25 µL of HFAA to each vial. Recap and shake the vials for 10 s.
3.4.6. After allowing 10 min for the derivatives to form, add 1 mL of the phosphate buffer to each vial to destroy the excess HFAA and to extract the heptafluorobutyric acid that is formed.
3.4.7. Recap and shake the vials for 10 s.
3.4.8. After allowing the two layers to separate, analyze the toluene (upper) layer of each sample by GC.
3.5. Analysis
- 3.5.1. GC conditions and information
| zone temperatures: |
| ||||||
| gas flows: |
| ||||||
| injection volume: | 1.0 µL | ||||||
| split ratio: | 40:1 | ||||||
| column: | SPB-5, 1.0-µm film, 15 m × 0.32-mm i.d. fused silica (Supelco, Inc.) | ||||||
| retention times of derivatives: |
| ||||||
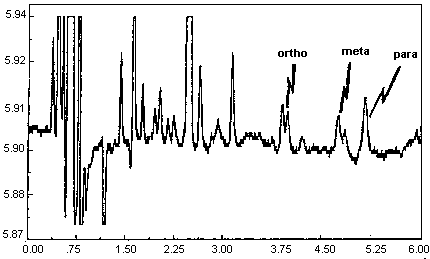
| chromatogram: | Section 4.11. |
3.5.2. Measure peak areas or heights by use of an integrator or by other suitable means.
3.5.3. Construct a calibration curve by plotting response (peak areas or heights) of standard injections versus micrograms of analyte per sample. Bracket sample concentrations with standards.
3.6. Interferences (analytical)
- 3.6.1. Any compound that elutes in the same general time as the
HFAA derivative of the amine of interest is a potential
interference. Suspected interferences reported to the laboratory
with submitted samples by the industrial hygienist must be
considered before samples are derivatized.
3.6.2. GC parameters may be changed to possibly circumvent interferences.
3.6.3. Retention time on a single column is not considered proof of chemical identity. Analyte identity should be confirmed by GC/MS if possible.
3.7. Calculations
The analyte concentration for samples is obtained from the calibration curve in micrograms of analyte per sample. If any analyte is found on any back filter, that amount is added to the amount found on the corresponding front filter. If any analyte is found on the blank filters, the combined amount is subtracted from the sample amounts. The air concentrations are calculated using the following formulae.
| µg/m3 = | (micrograms of analyte per
sample) (1000)
(liters of air sampled) (extraction efficiency) |
| where extraction efficiencies are: | 99.3% | |
| 99.0% | ||
| 98.4% |
| where | 24.46 is the molar volume (liters) at 25°C and
760 mm Hg 107.2 is the molecular weight of toluidine |
3.8. Safety precautions (analytical)
- 3.8.1. CAUTION. FOR SAFE LABORATORY PRACTICE, THESE AROMATIC
AMINES SHOULD BE CONSIDERED CARCINOGENIC TO HUMANS. Restrict the use
of pure compounds and concentrated standards to regulated areas.
Avoid skin contact and inhalation of all chemicals.
3.8.2. Use all chemicals to a fume hood if possible.
3.8.3. Wear safety glasses and a lab coat at all times while in the lab area.
4. Backup Data
- 4.1. Detection limit of the analytical procedure
The injection volume listed in Section 3.5.1.,
1.0 µL with a 40:1 split, was used in the determination of the
detection limits of the analytical procedure. The detection limits of
15.2 fg of
4.2. Detection limit of the overall procedure
The detection limits of the overall procedure were determined by
analyzing filters spiked with loadings equivalent to the detection
limits of the analytical procedure. Samples were prepared by injecting
97.0 ng of
Detection Limit of the Overall Procedure for o-Toluidine
|
| ||
| sample no. | ng spiked | ng recovered |
|
| ||
| 1 | 97.0 | 91.9 |
| 2 | 97.0 | 99.7 |
| 3 | 97.0 | 112.4 |
| 4 | 97.0 | 110.4 |
| 5 | 97.0 | 93.0 |
| 6 | 97.0 | 99.4 |
|
| ||
Limit of the Overall Procedure for
m-Toluidine
|
| ||
| sample no. | ng spiked | ng recovered |
|
| ||
| 1 | 79.0 | 73.9 |
| 2 | 79.0 | 82.5 |
| 3 | 79.0 | 95.0 |
| 4 | 79.0 | 92.9 |
| 5 | 79.0 | 76.3 |
| 6 | 79.0 | 82.7 |
|
| ||
Detection Limit of the Overall Procedure for
p-Toluidine
|
| ||
| sample no. | ng spiked | ng recovered |
|
| ||
| 1 | 55.3 | 52.4 |
| 2 | 55.3 | 60.0 |
| 3 | 55.3 | 66.0 |
| 4 | 55.3 | 68.0 |
| 5 | 55.3 | 55.0 |
| 6 | 55.3 | 59.4 |
|
| ||
4.3. Reliable quantitation limit
The reliable quantitation limits were determined by analyzing
filters spiked with loadings equivalent to the detection limits of the
analytical procedure. Samples were prepared by injecting 97.0 ng of
Reliable Quantitation Limit for o-Toluidine
(Based on samples and data of Table 4.2.1.)
|
| ||||
| sample | % recovered | statistics | ||
|
| ||||
| 1 | 94.7 | = | 104.3 | |
| 2 | 102.8 | |||
| 3 | 115.9 | |||
| 4 | 113.8 | SD | = | 8.9 |
| 5 | 95.9 | precision | = | (1.96)(±8.9) |
| 6 | 102.5 | = | ±17.4 | |
|
| ||||
Reliable Quantitation Limit for m-Toluidine
(Based on samples and data of Table 4.2.2.)
|
| ||||
| sample | % recovered | statistics | ||
|
| ||||
| 1 | 93.5 | = | 106.2 | |
| 2 | 104.4 | |||
| 3 | 120.2 | |||
| 4 | 117.6 | SD | = | 10.8 |
| 5 | 96.6 | precision | = | (1.96)(±10.8) |
| 6 | 104.7 | = | ±21.2 | |
|
| ||||
Reliable Quantitation Limit for p-Toluidine
(Based on samples and data of Table 4.2.3.)
|
| ||||
| sample | % recovered | statistics | ||
|
| ||||
| 1 | 94.8 | = | 108.8 | |
| 2 | 108.5 | |||
| 3 | 119.3 | |||
| 4 | 123.0 | SD | = | 10.9 |
| 5 | 99.5 | precision | = | (1.96)(±10.9) |
| 6 | 107.4 | = | ±21.4 | |
|
| ||||
4.4. Instrument response to the analyte
The instrument response to the analytes over the range of 0.5 to 2
times the target concentrations was determined from multiple
injections of analytical standards. These data are given in Tables
4.4.1. - 4.4.3. and Figure
4.4. The response is linear for each of the three analytes with
slopes (in area counts per micrograms of analyte per sample) of 36,600
for
Instrument Response to o-Toluidine
|
| |||
| × target conc. | 0.5× | 1× | 2× |
| µg/sample | 449.7 | 899.3 | 1799 |
| ppm | 1.03 | 2.05 | 4.11 |
|
| |||
| area counts | 103602 | 180031 | 311905 |
| 103921 | 183269 | 319433 | |
| 104083 | 182732 | 315745 | |
| 107357 | 179883 | 325345 | |
| 105446 | 180043 | 324259 | |
| 105706 | 183823 | 314638 | |
| 105019 | 181630 | 318554 | |
|
| |||
Instrument Response to m-Toluidine
|
| |||
| × target conc. | 0.5× | 1× | 2× |
| µg/sample | 433.3 | 866.6 | 1733 |
| ppm | 0.99 | 1.98 | 3.96 |
|
| |||
| area counts | 131144 | 228739 | 398220 |
| 131594 | 233098 | 407556 | |
| 131707 | 232368 | 402949 | |
| 136031 | 228917 | 415059 | |
| 133624 | 228910 | 414073 | |
| 133868 | 233818 | 401662 | |
| 132995 | 230975 | 406586 | |
|
| |||
Instrument Response to p-Toluidine
|
| |||
| × target conc. | 0.5× | 1× | 2× |
| µg/sample | 438.0 | 875.9 | 1752 |
| ppm | 1.00 | 2.00 | 4.00 |
|
| |||
| 157379 | 277113 | 486818 | |
| 157905 | 282392 | 498306 | |
| 157971 | 281618 | 492569 | |
| 163198 | 277168 | 507306 | |
| 160389 | 277185 | 506414 | |
| 160661 | 283227 | 490875 | |
| 159584 | 279784 | 497048 | |
|
| |||
4.5. Storage test
Storage samples were generated by spiking sulfuric
These values were obtained from Figures 4.5.1.2., 4.5.2.2. and 4.5.3.2.
Storage Test for o-Toluidine
|
| ||||||
| days of | % recovery | |||||
| storage | refrigerated | ambient | ||||
|
|
|
| ||||
| 0 | 95.9 | 93.6 | 92.5 | 95.9 | 93.6 | 92.5 |
| 0 | 91.5 | 93.8 | 95.7 | 91.5 | 93.8 | 95.7 |
| 3 | 99.9 | 98.5 | 95.2 | 99.0 | 96.2 | 97.4 |
| 6 | 86.8 | 91.3 | 92.9 | 91.3 | 92.8 | 93.8 |
| 9 | 95.4 | 94.5 | 95.5 | 96.2 | 95.5 | 93.1 |
| 12 | 91.8 | 94.3 | 89.7 | 93.8 | 93.7 | 91.7 |
| 15 | 89.6 | 90.3 | 89.7 | 89.6 | 88.5 | 87.1 |
|
| ||||||
Storage Test for m-Toluidine
|
| |||||||
| days of | % recovery | ||||||
| storage | refrigerated | ambient | |||||
|
|
|
| |||||
| 0 | 96.0 | 93.8 | 92.7 | 96.0 | 93.8 | 92.7 | |
| 0 | 91.6 | 93.7 | 95.2 | 91.6 | 93.7 | 95.2 | |
| 3 | 99.6 | 97.8 | 94.6 | 98.5 | 95.7 | 97.0 | |
| 6 | 87.0 | 91.5 | 93.2 | 92.0 | 93.4 | 94.4 | |
| 9 | 95.5 | 94.4 | 95.7 | 96.5 | 96.2 | 93.4 | |
| 12 | 92.7 | 95.0 | 90.6 | 94.5 | 94.2 | 92.2 | |
| 15 | 89.9 | 90.4 | 89.8 | 89.8 | 88.9 | 87.3 | |
|
| |||||||
Storage Test for p-Toluidine
|
| ||||||
| days of | % recovery | |||||
| storage | refrigerated | ambient | ||||
|
|
|
| ||||
| 0 | 95.1 | 94.0 | 92.2 | 95.1 | 94.0 | 92.2 |
| 0 | 91.3 | 91.9 | 93.5 | 91.3 | 91.9 | 93.5 |
| 3 | 98.2 | 96.1 | 92.7 | 96.4 | 93.5 | 94.5 |
| 6 | 87.4 | 92.4 | 94.3 | 93.3 | 95.2 | 96.0 |
| 9 | 96.8 | 94.4 | 97.7 | 97.8 | 98.1 | 94.3 |
| 12 | 95.1 | 96.0 | 92.2 | 95.7 | 95.7 | 92.8 |
| 15 | 90.8 | 90.9 | 90.6 | 90.0 | 89.2 | 87.3 |
|
| ||||||
4.6. Precision (analytical method only)
The precision of the analytical method for each analyte is the pooled coefficient of variation determined from replicate injections of standards. The precision of the analytical method for each analyte is given in Tables 4.6.1. - 4.6.3. These tables are based on the data presented in Section 4.4.
Precision of the Analytical Method for o-Toluidine
|
| |||
| × target conc. | 0.5× | 1× | 2× |
| µg/sample | 449.7 | 899.3 | 1799 |
| ppm | 1.03 | 2.05 | 4.1 |
|
| |||
| SD (area counts) | 1429 | 1835 | 5420 |
| CV | 0.014 | 0.010 | 0.017 |
|
| |||
Precision of the Analytical Method for m-Toluidine
|
| |||
| × target conc. | 0.5× | 1× | 2× |
| µg/sample | 433.3 | 866.6 | 1733 |
| ppm | 0.99 | 1.98 | 3.96 |
|
| |||
| SD (area counts) | 1867 | 2368 | 6874 |
| CV | 0.014 | 0.010 | 0.017 |
|
| |||
Precision of the Analytical Method for p-Toluidine
|
| |||
| × target conc. | 0.5× | 1× | 2× |
| µg/sample | 438.0 | 875.9 | 1752 |
| ppm | 1.00 | 2.00 | 4.00 |
|
| |||
| SD (area counts) | 2243 | 2924 | 8454 |
| CV | 0.014 | 0.010 | 0.017 |
|
| |||
4.7. Precision (overall procedure)
The precision of the overall procedure is determined from the storage data. The determination of the standard error of estimate (SEE) for a regression line plotted through the graphed storage data allows the inclusion of storage time as one of the factors affecting overall precision. The SEE is similar to the standard deviation, except it is a measure of dispersion of data about a regression line instead of about a mean. It is determined with the following equation:

| where | ||
| n | = | total no. of data points |
| k | = | 2 for a linear regression |
| k | = | 3 for a quadratic regression |
| Yobs | = | observed % recovery at a given time |
| Yest | = | estimated % recovery from the regression line at the same given time |
An additional 5% for pump error is added to the SEE by the addition
of variances; The precision at the 95% confidence level is obtained by
multiplying the SEE (with pump error included) by 1.96 (the
4.8. Reproducibility
Six samples were prepared by injecting microliter quantities of
standards onto
Reproducibility for o-Toluidine
|
| ||||
| sample no. | µg found | µg expected | % found | % deviation |
|
| ||||
| 1 | 1013 | 1066 | 95.0 | -5.0 |
| 2 | 1962 | 2084 | 94.1 | -5.9 |
| 3 | 1167 | 1187 | 98.3 | -1.7 |
| 4 | 1942 | 2084 | 93.2 | -6.8 |
| 5 | 1142 | 1187 | 96.2 | -3.8 |
| 6 | 1068 | 1066 | 100.2 | +0.2 |
|
| ||||
Reproducibility for m-Toluidine
|
| ||||
| sample no. | µg found | µg expected | % found | % deviation |
|
| ||||
| 1 | 912.7 | 960.5 | 95.0 | -5.0 |
| 2 | 1772 | 1877 | 94.4 | -5.6 |
| 3 | 1052 | 1070 | 98.3 | -1.7 |
| 4 | 1754 | 1877 | 93.4 | -6.6 |
| 5 | 1029 | 1070 | 96.2 | -3.8 |
| 6 | 961.5 | 960.5 | 100.1 | +0.1 |
|
| ||||
Reproducibility for p-Toluidine
|
| ||||
| sample no. | µg found | µg expected | % found | % deviation |
|
| ||||
| 1 | 718.2 | 756.8 | 94.9 | -5.1 |
| 2 | 1402 | 1479 | 94.8 | -5.2 |
| 3 | 829.0 | 842.8 | 98.4 | -1.6 |
| 4 | 1386 | 1479 | 93.7 | -6.3 |
| 5 | 811.0 | 842.8 | 96.2 | -3.8 |
| 6 | 756.7 | 756.8 | 100.0 | 0.0 |
|
| ||||
4.9. Generation apparatus for collection efficiency studies
Vapor generation rates were determined for each isomer using the
generation apparatus as described in Section 2.4.1.
The tests were conducted by injecting known amounts of toluidine
standards (in \toluene) into an empty impinger which were equivalent
to approximately 4 ppm for a 100-L air sample. The actual amounts were
1749 µg of
Generation Rate for 1749 µg of o-Toluidine
|
| |||
| time (min) | µg found | cumulative µg | cumulative % |
|
| |||
| 0 to 10 | 1255 | 1255 | 71.8 |
| 10 to 20 | 427.4 | 1682 | 96.2 |
| 20 to 30 | 48.4 | 1731 | 99.0 |
| 30 to 40 | -- | 1731 | 99.0 |
| 40 to 50 | -- | 1731 | 99.0 |
| 50 to 100 | -- | 1731 | 99.0 |
|
| |||
Generation Rate for 1757 µg of m-Toluidine
|
| |||
| time (min) | µg found | cumulative µg | cumulative % |
|
| |||
| 0 to 10 | 1423 | 1423 | 81.0 |
| 10 to 20 | 253.6 | 1677 | 95.4 |
| 20 to 30 | 55.1 | 1732 | 98.5 |
| 30 to 40 | 20.9 | 1753 | 99.8 |
| 40 to 50 | 5.7 | 1758 | 100.1 |
| 50 to 100 | -- | 1758 | 100.1 |
|
| |||
Generation Rate for 1750 µg of p-Toluidine
|
| |||
| time (min) | µg found | cumulative µg | cumulative % |
|
| |||
| 0 to 10 | 1229 | 1229 | 70.2 |
| 10 to 20 | 316.1 | 1545 | 88.3 |
| 20 to 30 | 103.6 | 1649 | 94.2 |
| 30 to 40 | 35.8 | 1684 | 96.2 |
| 40 to 50 | 12.6 | 1697 | 97.0 |
| 50 to 100 | 6.9 | 1704 | 97.4 |
|
| |||
4.10. Extraction efficiency
Six sample filters for each amine were spiked with the target
concentration amounts by liquid injection (899.3 µg of
Extraction Efficiency for o-Toluidine
|
| ||
| sample no. | % extracted | after 24 h |
|
| ||
| 1 | 98.3 | 99.7 |
| 2 | 97.3 | 99.6 |
| 3 | 99.5 | 103.1 |
| 4 | 98.7 | 99.4 |
| 5 | 101.5 | 103.2 |
| 6 | 100.4 | 101.9 |
| 99.3 | 101.2 | |
|
| ||
Extraction Efficiency for m-Toluidine
|
| ||
| sample no. | % extracted | after 24 h |
|
| ||
| 1 | 98.2 | 99.4 |
| 2 | 97.0 | 99.3 |
| 3 | 99.2 | 102.8 |
| 4 | 98.6 | 99.1 |
| 5 | 101.2 | 102.9 |
| 6 | 100.1 | 101.3 |
| 99.0 | 100.8 | |
|
| ||
Extraction Efficiency for p-Toluidine
|
| ||
| sample no. | % extracted | after 24 h |
|
| ||
| 1 | 97.5 | 98.8 |
| 2 | 96.4 | 98.7 |
| 3 | 98.6 | 102.2 |
| 4 | 97.9 | 98.5 |
| 5 | 100.5 | 102.2 |
| 6 | 99.4 | 100.8 |
| 98.4 | 100.2 | |
|
| ||
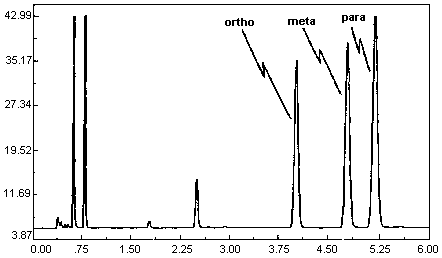
4.11. Chromatogram
A chromatogram of an analytical standard is shown in Figure 4.11.
The chromatogram is from a 1.0-µL injection of a standard
approximately equal to the target concentration for each analyte
(899.3, 866.6, and 875.9 µg of o-, m-, and
5. References
- 5.1. "Chemical Information Manual", U.S
Department of Labor, Occupational Safety and Health Administration,
OSHA Instruction CPL 2-2.43, Directorate of Technical Support;
National Technical Information Service: Springfield, VA 22161, October
20, 1987.
5.2. "NIOSH Manual of Analytical Methods", 2nd ed.; U.S Department of Health, Education, and Welfare, National Institute for Occupational Safety and Health: Cincinnati, OH, 1977; Vol. 3, Method No. S168; DHEW(NIOSH) Publ.(U.S.), No. 77-157-C.
5.3. Elskamp, C. J. "OSHA Method No. 71; o-Dianisidine, 4,4'-Methylenebis(2-chloroaniline) o-Tolidine", OSHA Analytical Laboratory, unpublished, Salt Lake City, UT 84165, April 1988.
5.4. Elskamp, C. J. "OSHA Method No. 65;
Benzidine, 3,3'-Dichlorobenzidine, 2,4-Toluenediamine,
5.5. Elskamp, C. J. "OSHA Method No. 57; 4,4-Methylenedianilin" OSHA Analytical Laboratory, unpublished, Salt Lake City, UT 84165, January 1986.
5.6. "Documentation of the Threshold Limits Values and Biological Exposure Indices", 5th ed.; American Conference of Governmental Industrial Hygienists Inc.: Cincinnati, OH, 1986; pp 586-591.
5.7. "Threshold Limit Values and Biological Exposure Indices for 1987-1988"; American Conference of Governmental Industrial Hygienists Inc.: Cincinnati, OH, 1987.
5.8. "Code of Federal Regulations"; Office of the Federal Register National Archives and Records Service; U.S Government Printing Office: Washington, DC, 1985, 29 CFR Ch. XVII (7-1-85 Edition) 1910.1000, Table Z-1.
5.9. Sax, N. I. "Dangerous Properties of Industrial Materials"; Van Nostrand Reinhold: New York, 1979; p 1036.


